Your Path to Mastering R
t.test() Function in R
R language provides us with a simple t.test built-in function for One Sample, Two Samples, and Paired t-tests.
There are two ways of using the t.test function: default and formula methods.
Default method
You provide numerical samples from the x group and y group, specifying the alternative hypothesis, hypothesized mean mu, and confidence level of the interval. Moreover, you can perform Paired t-test by toggling the paired argument and Two Sample t-test with equal variance by changing var.equal argument.
t.test(x, y,
      alternative = c("two.sided", "less", "greater"),
      mu = 0, paired = FALSE, var.equal = FALSE,
      conf.level = 0.95, ...)
Formula method
In this method, you provide the formula x~y, where x is a numeric vector or a column from the data, and y is a binary column containing the types of groups.
t.test(formula, data, subset, na.action, ...)How to Perform One Sample t-test in R
One-sample t-test is the statistical hypothesis to test if there is a significant difference between the sample mean and hypothesis or assumed population mean. The test compares the sample mean to the hypothesis mean, while considering the variability in the data.
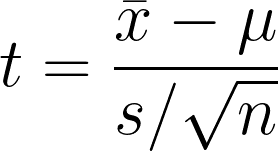
- x̄1 = Sample mean
- μ = Hypothesized population mean
- s = Sample standard deviation
- n = Sample size
In this tutorial, we will be using Carbon Dioxide Uptake in Grass Plants R dataset for t-test code examples. The dataset has 84 rows and 5 columns, and it was collected from an experiment to test the cold tolerance of the grass species Echinochloa crus-galli. We will be mostly considering uptake, Treatment, and Type columns for our tests.
head(CO2)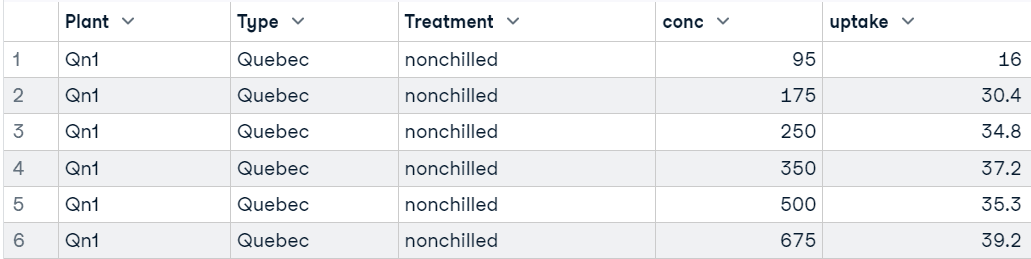
In the example, we will be using the conc (carbon dioxide concentrations) column from the dataset.
We can observe the mean, distribution, and outliers using a boxplot.
boxplot(CO2$conc)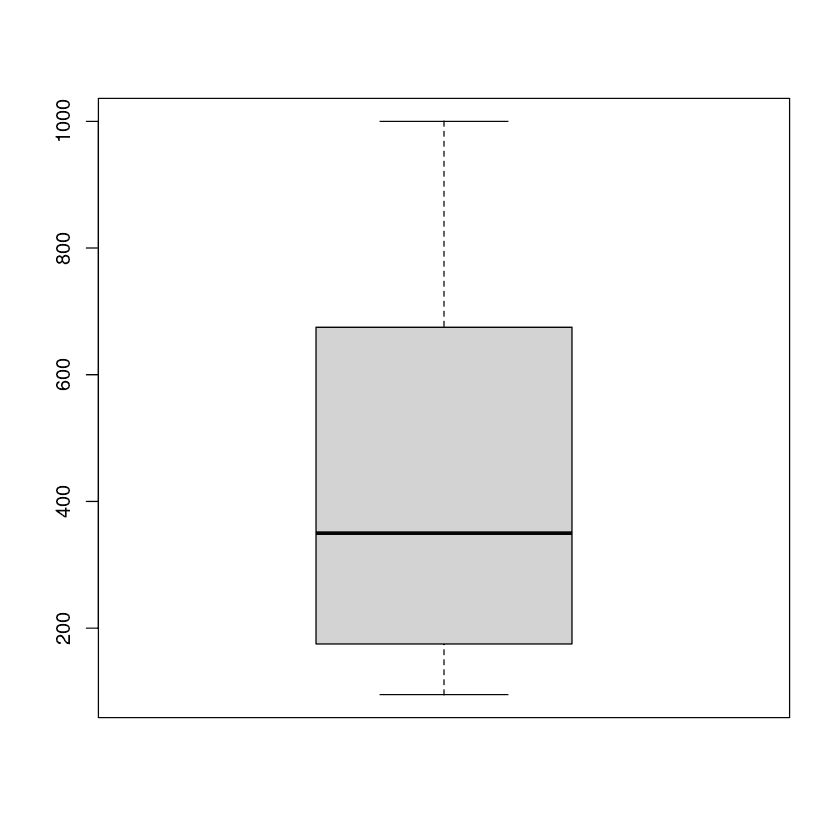
For a one-sample t-test, we will be using `t.test(x,mu=0)`. Where x is the variable, mu is set by the null hypothesis. In our case, it is 550.
t.test(CO2$conc, mu = 550)Result:
The concentration of carbon dioxide is not equal to 550 and significantly lower than the hypothesized population mean.
One Sample t-test

data:  CO2$conc
t = -3.5617, df = 83, p-value = 0.0006134
alternative hypothesis: true mean is not equal to 550
95 percent confidence interval:
370.7805 499.2195
sample estimates:
mean of x
      435
How to Perform Two Sample t-test in R
In the Two Sample t-tests, we will be comparing carbon dioxide uptake rates of two treatment types: non-chilled and chilled.
We can visualize the distribution of two groups using a boxplot.
plot(uptake ~ Treatment, data=CO2)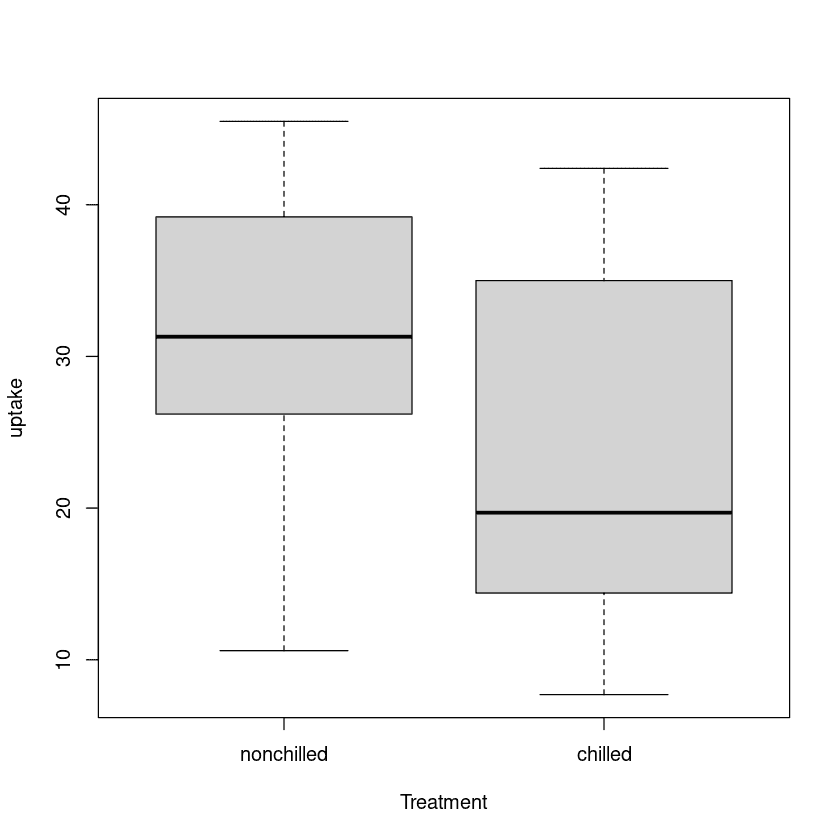
Welch Two Sample t-test
It is a statistical hypothesis that investigates if there is a significant difference between the mean of two independent groups that may have unequal variance. The test is comparing the means of two groups while considering the variability within each group.
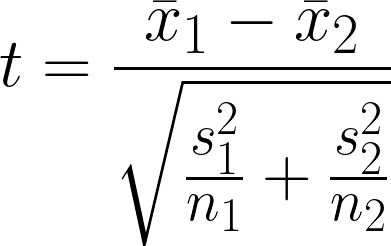
- x̄1 = Sample mean of first group
- x̄2 = Sample mean of second group
- n1 = Sample size of first group
- n2 = Sample size of second group
- s12 = Sample variance of first group
- s22 = Sample variance of second group
By default, the t.test() function assumes that the variance of two groups is unequal (var.equal=FALSE). So, we don’t have to make any changes.
We are using the formula method to obtain t-test results, where uptake is a numerical vector and Treatment is a binary category column of the CO2 dataset.
t.test(uptake ~ Treatment, data = CO2)Result:
There is a significant difference in the means of the two groups, and the nonchilled group has higher uptake than the chilled group.
 Welch Two Sample t-test

data:  uptake by Treatment
t = 3.0485, df = 80.945, p-value = 0.003107
alternative hypothesis: true difference in means between group nonchilled and group chilled is not equal to 0
95 percent confidence interval:
  2.382366 11.336682
sample estimates:
mean in group nonchilled    mean in group chilled
                30.64286                 23.78333
Two Sample t-test with Equal Variance
The Two Sample t-test is a statistical hypothesis test to determine if there is a significant difference between the mean of two independent groups while assuming that the variance of the two groups is equal. The test compares the means of two groups while considering the variability within each group.
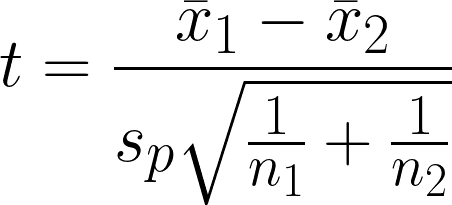
- x̄1 = Sample mean of first group
- x̄2 = Sample mean of second group
- n1 = Sample size of first group
- n2 = Sample size of second group
- sp = Pooled standard deviation
To perform Two Sample t-tests with equal variance, we have to set var.equal TRUE and run the test again with the same formula and dataset.
t.test(uptake ~ Treatment, data = CO2, var.equal = TRUE)Result:
As we can see, we got almost similar results that there is a significant mean difference between the two groups.
Two Sample t-test

data:  uptake by Treatment
t = 3.0485, df = 82, p-value = 0.003096
alternative hypothesis: true difference in means between group nonchilled and group chilled is not equal to 0
95 percent confidence interval:
  2.38324 11.33581
sample estimates:
mean in group nonchilled    mean in group chilled
                30.64286                 23.78333
How to Perform Paired t-test in R
Paired t-test is a statistical hypothesis that is used to determine if there is a significant difference between the means of two related or paired samples. It calculates the t-test value by comparing the differences between the paired observations while considering the variability within the difference.
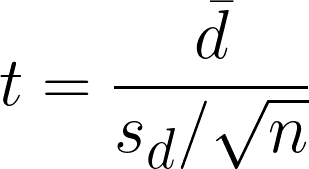
- dࠡ = differences of mean in paired observations
- sd = differences of standard deviation of sample
- n = number of pairs
To perform Paired t-test in R, we have to set paired argument TRUE and run the test again with the same formula and dataset.
t.test(uptake ~ Treatment, paired = TRUE, data = CO2)Result:
There is a statistically significant difference between the means of the two groups while considering the t and p-value.
Paired t-test

data:  uptake by Treatment
t = 7.939, df = 41, p-value = 8.051e-10
alternative hypothesis: true mean difference is not equal to 0
95 percent confidence interval:
5.114589 8.604458
sample estimates:
mean difference
      6.859524
In the second example, we will factor the rate of uptake for two types of the same plant. One originated from Quebec, and another is from Mississippi.
plot(uptake ~ Type, data=CO2)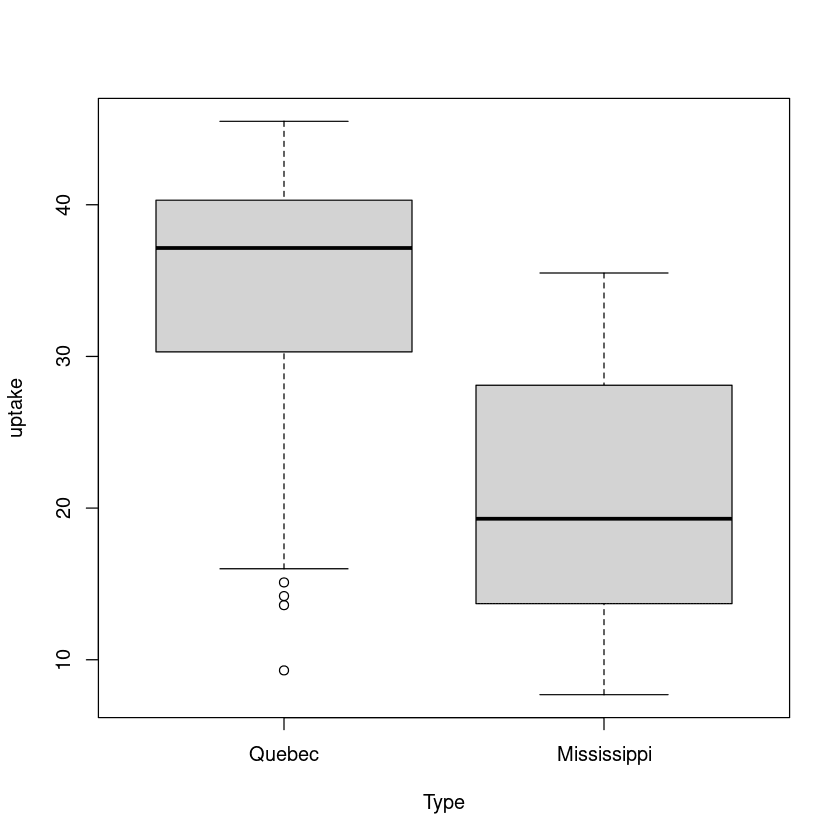
Let’s check the paired t-test results by replacing the Treatment with the type in the formula.
t.test(uptake ~ Type, paired = TRUE, data = CO2)Result:
Again, there is a significant difference between the mean of the Quebec and Mississippi group.
 Paired t-test

data:  uptake by Type
t = 11.374, df = 41, p-value = 2.937e-14
alternative hypothesis: true mean difference is not equal to 0
95 percent confidence interval:
10.41177 14.90727
sample estimates:
mean difference
      12.65952
Try the t-test in R DataLab Workbook. It comes with code sources and results. You can also duplicate the workbook and start practicing on different examples.
Note: A strong statistics foundation will serve you well, no matter which industry you belong to. Statistics is the backbone of modern AI, and you should start your journey by taking Statistics Fundamentals with R skill track.
How to Interpret t-test Results in R
We are generating the results, but what do df, p-value, alternative hypothesis, or sample estimates mean? In this section, we will learn how to interpret the t-test results in R.
Let’s start by creating two groups using the rnorm function and run the Two Sample t-tests.
set.seed(125)

group1 <- c(rnorm(100, mean = 24, sd = 3))
group2 <- c(rnorm(100, mean = 43, sd = 2.4))

t.test(group1, group2)Output:
 Welch Two Sample t-test

data:  group1 and group2
t = -47.765, df = 179.99, p-value < 2.2e-16
alternative hypothesis: true difference in means is not equal to 0
95 percent confidence interval:
-19.51569 -17.96722
sample estimates:
mean of x mean of y
24.30063 43.04208 - data: the data used in Two Sample t-test (group1 and group2)
- t: t test-statistic. The negative t-value of -47.765 indicates that the group1 sample mean is significantly smaller than group2.
- df: it is the degree of freedom associated with the t-test value.
- p-value: indicates the statistical significance of the result. The p-value is 2.2e-16 which is lower than alpha (0.005), indicating that the probability of obtaining such a large difference between the two groups by chance is very small.
- alternative hypothesis: we can set the alternative hypothesis. In our case, it was set to check if the true difference in means is not equal to zero.
- 95 percent confidence interval: 95% confident that the true population means the difference between the two groups lies within the range of -19.51569, -17.96722.
- sample estimates: it tells us the sample means of each group where group1 and group2 are 24.30063 and 43.04208, respectively. It means that, on average, group2 has a higher value than group1.
There are two hypotheses for the t-test:
- H0: µ1 = µ2: the two population mean are equal.
- HA: µ1 ≠µ2: the two population means are not equal.
In conclusion, the results of the Welch Two Sample t-test suggest that there is strong evidence that there is a statistically significant difference between group1 and group2.
Conclusion
In this tutorial, we have learned about One Sample, Two Samples, and Paired t-tests with R programming examples and how to interpret the result.
The t-test is one of many statistical tools used in hypothesis testing, and if you want to learn everything about hypothesis testing, take an interactive Hypothesis Testing in R course. The course covers t-tests, ANOVA, proportion tests, and chi-square tests.
You can also go beyond and enroll in our Statistician with R career track to master the essential skills and land a job as a statistician.