Course
ANOVA provides a way to test if there are significant differences between group means, helping researchers determine if the variation in data is due to actual differences between groups or just random chance. This method is beneficial when dealing with experiments or studies that involve more than two groups, where traditional t-tests may not be appropriate or efficient.
This article will explore the fundamentals of the ANOVA test, its purpose, the two main types, and a step-by-step guide to performing ANOVA. Understanding these concepts can help you choose the correct test for your data and interpret results confidently. We will also consider an example to better understand the concept. If you are new to the idea of hypothesis testing in general, read our Hypothesis Testing Made Easy tutorial.
What is an ANOVA Test?
ANOVA stands for Analysis of Variance, a statistical test used to compare the means of three or more groups. It analyzes the variance within the group and between groups. The primary objective is to assess whether the observed variance between group means is more significant than within the groups. If the observed variance between group means is significant, it suggests that the differences are meaningful.
Mathematically, ANOVA breaks down the total variability in the data into two components:
- Within-Group Variability: Variability caused by differences within individual groups, reflecting random fluctuations.
- Between-Group Variability: Variability caused by differences between the means of the different groups.
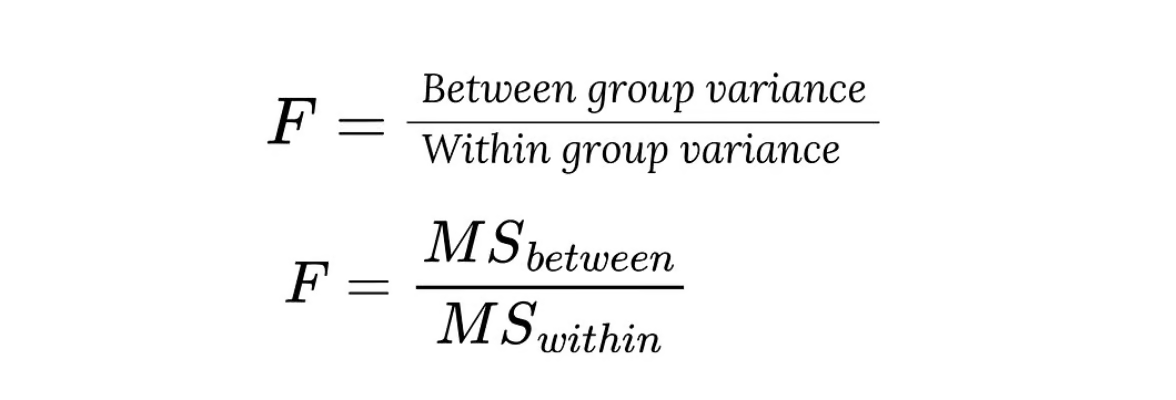
F-statistic to compute ANOVA. Image by Author
The test produces an F-statistic, which shows the ratio between between-group and within-group variability. If the F-statistic is sufficiently large, it indicates that at least one of the group means is significantly different from the others.
To understand this better, consider a scenario where you are asked to assess a student’s performance (exam scores) based on three teaching methods: lecture, interactive workshop, and online learning. ANOVA can help us assess whether the teaching method statistically impacts the student’s exam performance.
The Two Types of ANOVA Test
There are two types of ANOVA: one-way and two-way. Depending on the number of independent variables and how they interact with each other, both are used in different scenarios.
1. One-way ANOVA
A one-way ANOVA test is used when there is one independent variable with two or more groups. The objective is to determine whether a significant difference exists between the means of different groups.
In our example, we can use one-way ANOVA to compare the effectiveness of the three different teaching methods (lecture, workshop, and online learning) on student exam scores. The teaching method is the independent variable with three groups, and the exam score is the dependent variable.
- Null Hypothesis (H₀): The mean exam scores of students across the three teaching methods are equal (no difference in means).
- Alternative Hypothesis (H₁): At least one group’s mean significantly differs.
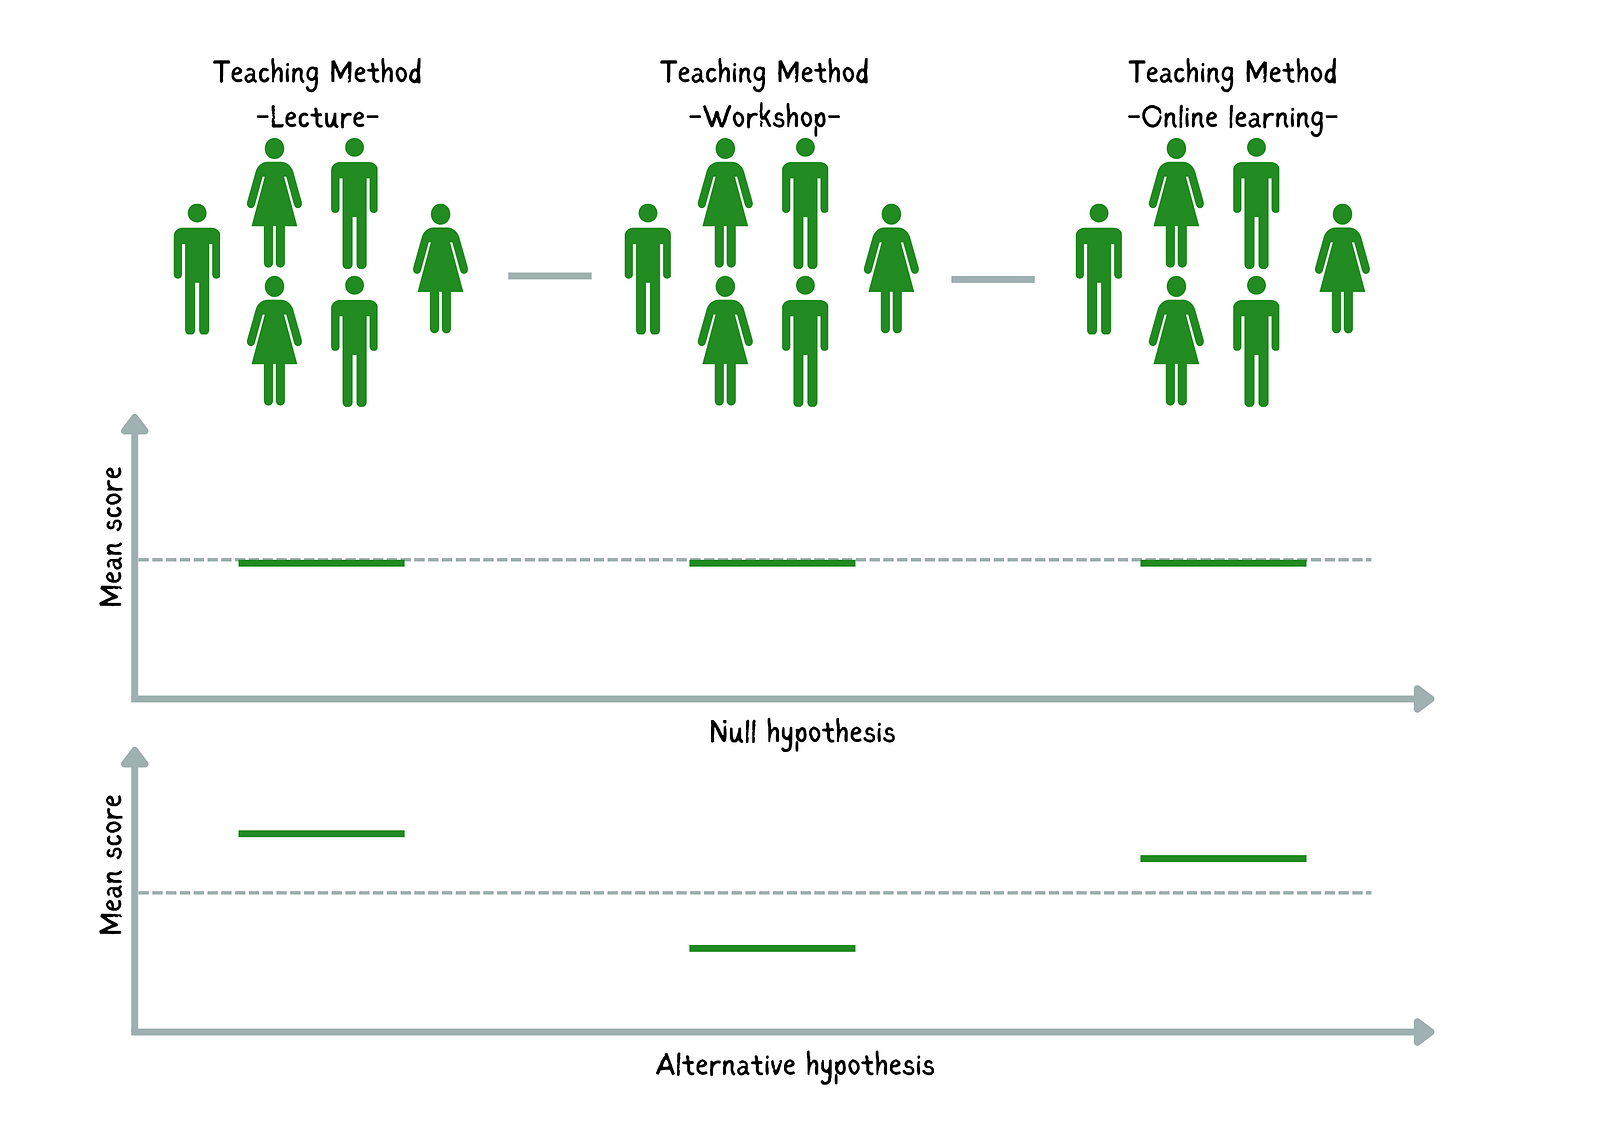 Comparison of the null and alternative hypothesis. Image by Author
The one-way ANOVA test will tell us if the variation in student exam scores can be attributed to the differences in teaching methods or if it’s likely due to random chance.
One-way ANOVA is effective when analyzing the impact of a single factor across multiple groups, making it simpler to interpret. However, it does not account for the possibility of interaction between multiple independent variables, where two-way ANOVA becomes necessary.
2. Two-way ANOVA
Two-way ANOVA is used when there are two independent variables, each with two or more groups. The objective is to analyze how both independent variables influence the dependent variable.
Let’s assume you are interested in the relationship between teaching methods and study techniques and how they jointly affect student performance. The two-way ANOVA is suitable for this scenario. Here we test three hypotheses:
- The main effect of factor 1 (teaching method): Does the teaching method influence student exam scores?
- The main effect of factor 2 (study technique): Does the study technique affect exam scores?
- Interaction effect: Does the effectiveness of the teaching method depend on the study technique used?
For example, two-way ANOVA could reveal that students using the lecture method perform better in group study, and those using online learning might perform better in individual study. Understanding these interactions gives a deeper insight into how different factors together impact outcomes.
ANOVA vs. T-Test
You might be wondering: When should I choose an ANOVA over a t-test? The t-test and ANOVA are used to compare means between groups, but the choice between them depends on the number of groups being compared and the complexity of the data structure.
When to use a T-Test
A t-test is appropriate when comparing the means of two groups. For instance, if we wanted to compare the exam scores of students using just two teaching methods — lecture and workshop — a t-test would be enough. There are two types of t-tests:
- Independent T-Test: Compares two independent groups (e.g., lecture vs. workshop).
- Paired T-Test: Compares means from the same group at different times (e.g., student performance before and after using a particular teaching method).
When to use ANOVA
On the other hand, ANOVA is used when comparing the means of three or more groups. Our study includes three teaching methods (lecture, workshop, and online learning), so something more than a t-test is required. Using multiple t-tests for each pair of groups would increase the risk of Type I error (false positives), whereas ANOVA handles the comparison in one test and controls for this error.
ANOVA Test Assumptions
All statistical tests have assumptions that must be met to ensure valid results.
Here are the assumptions that need to be satisfied for ANOVA:
1. Independence of observations
The observations (data points) must be independent of each other. In the example, students’ exam scores in one teaching method should not influence the scores of students in another method.
2. Homogeneity of variances
The variances within each group should be approximately equal. ANOVA assumes that the variability of exam scores within each teaching method group is roughly the same. This can be tested using Levene’s test, which checks for equal variances.
3. Normal distribution
The data within each group should follow a normal distribution. In our teaching method example, the exam scores for students in each teaching group (Lecture, Workshop, Online learning) should ideally be normally distributed.
If any assumptions are violated, the test results may be invalid. In such cases, it is essential to consider using a non-parametric test.
Performing an ANOVA Test
We will use the same example of comparing different teaching methods to examine how they affect student exam scores. Let’s assume you are provided with the following data showing exam scores (dependent variable) based on the teaching method (independent variable).
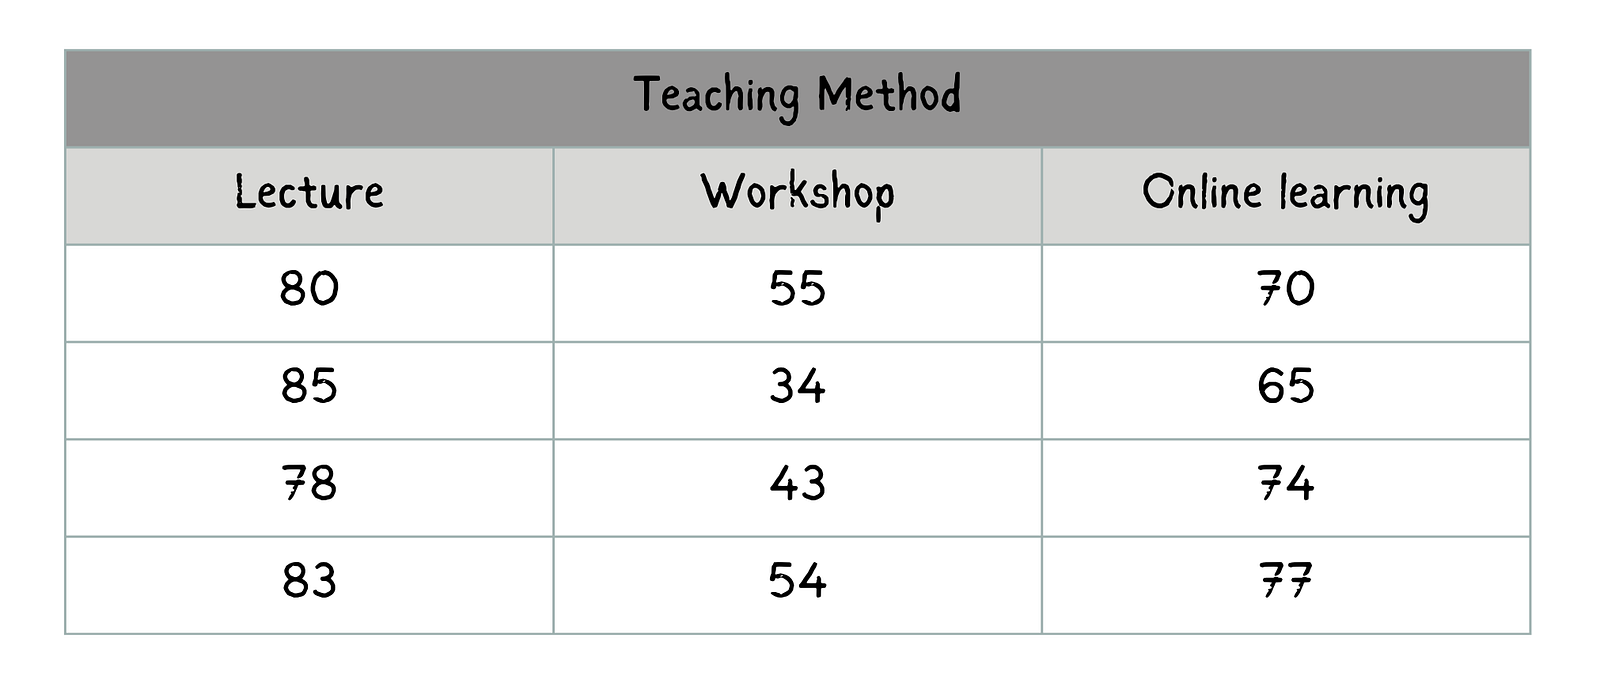 Exam scores for each teaching method for four students each. Image by Author
Step 1: Define the hypothesis
The first step in the process is defining the hypothesis. State the null and alternative hypotheses:
- Null Hypothesis (H₀): The means of exam scores for students across the three teaching methods are equal.
- Alternative Hypothesis (H₁): At least one teaching method has a different mean exam score.

Null hypothesis and Alternative hypothesis. Image by Author
Step 2: Check ANOVA assumptions
Before performing ANOVA, ensure that the assumptions are met. Normality, independence, and homogeneity of variances. For simplicity, let’s assume all the assumptions are met.
Step 3: Calculate ANOVA
Once the assumptions are checked, calculate the ANOVA.
The formula for the F-statistic in one-way ANOVA is defined below.
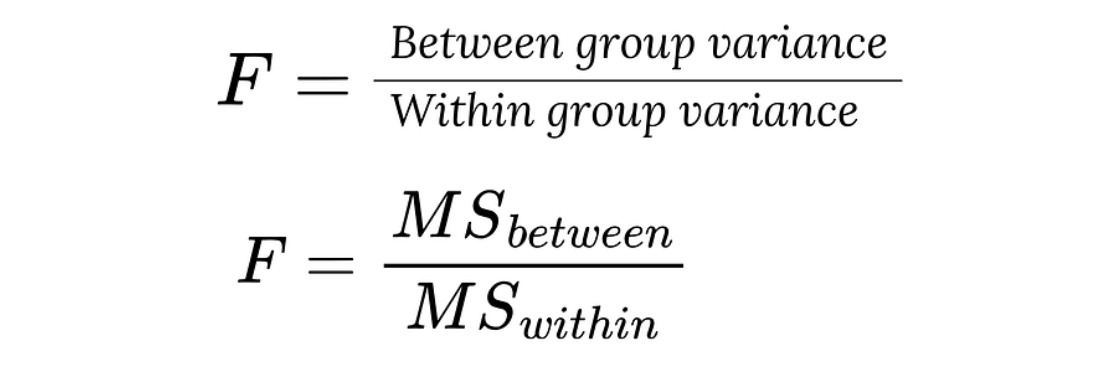
F-statistic in one-way ANOVA. Image by Author
F-statistic in one-way ANOVA is the ratio between the mean square sum between the groups and the mean square sum within the groups.
To arrive at this, let’s go step-by-step.
1. Calculate the mean for each group and the overall mean.
Use the equation below to calculate the mean for each teaching method (Ai). Divide the sum of the exam scores for each group by the number of students in each group.
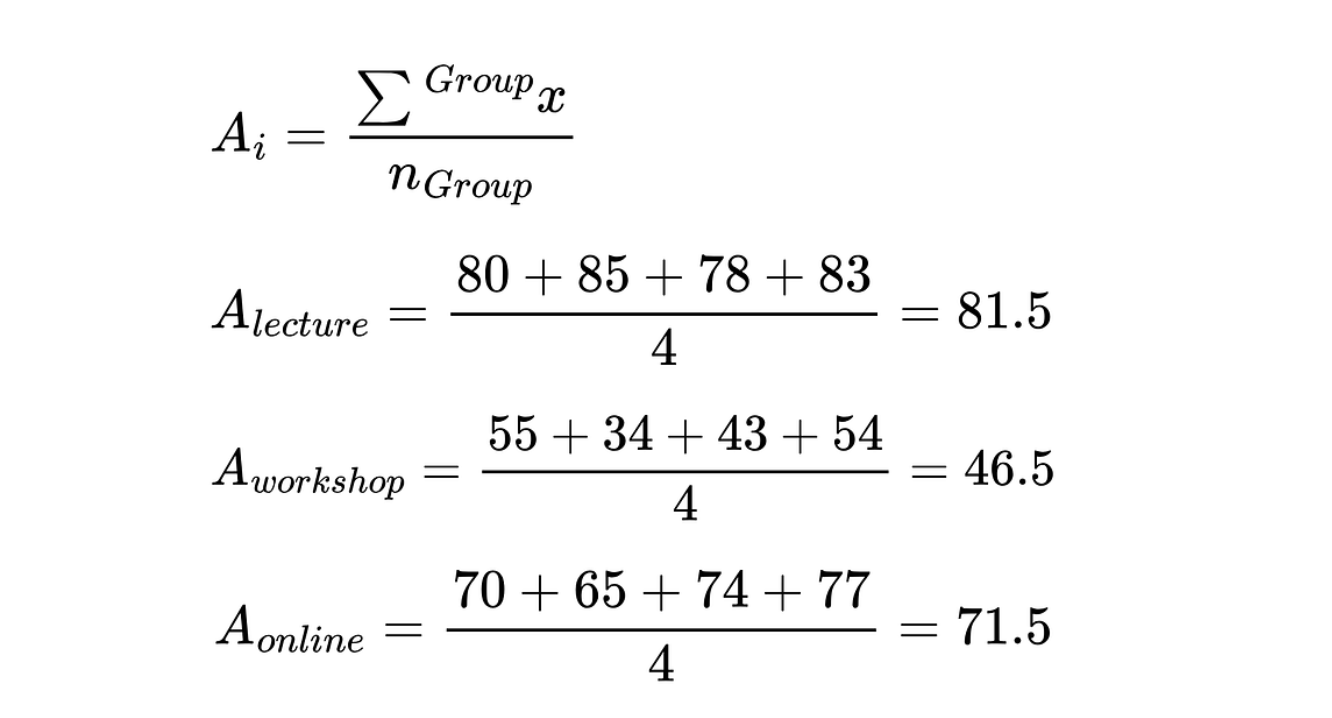
Mean for each group (teaching method). Image by Author
Next, calculate the overall mean (G) by dividing the sum of all the instances by the total number of students.

Overall mean of the exam scores. Image by Author
2. Calculate the sum of squares for each group
The equation is as follows to calculate the sum of squares for each group.
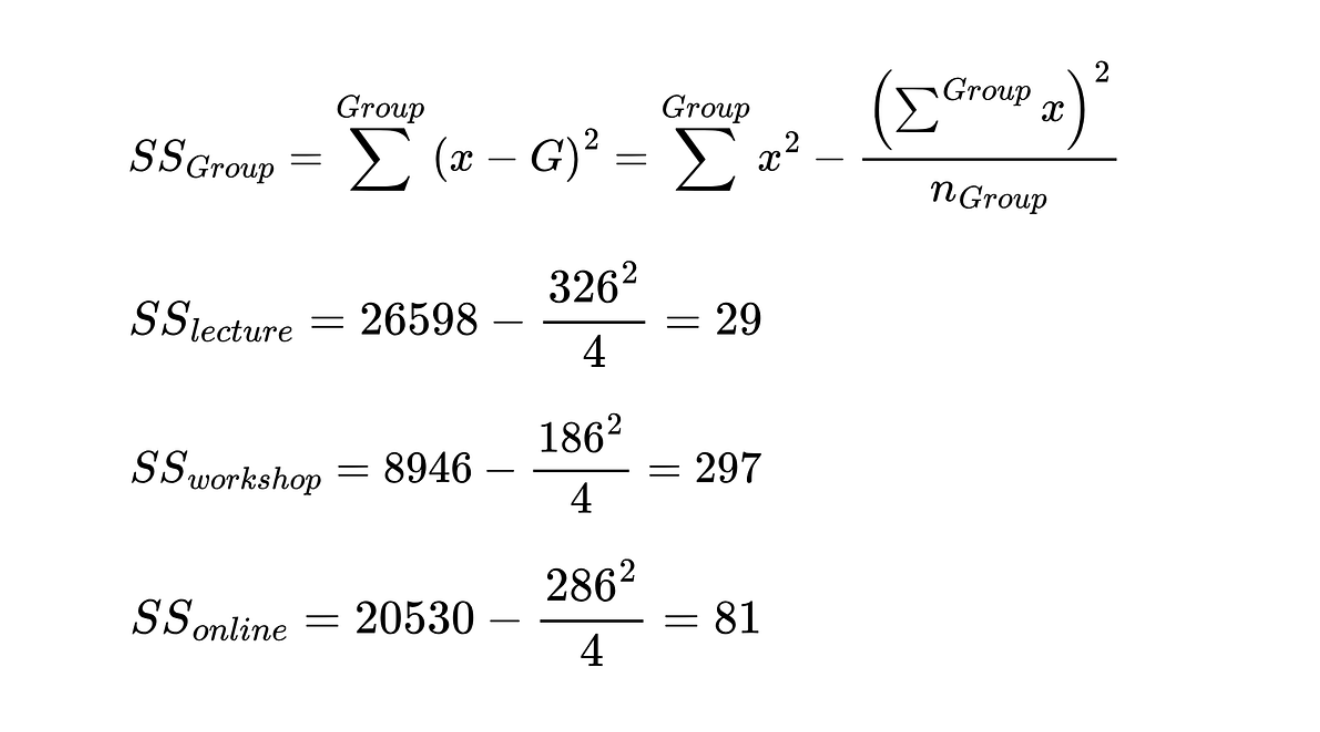
The sum of squares for each method of teaching. Image by Author
After computing, fill this table with the values for easy access.
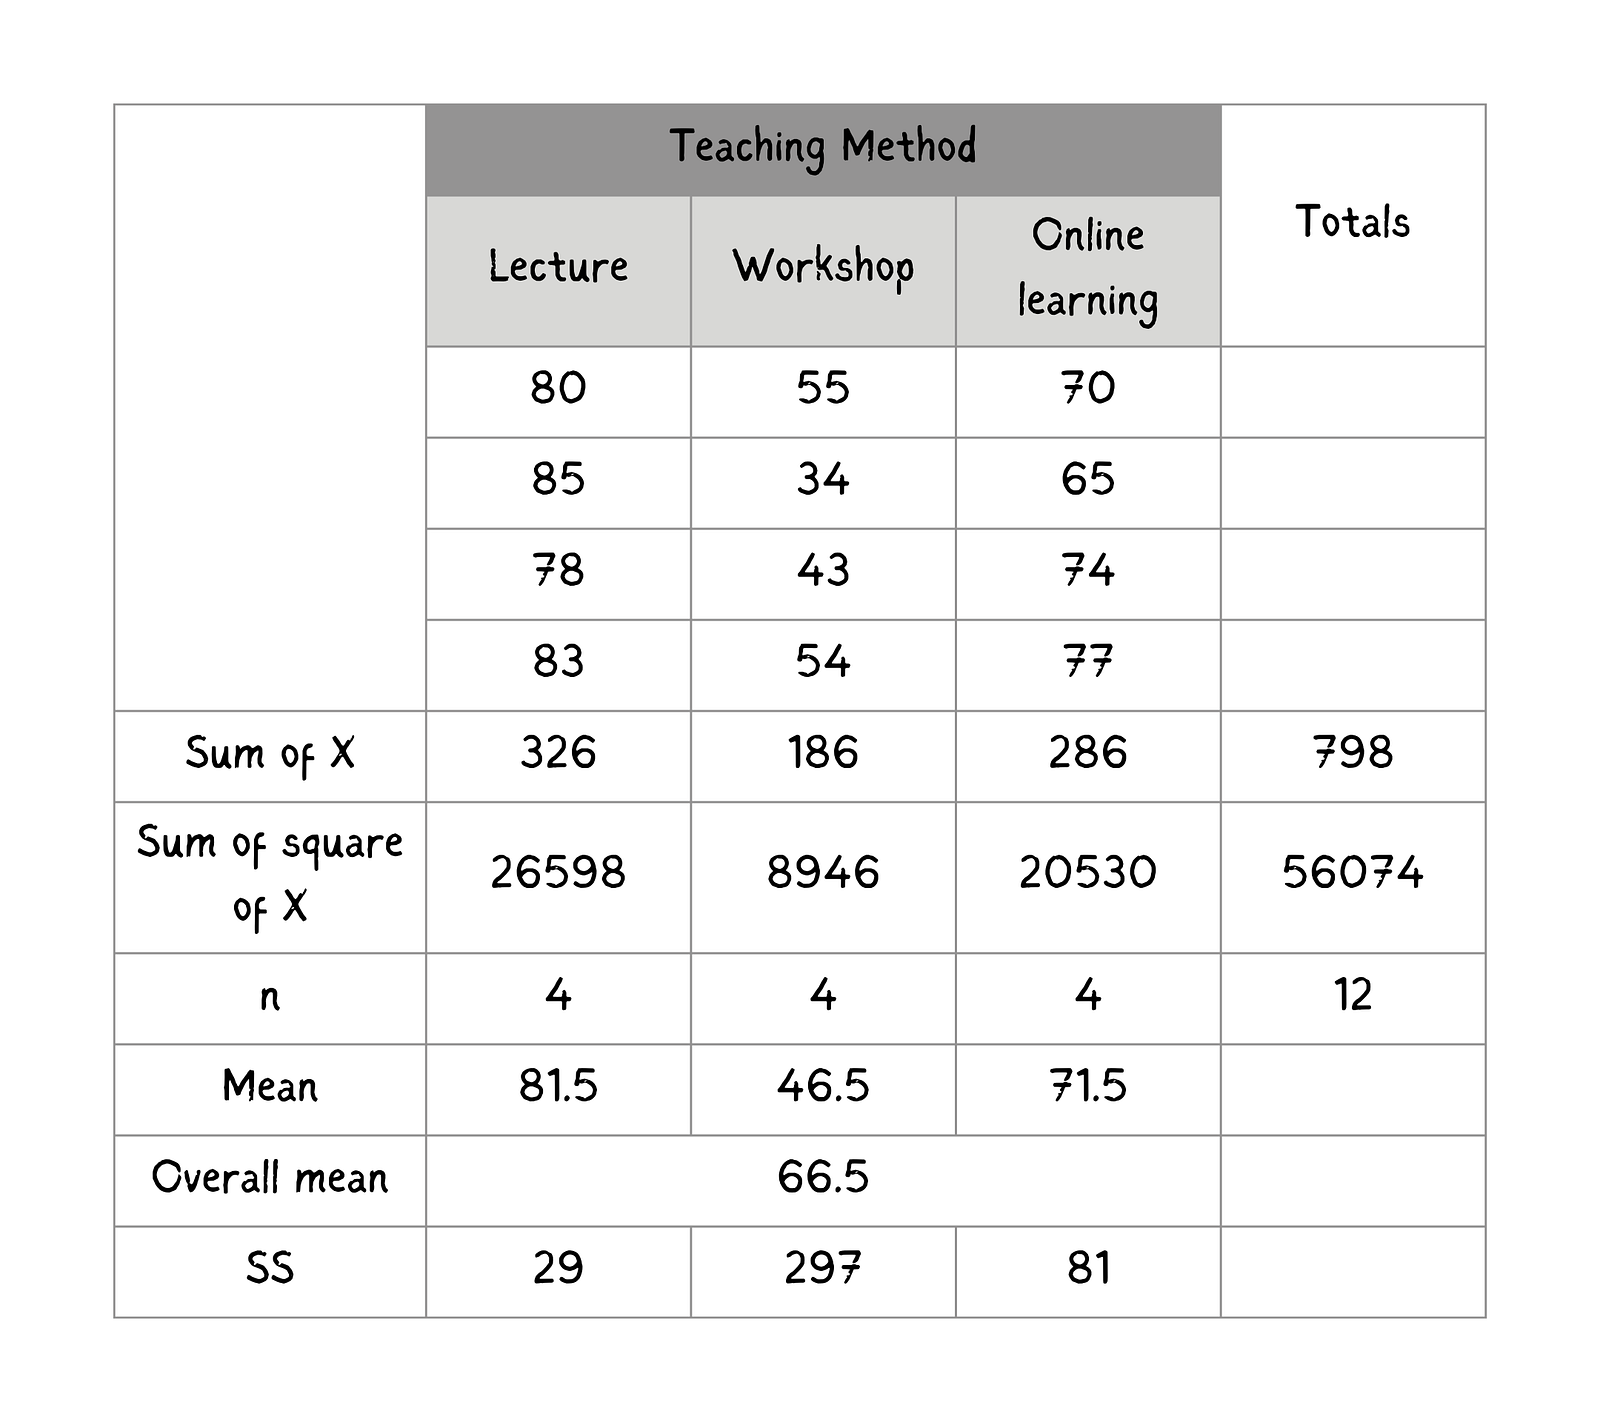 Summary of students' performance by teaching method. Image by Author
3. Calculate the sum of squares between the group, the sum of squares within the group, and the total sum of squares.
Using the equation below, calculate the sum of squares between the groups. In the equation,
- Ai: Mean of the group
- G: Overall mean
- ni: number of instances in each group
Make use of the values from the summary table for the calculation.
 Sum of squares between the group
Next, calculate the sum of squares within the group. It is the summation of the sum of squares (SS) for each group.
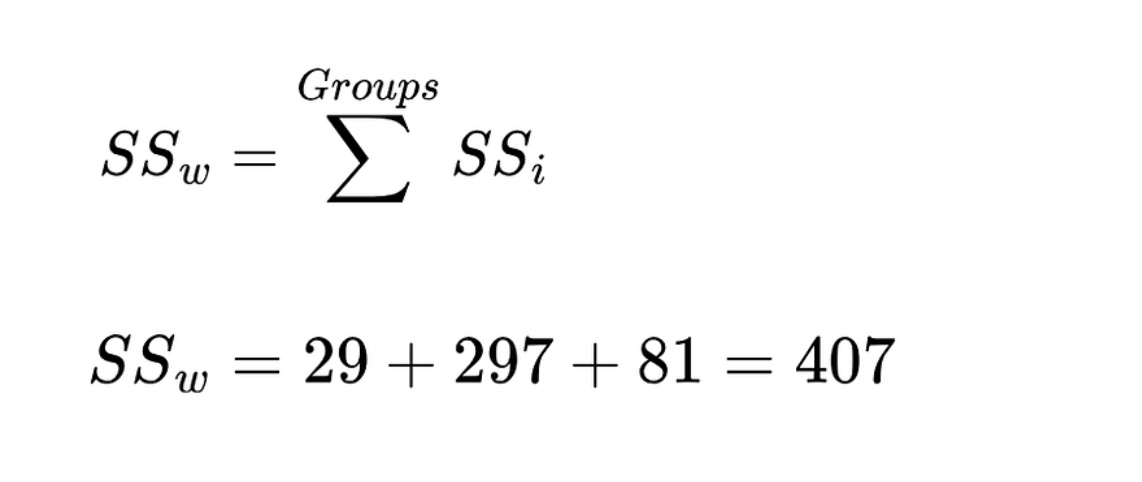
Sum of squares within the group. Image by Author
Use the equation below to calculate the total sum of squares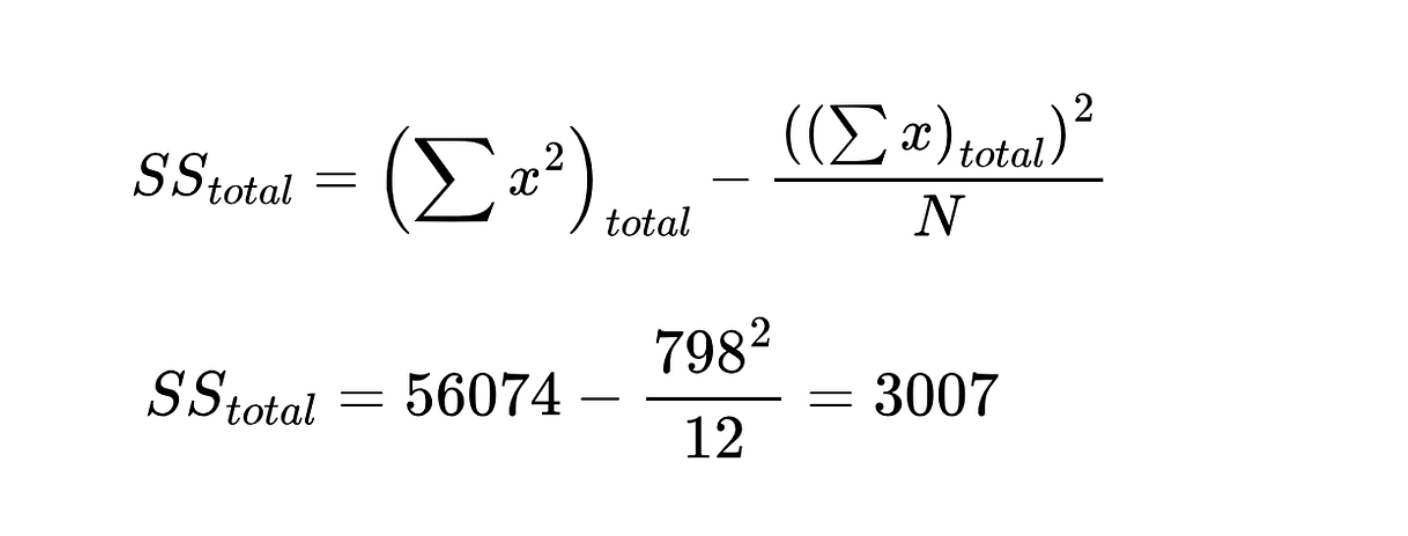 Total sum of squares. Image by Author
Verify the calculation by checking if the total sum of squares is the addition of the sum of squares between the groups and the sum of squares within the group. After verifying, move on to calculating mean squares.
4. Calculate the mean squares
Mean squares is the ratio of square sums to the degree of freedom.
The degree of freedom between groups df_between is equal to the number of groups minus one, and the degree of freedom within groups df_w is equal to the total number of participants minus the number of groups.
With the values calculated in the previous step, compute the mean squares.
 Mean squares between the groups and within the groups. Image by Author
5. Calculate the F-statistic using the equation below
F-statistic is the ratio of the mean square between the group to the mean square within the group.
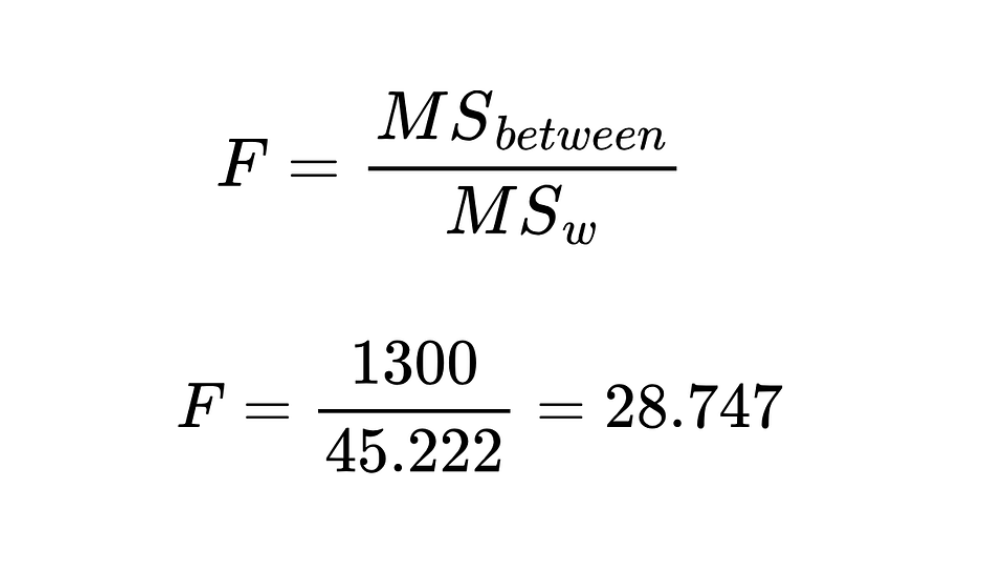
F-statistic. Image by Author
The computed value of the F-statistic is 28.747.
Finally, the p-value is computed using the F-statistic, degree of freedom df, and F-distribution table.
In this example, the numerator df is 2, the denominator df is 9, and the F-statistic is 28.747. Therefore, the p-value from the F-distribution table is 0.000123.
Step 4: Interpret the results
- F-statistic: The F-statistic measures the ratio of between-group variation to within-group variation. A higher F-statistic indicates a more significant difference between group means relative to random variation.
- P-value: The p-value determines whether the differences between group means are statistically significant. If the p-value is below a predefined threshold (commonly 0.05), reject the null hypothesis and conclude that at least one group has a significantly different mean.
The p-value is 0.000123, and we would reject the null hypothesis to conclude that the teaching method significantly affects exam scores.
Post-Hoc Tests After ANOVA
ANOVA tells us whether there is a statistically significant difference between group means, but it doesn’t specify which groups are significantly different from one another. This is the role of post-hoc tests — they perform pairwise comparisons between the groups to identify precisely where the differences exist. When you have more than two groups, these tests are essential, and the ANOVA result is significant.
Continuing with our example, the test reveals a significant difference in student exam scores after performing the one-way ANOVA on the three teaching methods (Lecture, Workshop, and Online learning). A post-hoc test will help us determine which teaching methods impact exam performance differently.
Tukey’s Honestly Significant Difference (HSD) and Bonferroni Correction are widely used post-hoc tests.
Alternatives to ANOVA
If the assumptions of ANOVA are not met, or when ANOVA isn’t suitable for the data set, consider the following alternatives.
- Kruskal-Wallis Test: It is a non-parametric alternative to one-way ANOVA when the normality assumption is violated. It is an extended version of the Mann-Whitney U test.
- MANOVA (Multivariate Analysis of Variance): It extends the principles of ANOVA to multiple dependent variables. It tests whether the mean vectors of multiple dependent variables differ across groups.
Conclusion
This article introduced the core concepts of ANOVA and highlighted when to use it versus a t-test. We learned that ANOVA is a robust statistical analysis that compares multiple groups simultaneously. We provided a step-by-step guide to performing ANOVA, detailing how to formulate hypotheses, check assumptions, and interpret results.
To get hands-on experience using ANOVA in Excel, check out the Comprehensive Guide to Using ANOVA in Excel tutorial. Consider taking the Foundations of Inference in Python and Inferential Statistics courses to broaden your knowledge of statistics.

As a senior data scientist, I design, develop, and deploy large-scale machine-learning solutions to help businesses make better data-driven decisions. As a data science writer, I share learnings, career advice, and in-depth hands-on tutorials.
Frequently Asked Questions
What is ANOVA, and why is it used?
ANOVA, or Analysis of Variance, is a statistical test that compares the means of three or more groups. It helps determine whether observed differences between groups are significant or due to random chance.
What is the difference between one-way and two-way ANOVA?
One-way ANOVA compares the means of groups based on one independent variable. Two-way ANOVA examines the impact of two independent variables and their interaction.
When should I use ANOVA instead of a t-test?
Use ANOVA when comparing the means of three or more groups. A t-test is appropriate for comparing the means of two groups.
What are the key assumptions for performing ANOVA?
ANOVA requires independence of observations, homogeneity of variances (equal variances across groups), and normal data distribution within each group.
What does a significant F-statistic indicate in ANOVA?
A significant F-statistic means that at least one group's mean is significantly different, indicating that the differences between groups are not due to random chance.


