Course
Introduction to Data Science in Python
4 hr
498.3K

Dash is Python framework for building web applications. It built on top of Flask, Plotly.js, React and React Js. It enables you to build dashboards using pure Python. Dash is open source, and its apps run on the web browser. In this tutorial, we introduce the reader to Dash fundamentals and assume that they have prior experience with Plotly.
In order to start using Dash, we have to install several packages.
pip install dash==0.21.1
pip install dash-renderer==0.13.0
pip install dash-html-components==0.11.0
pip install dash-core-components==0.23.0
pip install plotly --upgradeA Dash application is usually composed of two parts. The first part is the layout and describes how the app will look like and the second part describes the interactivity of the application. Dash provides HTML classes that enable us to generate HTML content with Python. To use these classes, we need to import dash_core_components and dash_html_components. You can also create your own custom components using Javascript and React Js.
To kick us off we shall create a file called app.py using our favorite text editor then import these packages.
import dash
import dash_core_components as dcc
import dash_html_components as html
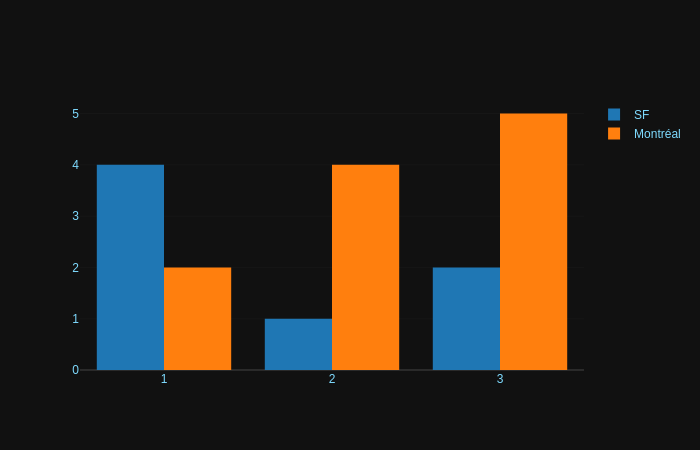
Just like in Flask we initialize Dash by calling the Dash class of dash. Once that is done we can create the layout for our application. We use the Div class from the dash_html_components to create an HTML Div. We then use the HTML components to generate HTML components such as H1, H2 etc. dash_html_components has all HTML tags. In order to create a graph on our layout, we use the Graph class from dash_core_components. Graph renders interactive data visualizations using plotly.js. The Graph class expects a figure object with the data to be plotted and the layout details. Dash also allows you to do stylings such as changing the background color and text color. You can change the background by using the style attribute and passing an object with your specific color. In our case, we have defined a color dictionary with the background and text color we would like. Similarly, we can change the layout background using the plot_bgcolor attribute.
In HTML the style property is specified using a semicolon, but in Dash, a dictionary is supplied. The keys in the dictionary are camelCased e.g text-align is textAlign. Instead of using classes like in HTML, className is used in Dash.
 app = dash.Dash()
colors = {
    'background': '#111111',
    'text': '#7FDBFF'
}
app.layout = html.Div(style={'backgroundColor': colors['background']}, children=[
    html.H1(
        children='Hello Dash',
        style={
            'textAlign': 'center',
            'color': colors['text']
        }
    ),
    html.Div(children='Dash: A web application framework for Python.', style={
        'textAlign': 'center',
        'color': colors['text']
    }),
    dcc.Graph(
        id='Graph1',
        figure={
            'data': [
                {'x': [1, 2, 3], 'y': [4, 1, 2], 'type': 'bar', 'name': 'SF'},
                {'x': [1, 2, 3], 'y': [2, 4, 5], 'type': 'bar', 'name': u'Montréal'},
            ],
            'layout': {
                'plot_bgcolor': colors['background'],
                'paper_bgcolor': colors['background'],
                'font': {
                    'color': colors['text']
                }
            }
        }
    )
])
In order to view our visualization, we need to run our web server just like in Flask. Remember Dash is built on top of Flask. We also set debug to true to ensure we don't have to keep refreshing the server every time we make some changes
 if __name__ == '__main__':
    app.run_server(debug=True)
Next, move to the terminal and start the server by typing the code below: python app.py
This will start a new web server at http://127.0.0.1:8050/. Head over there and see your newly created dashboard.
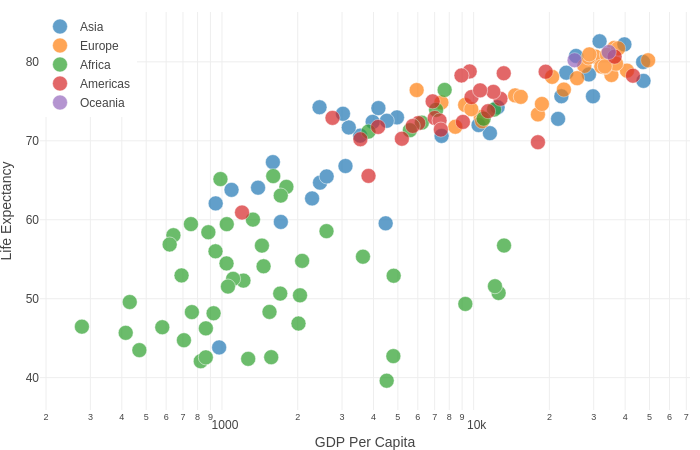
In order to plot a scatter plot, we import the normal dash components as previously done. We also need to import Plotly graph_objs in order to plot the scatter plot. As mentioned previously we use the Div class and Graph components from Dash in order to accomplish this. The Graph component takes a figure object which has the data and the layout description. We plot the scatter plot using graph_objs scatter property. In order to make sure the plot is a scatter plot we pass a mode attribute and set it as markers. Otherwise, we would have lines on the graph.
 import dash
import dash_core_components as dcc
import dash_html_components as html
import pandas as pd
import plotly.graph_objs as go

app = dash.Dash()

df = pd.read_csv(
    'https://gist.githubusercontent.com/chriddyp/' +
    '5d1ea79569ed194d432e56108a04d188/raw/' +
    'a9f9e8076b837d541398e999dcbac2b2826a81f8/'+
    'gdp-life-exp-2007.csv')


app.layout = html.Div([
    dcc.Graph(
        id='life-exp-vs-gdp',
        figure={
            'data': [
                go.Scatter(
                    x=df[df['continent'] == i]['gdp per capita'],
                    y=df[df['continent'] == i]['life expectancy'],
                    text=df[df['continent'] == i]['country'],
                    mode='markers',
                    opacity=0.8,
                    marker={
                        'size': 15,
                        'line': {'width': 0.5, 'color': 'white'}
                    },
                    name=i
                ) for i in df.continent.unique()
            ],
            'layout': go.Layout(
                xaxis={'type': 'log', 'title': 'GDP Per Capita'},
                yaxis={'title': 'Life Expectancy'},
                margin={'l': 40, 'b': 40, 't': 10, 'r': 10},
                legend={'x': 0, 'y': 1},
                hovermode='closest'
            )
        }
    )
])

if __name__ == '__main__':
    app.run_server()
Sometimes you may need to include a lot of text in your dashboards. You can do this using dash_core_components Mardown attribute as shown below.
 import dash
import dash_core_components as dcc
import dash_html_components as html

app = dash.Dash()

markdown_text = '''
### Dash and Markdown
A lot of text
'''

app.layout = html.Div([
    dcc.Markdown(children=markdown_text)
])

if __name__ == '__main__':
app.run_server()Next, let's look at some dash_core_components that you will encounter when using Dash. You can generate a drop down as shown below. You do by calling Dropdown off dash_core_components and passing the options as a list of dictionaries. You can set the default value using the values attribute and passing in the default option.
  dcc.Dropdown(
        options=[
            {'label': 'New York City', 'value': 'NYC'},
            {'label': u'Montréal', 'value': 'MTL'},
            {'label': 'San Francisco', 'value': 'SF'}
        ],
        value='MTL'
    )
Generating a multi-select drop down is similar to above. The only changes are that you set the multi attribute to true since it is False by default. You can then specify the items you would like to be multi-selected by default by specifying the values attribute.
    html.Label('Multi-Select Dropdown'),
    dcc.Dropdown(
        options=[
            {'label': 'New York City', 'value': 'NYC'},
            {'label': u'Montréal', 'value': 'MTL'},
            {'label': 'San Francisco', 'value': 'SF'}
        ],
        value=['MTL', 'SF'],
        multi=True
    )
Radio buttons can be generated using the RadioItems attribute. You then pass the options as a list of dictionaries. You can also set a default value by specifying the values attribute.
 html.Label('Radio Items'),
    dcc.RadioItems(
        options=[
            {'label': 'New York City', 'value': 'NYC'},
            {'label': u'Montréal', 'value': 'MTL'},
            {'label': 'San Francisco', 'value': 'SF'}
        ],
        value='MTL'
    )
To generate checkboxes, you call the Checklist attribute off dash_core_components. The options and default values are passed as above
  html.Label('Checkboxes'),
    dcc.Checklist(
        options=[
            {'label': 'New York City', 'value': 'NYC'},
            {'label': u'Montréal', 'value': 'MTL'},
            {'label': 'San Francisco', 'value': 'SF'}
        ],
        values=['MTL', 'SF']
    )
You will most certainly need input texts in your application. To generate them you will use the Input attribute. Using the Html Label tag, you can create a label for the Input filed. Using the values attribute you can specify some text in the field and to specify the type of use type and indicate whether its a text field, number, etc.
 html.Label('Text Box'),
    dcc.Input(value='MTL', type='text')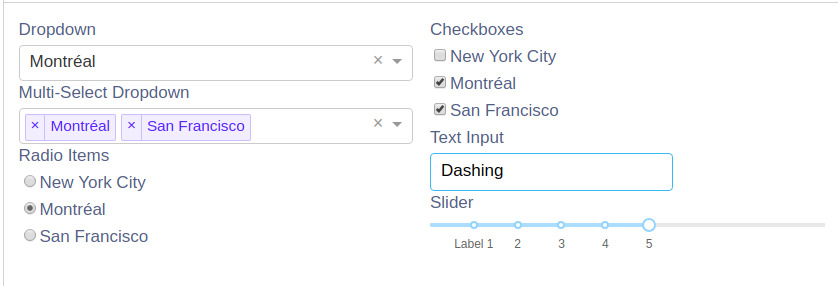
Since Dash components are declarative, calling the help command on any of them will generate the help for that component.
help(dcc.Input)
Now let's cover how we can make our Dash apps interactive. In order to do this, we need to import Input and Output from dash.dependencies. Don't confuse these with the HTML Input because they are different. The HTML Input is imported from the dash core components. Below we create an input text and bind it a callback such that whenever you type something into that box, it updates my-div in real time. In order to enable this Dash provides a decorator @app which makes it possible to bind a callback function to my-div and the HTML input field. Notice that we use the decorator before we declare the update_output_div function.
 import dash
import dash_core_components as dcc
import dash_html_components as html
from dash.dependencies import Input, Output

app = dash.Dash()

app.layout = html.Div([
    dcc.Input(id='my-id', value='Dash App', type='text'),
    html.Div(id='my-div')
])


@app.callback(
    Output(component_id='my-div', component_property='children'),
    [Input(component_id='my-id', component_property='value')]
)
def update_output_div(input_value):
    return 'You\'ve entered "{}"'.format(input_value)


if __name__ == '__main__':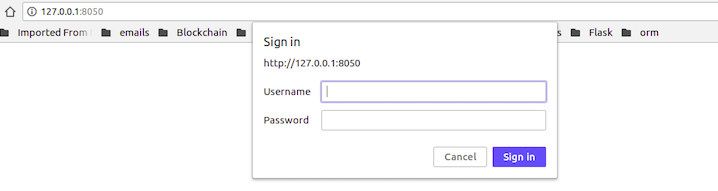
app.run_server()Dash provides authentication through a separate package called dash-auth. It provides two modes of authentication HTTP Basic Auth and Plotly OAuth. In Basic Auth, you hardcode a set of usernames and passwords in your application. This method has some challenges such as users cannot log out of your application, users cannot create accounts or change passwords, and you are responsible for safely storing the usernames and passwords in your code. Plotly OAuth provides authentication through your online Plotly account, and it's not free.
To set up the Basic Auth proceed as follows. First, install the necessary packages.
 pip install dash==0.21.1
pip install dash-auth==1.0.0
After this set the username and password pairs you would like to have in your application.
 VALID_USERNAME_PASSWORD_PAIRS = [
    ['hello', 'world']
]
The dash_auth.BasicAuth utility from Dash will take care of authentication for you once the password pairs have been set. All you have to do is pass the password pairs and your application name to dash_auth.BasicAuth.
 app = dash.Dash('auth')
auth = dash_auth.BasicAuth(
    app,
    VALID_USERNAME_PASSWORD_PAIRS
)
Hosting your dashboard on Heroku is fairly easy but will take a couple of steps.
First, create a directory that will hold all your projects files. You can do this on Ubuntu using the mkdir command.
$ mkdir my_dash_app
$ cd my_dash_app
Next, initialize the folder with git and virtualenv. Git is for version control, and virtualenv will enable us to create a virtual environment to hold all our Python dependencies. After creating the environment, we activate it using the source command.
$ git init
$ virtualenv venv
$ source venv/bin/activate
Next, we install all the packages we need for our Dash application:
$ pip install dash
$ pip install dash-renderer
$ pip install dash-core-components
$ pip install dash-html-components
$ pip install plotly
In order to serve our Dash application, we need a Python web server. We never use Flask's development server in production. We use Gunicorn web server for this function. Install it as shown below:
$ pip install gunicornNext, we need to create a few files in our folder:
Add the following to app.py. This is just an example so you can use your own Dash dashboard.
import os
import dash
import dash_core_components as dcc
import dash_html_components as html
app = dash.Dash(__name__)
server = app.server
app.layout = html.Div([
    html.H2('Hello World'),
    dcc.Dropdown(
        id='dropdown',
        options=[{'label': i, 'value': i} for i in ['LA', 'NYC', 'MTL']],
        value='LA'
    ),
    html.Div(id='display-value')
])
@app.callback(dash.dependencies.Output('display-value', 'children'),
              [dash.dependencies.Input('dropdown', 'value')])
def display_value(value):
    return 'You have selected "{}"'.format(value)
if __name__ == '__main__':
    app.run_server(debug=True)
It is important to remind ourselves that at its core a Dash application is also a Flask application. For purposes of deployment, we need to access the Flask application instance. Dash enables us to do this using
app.serverapp = dash.Dash(__name__)
server = app.serverAdd the files you would not like to be pushed to production in the .gitignore file. A good Python .gitignore file is available at Github
Now let's specify our deployment information in the Procfile. We use the web variable to specify our server as gunicorn. We also specify our app details utilizing the app variable. app refers to the filename app.py and server refers to the server variable inside that file.
web: gunicorn app:serverWe also need to write our Python dependencies to the requirements file. Heroku will install them during deployment.
pip freeze > requirements.txtThe next steps assume that you have an Heroku account and have installed the Heroku CLI. In case you do not have those in place head over to https://www.heroku.com and set them up.
The next step is to create a Heroku app on the terminal and add all our application packages. Once you have committed the changes; push your application to heroku master. The output of this command will have a link to your live Dash application on Heroku.
$ heroku create your-app-name
$ git add .
$ git commit -m 'Your-commit-message'
$ git push heroku master
This serves as an introduction to building a dashboard in pure Python using Dash by Plotly. To learn more about Dash visit the official docs.
If you are interested in learning more about python, check out our Python Tutorial for Beginners and Intermediate Python for Data Science course.
Learn more about Python and Plotly
Course
Course
Course
cheat-sheet
Karlijn Willems
Tutorial
Matthew Przybyla
Tutorial
Eugenia Anello
Tutorial
DataCamp Team
code-along
Filip Schouwenaars
code-along
Justin Saddlemyer