Course
Pivot Tables in Google Sheets
2 hr
71.8K
If you would like to learn more about spreadsheets, take DataCamp's Introduction to Statistics in Spreadsheets course.
The real-life business systems are very dynamic in nature. It is not easy for market researchers to design such a probabilistic model that can capture everything. It means the researcher needs more sophisticate models to understand customer behavior as a business process evolves. A probability model for the business process which grows over the period of time is called the stochastic process. The stochastic process describes consumer behavior over a period of time. Markov chain is one of the techniques to perform a stochastic process that is based on the present state to predict the future state of the customer.
Markov analysis technique is named after Russian mathematician Andrei Andreyevich Markov, who introduced the study of stochastic processes, which are processes that involve the operation of chance (Source). This analysis helps to generate a new sequence of random but related events, which will look similar to the original. It is useful in analyzing dependent random events i.e., events that only depend on what happened last. Markov Analysis is a probabilistic technique that helps in the process of decision-making by providing a probabilistic description of various outcomes.
Markov model is a stochastic based model that used to model randomly changing systems. It assumes that future events will depend only on the present event, not on the past event. It results in probabilities of the future event for decision making.
Assumption of Markov Model:
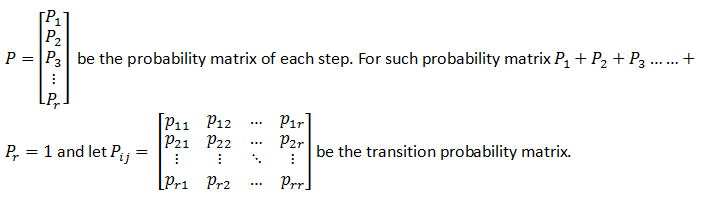
You have a set of states S= {S_1, S_2, S_3…….S_r }. The process starts at one of these processes and moves successively from one state to another. If the system is currently at Si, then it moves to state Sj at the next step with a probability by Pij, and this probability does not depend on which state the system was before the current state.
Source: https://www.dartmouth.edu/~chance/teaching_aids/books_articles/probability_book/Chapter11.pdf
Stochastic Processes: It deals with the collection of a random variable indexed by some set so that you can study the dynamics of the system.
Independent Events: One of the best ways to understand this with the example of flipping a coin since every time you flip a coin, it has no memory of what happened last. The sequence of head and tail are not interrelated; hence, they are independent events.
Dependents Events: Two events said to be dependent if the outcome first event affects the outcome of another event.
Random Variables: A variable whose value depends on the outcome of a random experiment/phenomenon.
Steady-State Probabilities: As you continue the Markov process, you find that the probability of the system being in a particular state after a large number of periods is independent of the beginning state of the system. The probabilities that you find after several transitions are known as steady-state probabilities.
Source: An Introduction to Management Science Quantitative Approaches to Decision Making By David R. Anderson, Dennis J. Sweeney, Thomas A. Williams, Jeffrey D. Camm, R. Kipp Martin
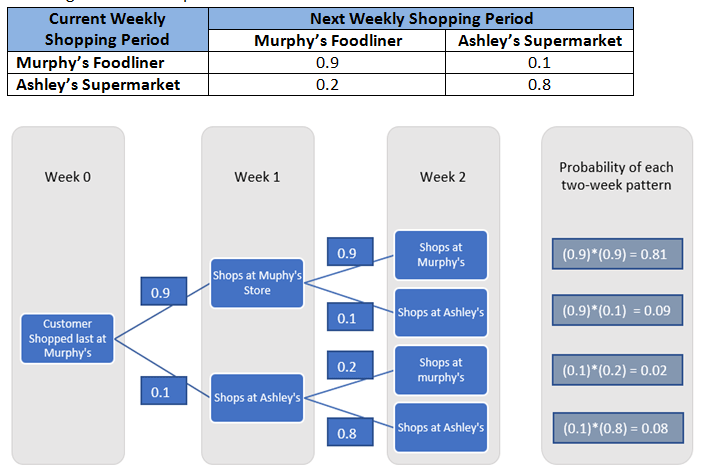
Let's analyze the market share and customer loyalty for Murphy's Foodliner and Ashley's Supermarket grocery store. Our primary focus is to check the sequence of shopping trips of a customer. You can assume that customers can make one shopping trip per week to either Murphy's Foodline or Ashley's Supermarket, but not both.
Using the terminologies of Markov processes, you refer to the weekly periods or shopping trips as the trials of the process. In each trial, the customer can shop at either Murphy’s Foodliner or Ashley’s Supermarket. The particular store chosen in a given week is known as the state of the system in that week because the customer has two options or states for shopping in each trial. With a finite number of states, you can identify the states as follows:
State 1: The customer shops at Murphy’s Foodliner.
State 2: The customer shops at Ashley’s Supermarket. The given transition probabilities are:
Similarly,
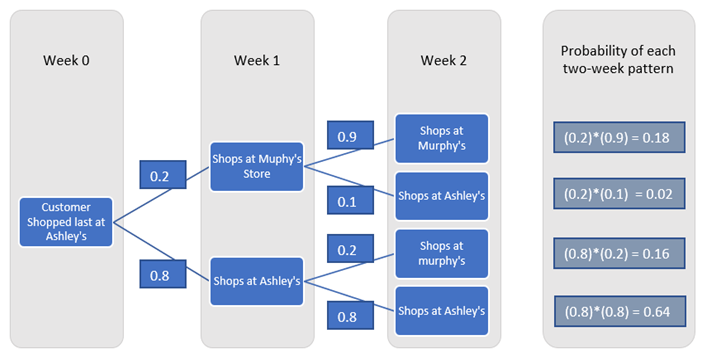
Hence, probability murphy’s after two weeks can be calculated by multiplying the current state probabilities matrix with the transition probabilities matrix to get the probabilities for the next state.
Generalize formula:
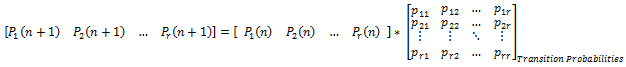
Where P1, P2, …, Pr represents systems in the process state’s probabilities, and n shows the state.
Source: An Introduction to Management Science Quantitative Approaches to Decision Making By David R. Anderson, Dennis J. Sweeney, Thomas A. Williams, Jeffrey D. Camm, R. Kipp Martin
Let’s solve the same problem using Microsoft excel –
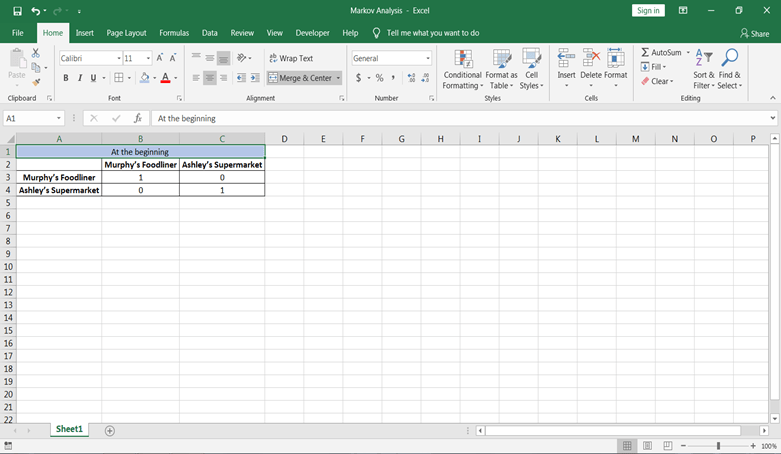
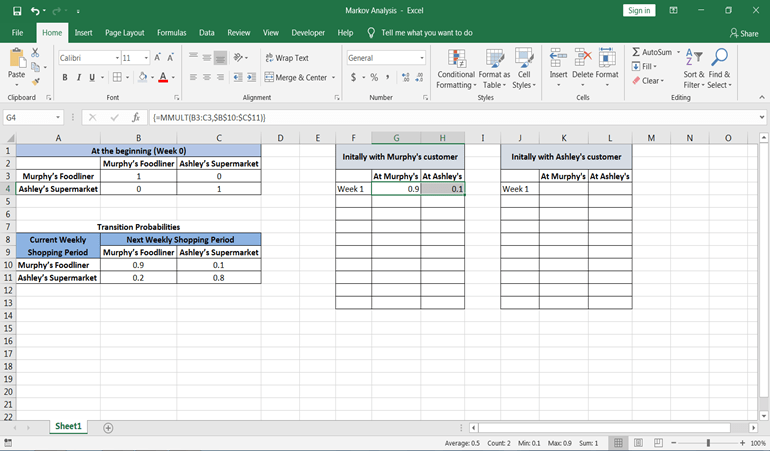
Step 1: Let’s say at the beginning some customers did shopping from Murphy’s and some from Ashley’s. This can be represented by the identity matrix because the customers who were at Murphy’s can be at Ashley’s at the same time and vice-versa.
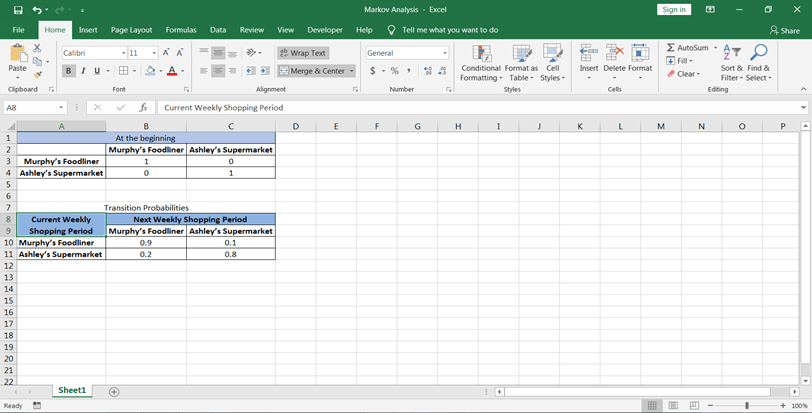
Step 2: Let’s also create a table for the transition probabilities matrix.
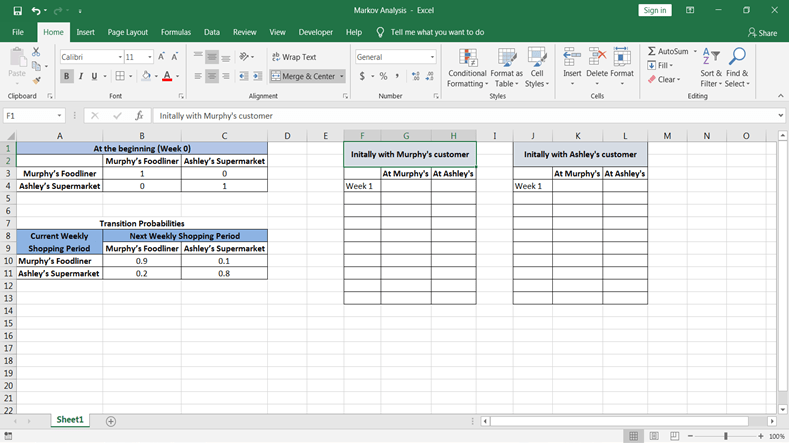
Step 3: Now, you want the probabilities at both the store at first period: First, let’s design a table where you want values to be calculated:
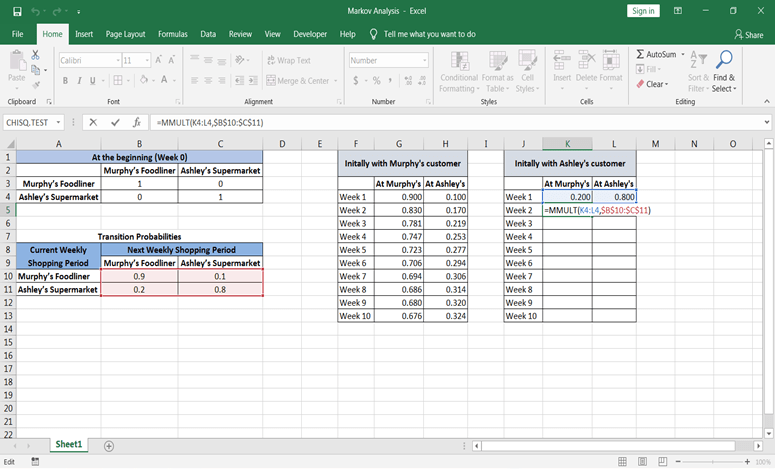
Step 4: Now, let’s calculate state probabilities for future periods beginning initially with a murphy’s customer. Probabilities can be calculated using excel function =MMULT(array1, array2). To use this first select both the cells in Murphy’s customer table following week 1.
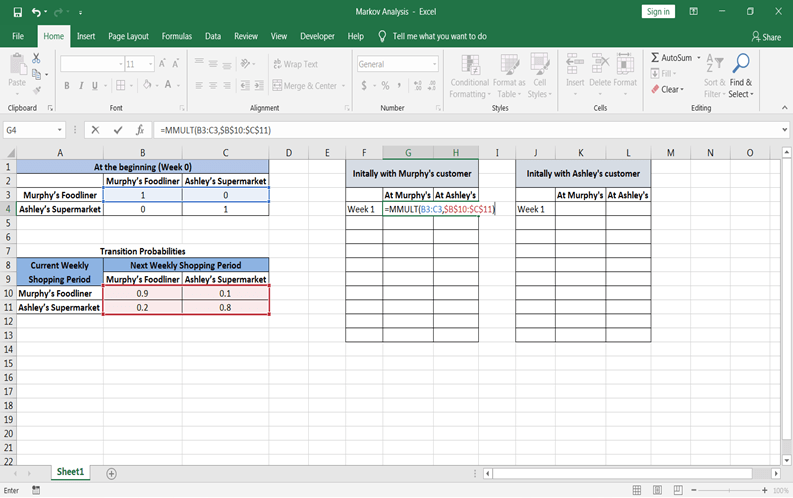
After applying this formula, close the formula bracket and press Control+Shift+Enter all together. Then you will see values of probability.
Step 5: As you have calculated probabilities at state 1 and week 1 now similarly, let’s calculate for state 2. The only thing that will change that is current state probabilities. Week one’s probabilities will be considered to calculate future state probabilities.
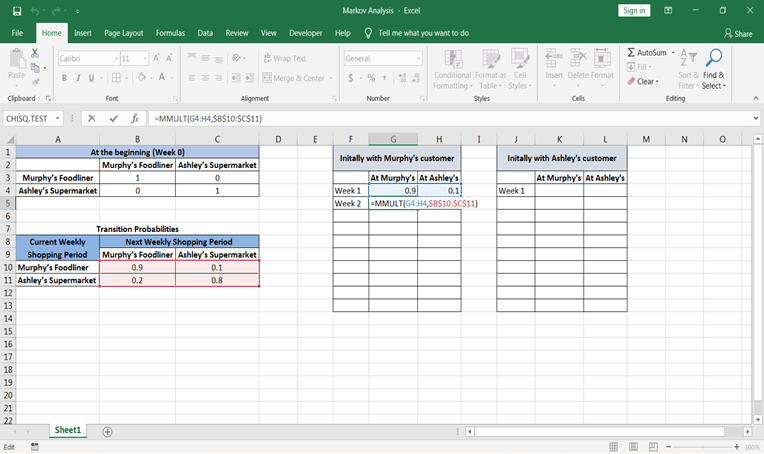
Now you can simply copy the formula from week cells at murphy’s and Ashley's and paste in cells till the period you want.
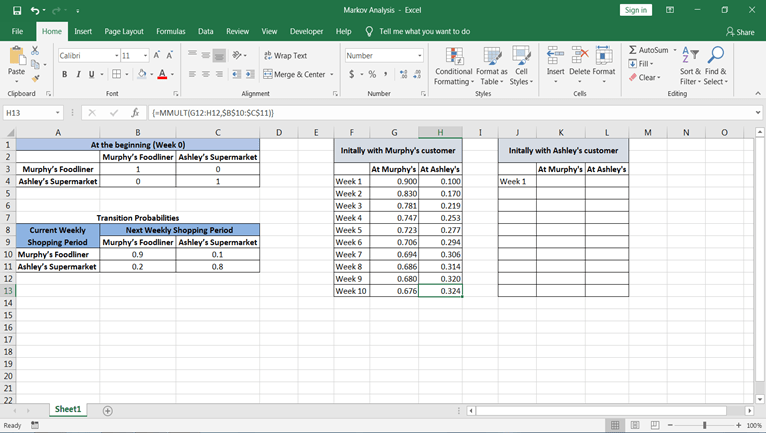
If you had started with 1000 Murphy customers—that is, 1000 customers who last shopped at Murphy’s—our analysis indicates that during the fifth weekly shopping period, 723 would-be customers of Murphy’s, and 277 would-be customers of Ashley’s. Moreover, during the 10th weekly shopping period, 676 would-be customers of Murphy’s, and 324 would-be customers of Ashley’s.
Source: An Introduction to Management Science Quantitative Approaches to Decision Making By David R. Anderson, Dennis J. Sweeney, Thomas A. Williams, Jeffrey D. Camm, R. Kipp Martin
Step 6: Similarly, now let’s calculate state probabilities for future periods beginning initially with a murphy’s customer.
For week 1:
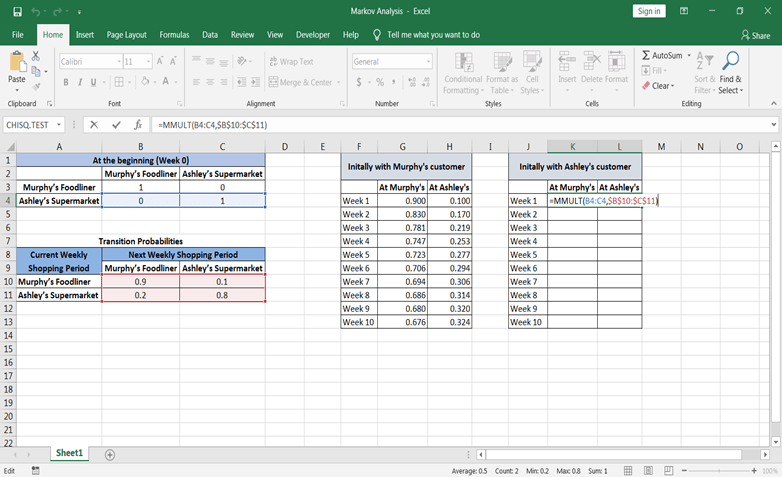
For week 2:
Just drag the formula from week 2 to till the period you want.
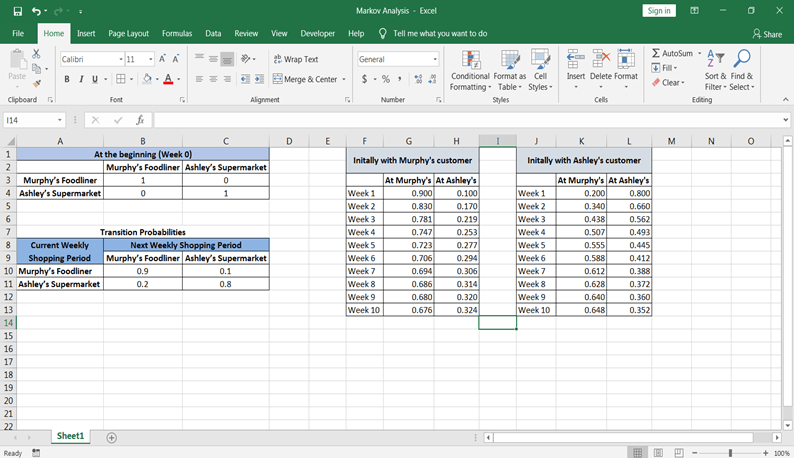
In the fifth shopping period, the probability that the customer will be shopping at Murphy’s is 0.555, and the probability that the customer will be shopping at Ashley’s is 0.445. In the tenth period, the probability that a customer will be shopping at Murphy’s is 0.648, and the probability that a customer will be shopping at Ashley’s is 0.352.
Source: An Introduction to Management Science Quantitative Approaches to Decision Making By David R. Anderson, Dennis J. Sweeney, Thomas A. Williams, Jeffrey D. Camm, R. Kipp Martin
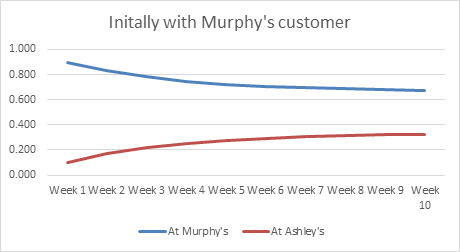
You can also look graphically how the share is going down at murphy’s and increasing at Ashley’s of customer who last shopped at Murphy’s.

Pros:
Cons:
Congratulations, you have made it to the end of this tutorial!
In this tutorial, you have covered a lot of details about Markov Analysis. You have learned what Markov Analysis is, terminologies used in Markov Analysis, examples of Markov Analysis, and solving Markov Analysis examples in Spreadsheets. Also, discussed its pros and cons.
Hopefully, you can now utilize the Markov Analysis concepts in marketing analytics. Thanks for reading this tutorial!
If you would like to learn more about spreadsheets, take the following courses from DataCamp:
Learn more about Spreadsheets
Course
Course
Tutorial
Avinash Navlani
Tutorial
Ryan Sheehy
Tutorial
Parul Pandey
Tutorial
Aditya Sharma
Tutorial
Avinash Navlani
Tutorial
Francisco Javier Carrera Arias