Course
Pandas Joins for Spreadsheet Users
4 hr
4.5K
Before reading a CSV file into a pandas dataframe, you should have some insight into what the data contains. Thus, it’s recommended you skim the file before attempting to load it into memory: this will give you more insight into what columns are required and which ones can be discarded.
Now, let’s write some code to import a file using read_csv(). Then, we can talk about what’s going on and how we can customize the output we receive while reading the data into memory.
# Tip: For faster performance on large files in pandas 2.0+, use the pyarrow engine
# airbnb_data = pd.read_csv("data/listings_austin.csv", engine="pyarrow")
import pandas as pd

# Read the CSV file
airbnb_data = pd.read_csv("data/listings_austin.csv")

# View the first 5 rows
airbnb_data.head()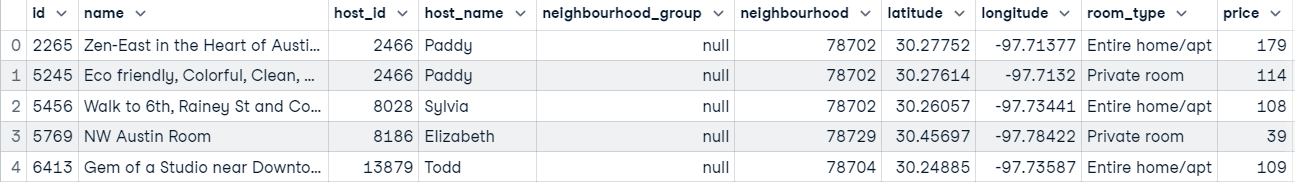
All that has gone on in the code above is we have:
read_csv() to read the data into memory as a pandas dataframe.But there’s a lot more to the read_csv() function.
The default behavior of pandas is to add an initial index to the dataframe returned from the CSV file it has loaded into memory. However, you can explicitly specify what column to make as the index to the read_csv() function by setting the index_col parameter.
Note the value you assign to index_col may be given as either a string name, column index, or a sequence of string names or column indexes. Assigning the parameter a sequence will result in a multiIndex (a grouping of data by multiple levels).
Let’s read the data again and set the id column as the index.
# Setting the id column as the index
airbnb_data = pd.read_csv("data/listings_austin.csv", index_col="id")
# airbnb_data = pd.read_csv("data/listings_austin.csv", index_col=0)

# Preview first 5 rows
airbnb_data.head()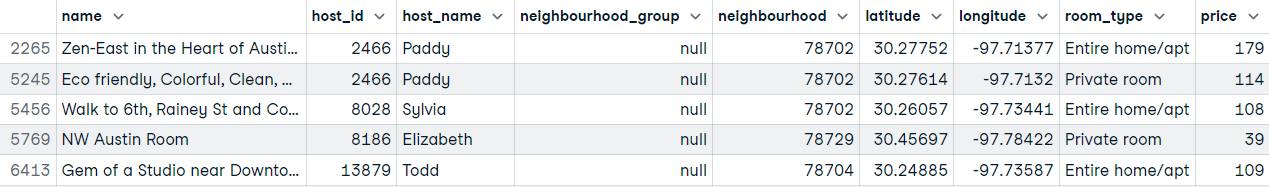
What if you only want to read specific columns into memory because not all of them are important? This is a common scenario that occurs in the real world. Using the read_csv() function, you can select only the columns you need after loading the file, but this means you must know what columns you need prior to loading the data if you wish to perform this operation from within the read_csv() function.
If you do know the columns you need, you’re in luck; you can save time and memory by passing a list-like object to the usecols parameter of the read_csv() function.
# Defining the columns to read
usecols = ["id", "name", "host_id", "neighbourhood", "room_type", "price", "minimum_nights"]

# Read data with subset of columns
airbnb_data = pd.read_csv("data/listings_austin.csv", index_col="id", usecols=usecols)

# Preview first 5 rows
airbnb_data.head()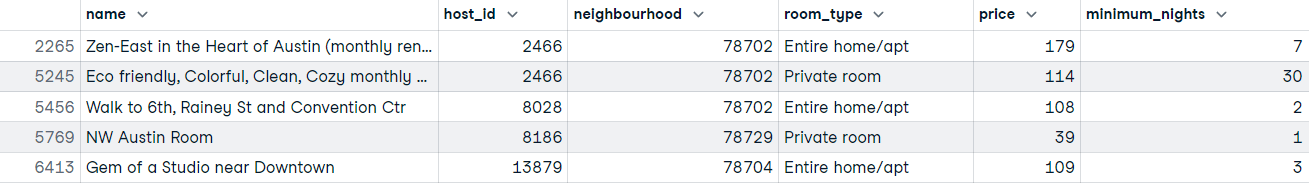
We have barely scratched the surface of different ways to customize the output of the read_csv() function, but going into more depth would certainly be an information overload. For that, you can use the following table as reference:
| Parameter | Description | Example usage | |
|---|---|---|---|
| filepath_or_buffer | The path or URL of the CSV file to read. | pd.read_csv("data/listings_austin.csv") | |
| sep | Delimiter to use. Default is , . | pd.read_csv("data.csv", sep=';') | |
| index_col | Column(s) to set as the index. Can be a column label or an integer. | pd.read_csv("data.csv", index_col="id") | |
| usecols | Return a subset of the columns. Takes a list-like of column names or indices. | pd.read_csv("data.csv", usecols=["id", "name", "price"]) | |
| names | List of column names to use. If the file does not contain a header row. | pd.read_csv("data.csv", names=["A", "B", "C"]) | |
| header | Row number(s) to use as the column names. Default is 0 (first line). | pd.read_csv("data.csv", header=1) | |
| dtype | Data type for data or columns. | pd.read_csv("data.csv", dtype={"id": int, "price": float}) | |
| na_values | Additional strings to recognize as NA/NaN. | pd.read_csv("data.csv", na_values=["NA", "N/A"]) | |
| parse_dates | Attempt to parse dates. Can be boolean or list of column names. | pd.read_csv("data.csv", parse_dates=["date"]) | |
| engine | Parser engine: 'c' (default), 'python', or 'pyarrow' (fastest, requires pyarrow package). | pd.read_csv("data.csv", engine="pyarrow") | |
| skiprows | Line numbers to skip (0-indexed) or number of lines to skip at the start. | pd.read_csv("data.csv", skiprows=3) | |
| nrows | Number of rows to read. Useful for previewing large files. | pd.read_csv("data.csv", nrows=100) |
When working with large datasets, loading the entire file into memory at once may not be feasible, especially in memory-constrained environments. The read_csv() function offers a handy chunksize parameter, allowing you to read the data in smaller, manageable chunks.
By setting the chunksize parameter, read_csv() returns an iterable object where each iteration provides a chunk of data as a pandas dataframe. This approach is particularly useful when processing data in batches or when the dataset size exceeds the available memory.
Here’s how you can use the chunksize parameter:
import pandas as pd
import os  # Import the standard OS library

file_path = "data/large_dataset.csv"
output_file = "data/processed_large_dataset.csv"
chunk_size = 10000

# Process and write chunks
for chunk in pd.read_csv(file_path, chunksize=chunk_size):
    # Example: Filter rows based on a condition
    filtered_chunk = chunk[chunk['column_name'] > 50]

    # Check if header is needed (only if file doesn't exist yet)
    write_header = not os.path.exists(output_file)

    # Append to a new CSV file
    filtered_chunk.to_csv(output_file, mode='a', header=write_header, index=False)
If your goal is to perform an operation across the entire dataset, such as calculating the total sum of a column, you can aggregate results as you iterate through the chunks:
total_sum = 0

for chunk in pd.read_csv(file_path, chunksize=chunk_size):
    # Add the sum of the specific column for each chunk
    total_sum += chunk['column_name'].sum()

print(f"Total sum of the column: {total_sum}")
You can also use chunksize to process and save chunks of data to a new file incrementally:
# Output file path
output_file = "data/processed_large_dataset.csv"

# Process and write chunks
for chunk in pd.read_csv(file_path, chunksize=chunk_size):
    # Example: Filter rows based on a condition
    filtered_chunk = chunk[chunk['column_name'] > 50]
    # Append to a new CSV file
    filtered_chunk.to_csv(output_file, mode='a', header=not os.path.exists(output_file), index=False)
We will see more of the to_csv() method in upcoming sections.
The chunksize parameter is indispensable when:
Once you know how to read a CSV file from local storage into memory, reading data from other sources is a breeze. It’s ultimately the same process, except that you’re no longer passing a file path.
Let’s say there’s data you want from a specific webpage; how would you read it into memory?
I'll use the Iris dataset from the UCI repository as an example:
# Webpage URL
url = "https://archive.ics.uci.edu/ml/machine-learning-databases/iris/iris.data"

# Define the column names
col_names = ["sepal_length_in_cm",
            "sepal_width_in_cm",
            "petal_length_in_cm",
            "petal_width_in_cm",
            "class"]

# Read data from URL
iris_data = pd.read_csv(url, names=col_names)

iris_data.head() 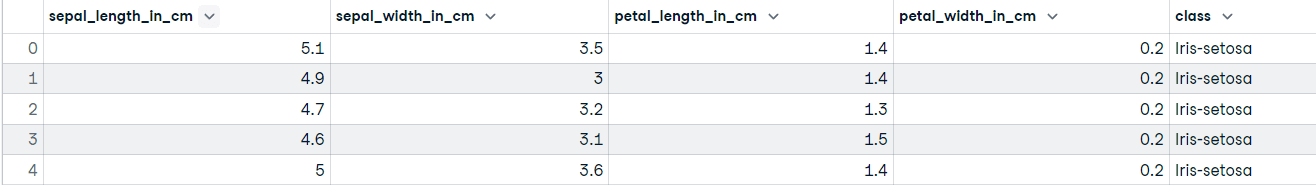
Voila!
We assigned a list of strings to the names parameter. Since the raw Iris data doesn't have a header row, this argument tells pandas to use our list as the column names. (Note: If the file did have a header row, you would also need to use header=0 to tell pandas to replace it).
The most common object in the pandas library is, by far, the dataframe object. It’s a 2-dimensional labeled data structure consisting of rows and columns that may be of different data types (i.e., float, numeric, categorical, etc.).
Conceptually, you can think of a pandas dataframe like a spreadsheet, SQL table, or a dictionary of series objects – whichever you’re more familiar with. The cool thing about the pandas dataframe is that it comes with many methods that make it easy for you to become acquainted with your data as quickly as possible.
You have already seen one of those methods: iris_data.head(), which shows the first n (the default is 5) rows. The “opposite” method of head() is tail(), which shows the last n (5 by default) rows of the dataframe object. For example:
iris_data.tail()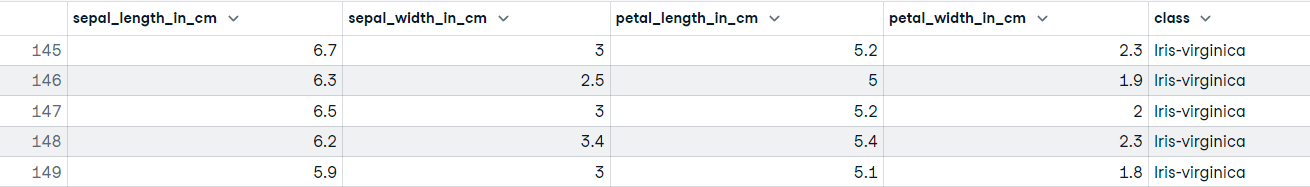
You can quickly discover the column names by using the columns attribute on your dataframe object:
# Discover the column names
iris_data.columns

"""
Index(['sepal_length_in_cm', 'sepal_width_in_cm', 'petal_length_in_cm',
      'petal_width_in_cm', 'class'],
      dtype='object')
"""
Another important method you can use on your dataframe object is info(). This method prints out a concise summary of the dataframe, including information about the index, data types, columns, non-null values, and memory usage.
# Get summary information of the dataframe
iris_data.info()

"""
<class 'pandas.core.frame.DataFrame'>
RangeIndex: 150 entries, 0 to 149
Data columns (total 5 columns):
#   Column              Non-Null Count  Dtype
---  ------              --------------  -----
0   sepal_length_in_cm  150 non-null    float64
1   sepal_width_in_cm   150 non-null    float64
2   petal_length_in_cm  150 non-null    float64
3   petal_width_in_cm   150 non-null    float64
4   class               150 non-null    object
dtypes: float64(4), object(1)
memory usage: 6.0+ KB
"""
DataFrame.describe() generates descriptive statistics, including those that summarize the central tendency, dispersion, and shape of the dataset’s distribution. If your data has missing values, don’t worry; they are not included in the descriptive statistics.
Let’s call the describe method on the Iris dataset:
# Get descriptive statistics
iris_data.describe()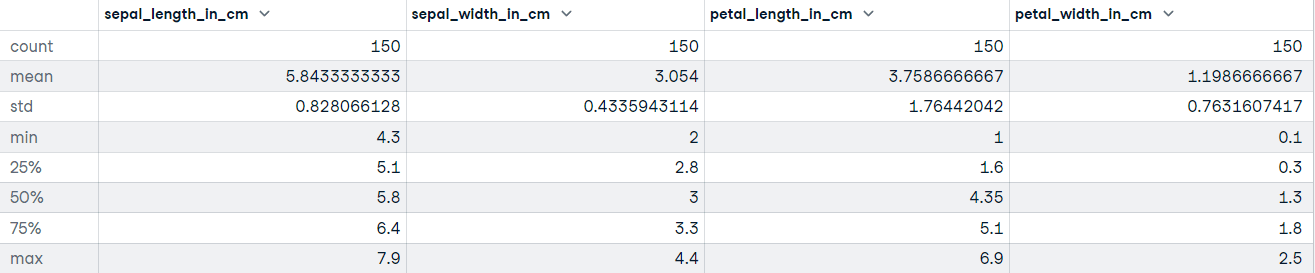
Another method available to pandas dataframe objects is to_csv(). When you have cleaned and preprocessed your data, the next step may be to export the dataframe to a file – this is pretty straightforward:
# Export the file to the current working directory
iris_data.to_csv("cleaned_iris_data.csv")
Executing this code will create a CSV in the current working directory called cleaned_iris_data.csv.
But what if you want to use a different delimiter to mark the beginning and end of a unit of data, or you want to specify how your missing values should be represented? Maybe you don’t want the headers to be exported to the file.
Well, you can adjust the parameters of the to_csv() method to suit your requirements for the data you want to export.
Let’s take a look at a few examples of how you can adjust the output of to_csv():
# Change the delimiter to a tab
iris_data.to_csv("tab_separated_iris_data.csv", sep="\t")# Export data without the index
iris_data.to_csv("tab_separated_iris_data.csv", sep="\t", index=False)
# If you get UnicodeEncodeError use this...
# iris_data.to_csv("tab_separated_iris_data.csv", sep="\t", index=False, encoding='utf-8')““):# Replace missing values with "Unknown"
iris_data.to_csv("tab_separated_iris_data.csv", sep="\t", na_rep="Unknown")# Do not include headers when exporting the data
iris_data.to_csv("tab_separated_iris_data.csv", sep="\t", na_rep="Unknown", header=False)Sometimes, you might encounter encoding errors, especially if you are working on systems that do not use UTF-8 as the default encoding or if your data contains non-ASCII characters. To resolve these issues, you can specify an appropriate encoding using the encoding parameter.
# Export data with a specified encoding
iris_data.to_csv("cleaned_iris_data.csv", encoding="utf-8")
If your system uses a different encoding, such as Windows-1252 (commonly found on Windows systems), you can specify it explicitly:
# Export data using a different encoding
iris_data.to_csv("cleaned_iris_data.csv", encoding="cp1252")
Example with additional parameters:
# Handle missing values and encoding issues
iris_data.to_csv("cleaned_iris_data.csv", na_rep="Unknown", encoding="utf-8", index=False)
The above example ensures that your exported CSV file is compatible with various systems and applications.
| Parameter | Description | Example usage |
|---|---|---|
| path_or_buf | File path or object, if None is provided, the result is returned as a string. | df.to_csv("output.csv") |
| sep | String of length 1. Field delimiter for the output file. Default is ','. | df.to_csv("output.csv", sep=';') |
| na_rep | Missing data representation. | df.to_csv("output.csv", na_rep='Unknown') |
| float_format | Format string for floating-point numbers. | df.to_csv("output.csv", float_format='%.2f') |
| columns | Columns to write. By default, writes all columns. | df.to_csv("output.csv", columns=["id", "name"]) |
| header | Write out the column names. If a list of strings is given, it is assumed to be aliases for the column names. | df.to_csv("output.csv", header=False) |
| index | Write row names (index). Default is True. | df.to_csv("output.csv", index=False) |
| mode | Python write mode. Default is 'w'. | df.to_csv("output.csv", mode='a') |
| encoding | A string representing the encoding to use in the output file. | df.to_csv("output.csv", encoding='utf-8') |
While pandas is a powerful and versatile library for working with CSV files, it's not the only option available in Python. Depending on your use case, other libraries may be better suited for specific tasks:
The csv module is part of Python’s standard library and is a lightweight alternative for handling CSV files. It provides basic functionality for reading and writing CSV files without requiring additional installations. The advantages of csv are:
Example:
import csv

# Reading a CSV file
with open("data/sample.csv", mode="r") as file:
    reader = csv.reader(file)
    for row in reader:
        print(row)

# Writing to a CSV file
with open("data/output.csv", mode="w", newline="") as file:
    writer = csv.writer(file)
    writer.writerow(["Column1", "Column2"])
    writer.writerow(["Value1", "Value2"])
NumPy is a library for numerical computing in Python that also supports CSV handling. It’s particularly useful when working with numerical data or when performance is a concern. The advantages are:
Example:
import numpy as np

# Reading a CSV file into a NumPy array
data = np.loadtxt("data/sample.csv", delimiter=",", skiprows=1)

# Writing a NumPy array to a CSV file
np.savetxt("data/output.csv", data, delimiter=",")
While NumPy is efficient, it doesn’t provide the rich data manipulation and exploratory features available in pandas.
If you are working with very large datasets where pandas feels slow or runs out of memory, Polars is the modern successor you should know about. It is a DataFrame library written in Rust that is designed for lightning-fast performance and parallel processing.
As we explore in our Polars tutorial, the advantages of Polars are:
Example: The syntax is often quite similar to pandas, making it easy to pick up:
import polars as pl

# Read a CSV file (automatically uses multiple threads)
df = pl.read_csv("data/large_dataset.csv")

# View the first 5 rows
print(df.head())

# Write to a CSV file
df.write_csv("data/polars_output.csv")Let’s recap what we covered in this tutorial; you learned how to:
read_csv() function from the pandas library.read_csv() function to return.pandas.read_csv()to_csv() method.In this tutorial, I focused solely on importing and exporting data from the perspective of a CSV file; you now have a good sense of how useful pandas iswhen importing and exporting CSV files. CSV is one of the most common data storage formats, but it’s not the only one.There are various other file formats used in data science, such as parquet, JSON, and Excel.
Plenty of useful, high-quality datasets are hosted on the web, which you can access through APIs, for example. If you want to understand how to handle loading data into Python in more detail, DataCamp's Introduction to Importing Data in Python course will teach you all the best practices.
There are also tutorials on how to import JSON and HTML data into pandas and a beginner-friendly ultimate guide to pandas tutorial. Be sure to check those out to dive deeper into the pandas framework.
Our certification programs help you stand out and prove your skills are job-ready to potential employers.

Learn more about Python and pandas
Course
Course
Course
cheat-sheet
Karlijn Willems
cheat-sheet
Karlijn Willems
Tutorial
Sejal Jaiswal
Tutorial
Karlijn Willems
Tutorial
Aditya Sharma
Tutorial
Vidhi Chugh