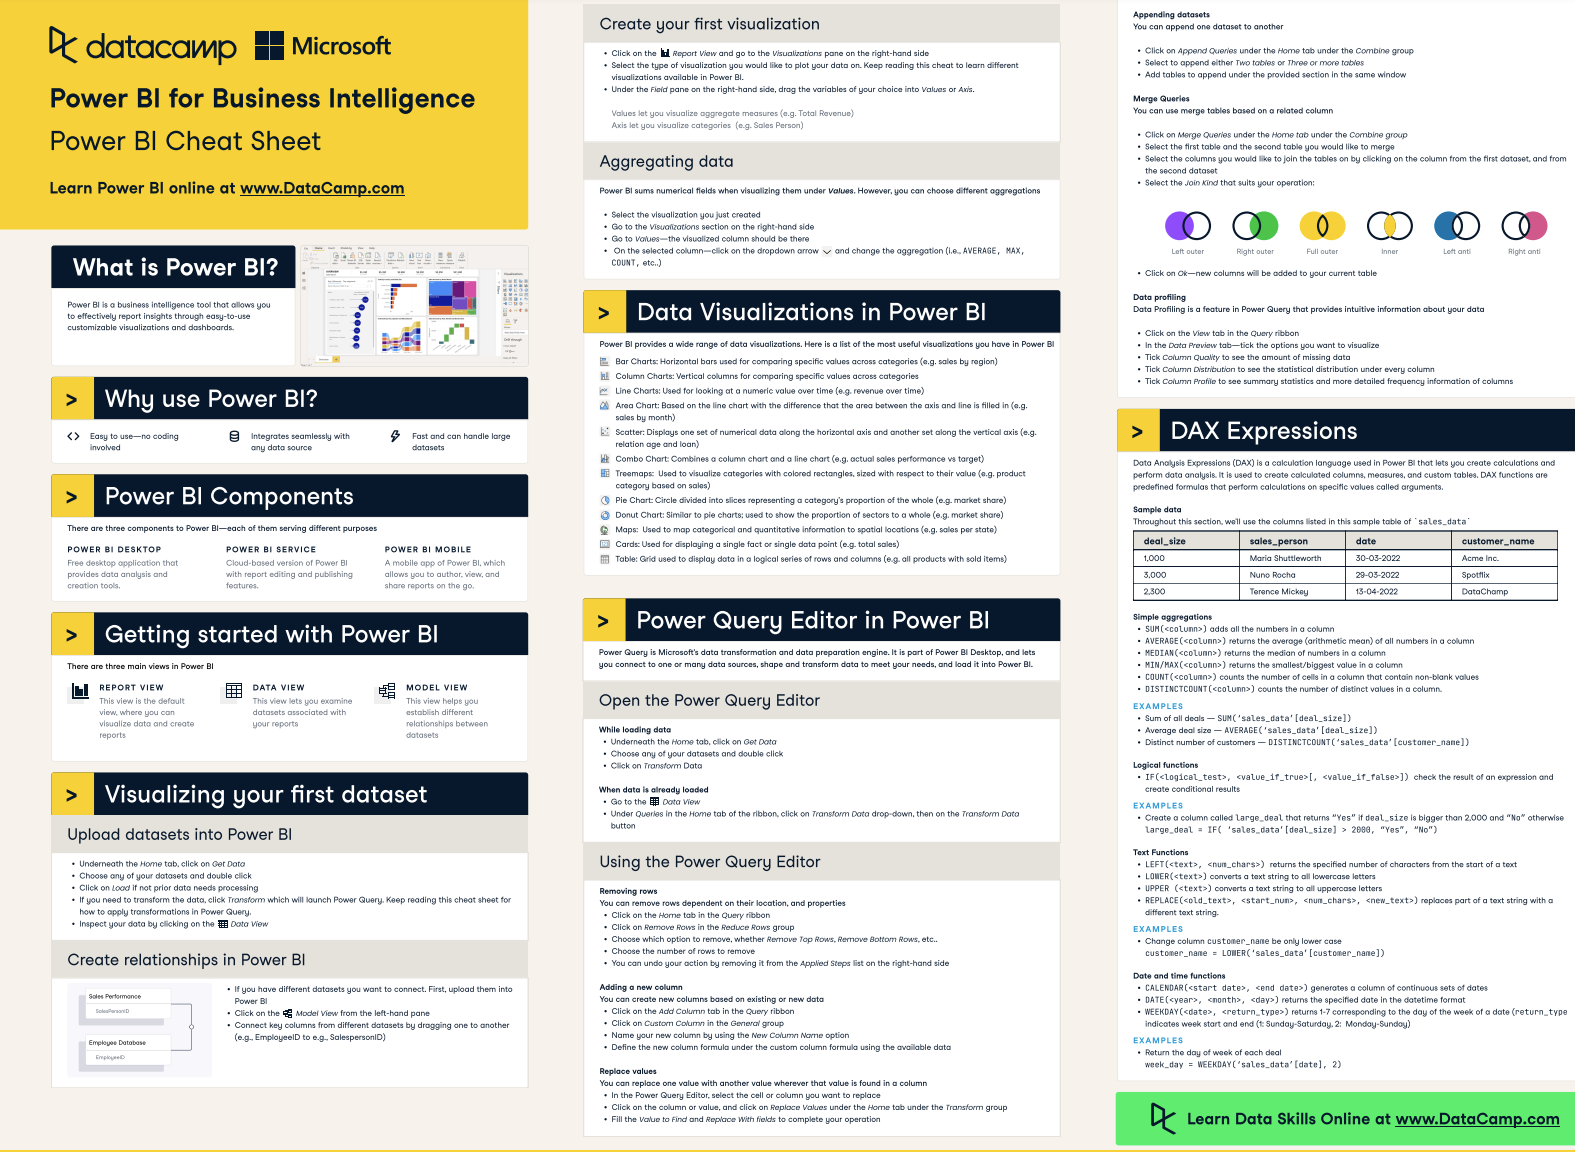


Track
Data Analyst in Power BI
50 hr
At some point, your Power BI reports will outgrow the single Excel file that you may have been using to learn and experiment with Power BI.
Eventually, you'll need to import and possibly merge a few tables from different sources to build a more robust data model.
Power BI offers an easy and powerful tool to do this in the Power Query editor: merge tables.
In this tutorial, we show you how to merge tables in Power BI with a few practical examples and best practices.
If you're completely new to the concept of merging and joining tables, don't worry! This tutorial also introduces you to the types of joins you can encounter in Power BI.
If you’re not ready to dive in just yet, check out Chapter 2 of the data modeling in Power BI course for a great first introduction to joins in Power BI. On the other hand, if you’re interested in exploring the logic behind joins more deeply, check out our course on joining data in SQL.
Merging tables in Power BI means combining two or more tables into a single table.
One of Power BI's unique selling points is its ability to combine data from multiple sources into one unifying platform. Whether your data comes from a warehouse, Excel files, third-party applications, or even a webpage, Power BI can access it and merge it.
The beauty of Power BI is the simplicity of this process. You don't need to learn any complex syntax or take a course in programming just to merge your data. The experience on Power BI is very intuitive and easy to follow.
For example, you might have one table with customer details and another table with their purchase history. By merging these tables, you can create a unified view that shows both customer information and their purchases in one place.
In Power BI, you do this by using the "Merge Queries" feature. It allows you to join tables based on common columns, like customer ID or product ID, so you can see all the related data together.
Keep our Power BI cheat sheet on hand as you go through this tutorial and others for quick reference on some essential Power BI concepts.
DataCamp Power BI Cheat Sheet
Before we go into the details, let's clarify why you would need to merge tables in the first place.
Merging tables is not strictly necessary. After all, we can create relationships between our tables to form a comprehensive data model. Through this data model, we can easily reference the columns in connected tables and add them to our visuals.
However, let’s suppose your data model has an extensive network of connected tables, forming a snowflake schema. This reduces the speed and refresh time of your reports to a crawl. So, what’s the solution in this example?
By merging the far-out tables, you can convert your data model to a star schema, boosting performance and improving the user experience (not to mention reducing your own headaches).
Chapter 4 of our data modeling in Power BI course explores the concepts of star and snowflake schemas in detail. Alternatively, you can get a quick introduction by reading our data modeling in Power BI tutorial.
Creating relationships between tables and merging tables are both valid approaches in Power BI, but they serve different purposes and have different benefits.
Use relationships when you have a well-structured data model with clearly defined relationships between tables, especially with larger datasets. This approach is great for maintaining a clean and organized data model.
Merge tables when you need a simplified dataset for a specific analysis or when dealing with smaller datasets where performance impact is minimal. Merging can also be a good choice when you need to perform extensive data cleaning and transformation.
In practice, you might use both techniques depending on your needs. For example, you might create relationships for your overall data model and merge specific tables for particular analyses or reports.
To kick things off, let's start with a simple example.
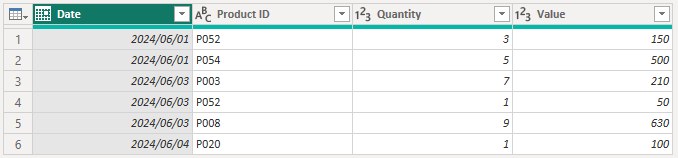
Suppose you have a daily Sales table showing the number of sales per product per day. However, instead of full names, all you have is the Product IDs. This will not look very nice when visualized, and your stakeholders may not know which Product ID corresponds to which product.
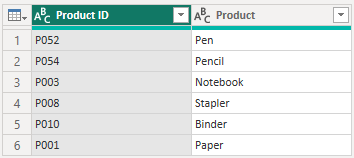
To build a more intuitive, effective report, we need to merge the Products table into the Sales table so that we have access to the product names.
This is our current data model containing two tables (we are ignoring relationships for the purposes of this example):
Sales table
Products table
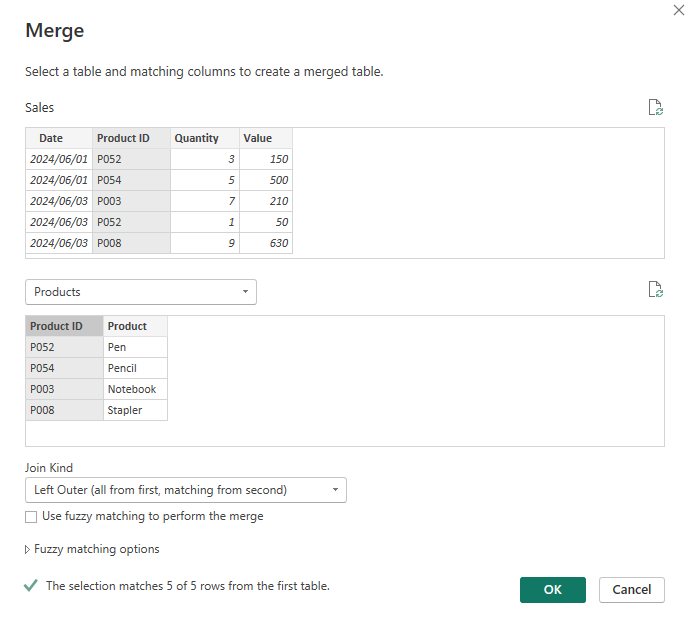
To perform the merge, select "Edit Queries" in the Home tab of the ribbon to open up the Power Query editor. From the Sales table, select "Merge queries" from the Transform section of the ribbon.
Power BI merge queries location in the ribbon
In the first table, select the Product ID column. Add the Products table from the dropdown to include it as the second table in the merge, and select the Product ID column again.
Power BI will confirm the number of matching rows so that we can quickly identify possible issues with our data. Here, we see that all five rows of our data are matched. Click OK to perform the merge.
Power BI merge tables dialog
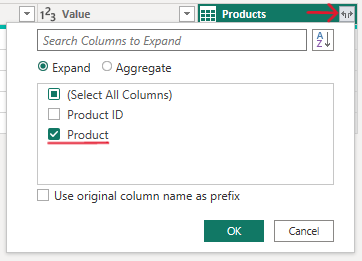
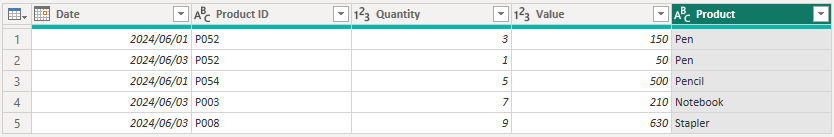
We now need to choose which columns of the Products table we would like to add to the Sales table. In this example, we only want to keep the Product column.
Select columns to expand after merging tables
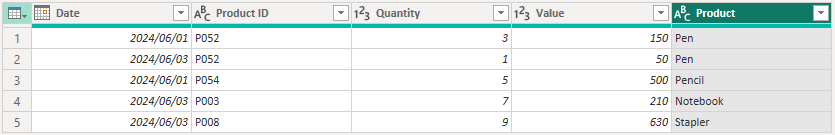
Below is the result of the merge. The Product column is now included in the Sales table.
After merge: Product column is added to the Sales table
When merging tables in Power BI, you can use several types of joins. Each type determines how the rows from the tables are combined based on the matching columns.
The good news is that you don't need a deep understanding of database design or SQL to perform these joins in Power BI. The interface makes it quite intuitive.
Here are the different types of joins you can use:
Microsoft: Types of joins
We refer to the following two tables to illustrate each join below.
Sales table
Products table
This join returns only the rows where there is a match in both tables. If a row in one table doesn’t have a corresponding row in the other table, it won’t be included in the result.
In our example, the Sales table is reduced to 5 rows since Product ID ‘P020’ is not found in the Products table. Additionally, two rows from the Products table are not even included in the Sales table since no sales are recorded for them (that is, Product ID ‘P010’ and ‘P001’).
Inner join example
When merging tables in Power BI, you will likely encounter and use outer joins the most (particularly the left outer join).
Let's explore the three types of outer joins:
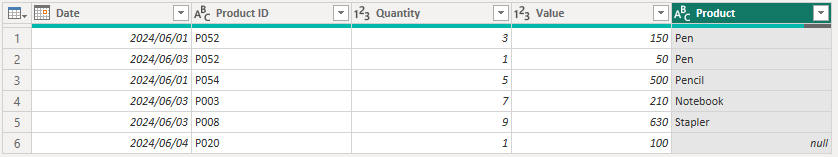
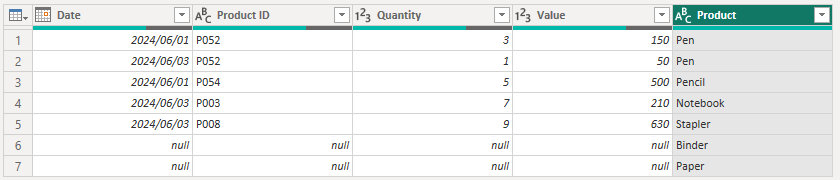
Left outer join: This join returns all the rows from the first (left) table and the matched rows from the second (right) table. If there is no match, the result will still include all rows from the left table with null values for columns from the right table.
In our example, Product ID ‘P020’ has no associated product name because this product is not found in the Products table, so we just get a null value in the Product column.
Left outer join example
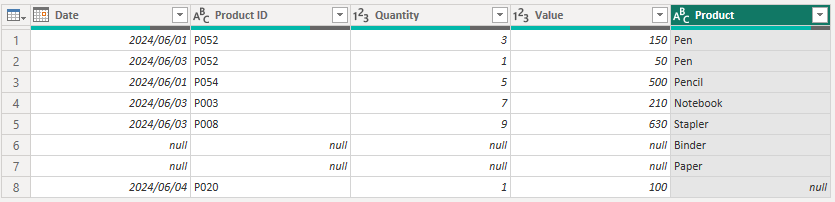
Right outer join: This is the opposite of the left outer join. It returns all the rows from the second (right) table, and the matched rows from the first (left) table. If there is no match, the result will include all rows from the right table with null values for columns from the left table.
In our example, two products (Binder and Paper) can be found in the Products table but do not have any associated sales in the Sales table. Therefore, we have two extra rows in our Sales table that are completely blank for all columns except the Product column.
Right outer join example
Full outer join: This join returns all rows when there is a match in either the left or right table. If there is no match, the result will include rows with null values for the non-matching side.
In our example, we see all rows from both the Sales and Products tables, with matches where they are found and null values everywhere else.
Full outer join example
The anti join is useful for cleaning or investigating any suspected issues. For example, if a left outer join returns a lot of blanks in the joined columns this could indicate that there are data quality issues preventing Power BI from identifying unique matches.
There are two types of anti joins:
Left anti join: Returns only the rows from the left table that do not have a match in the right table.
In our example, only the row for Product ID ‘P020’ is shown because this is the only product in the Products table without an associated product name. This immediately tells us that our Products table needs attention: it’s missing a product!
Left anti join example
Right anti join: Returns only the rows from the right table that do not have a match in the left table.
In our example, only two rows are returned because these are the products for which we have no associated sales.
Right anti join example
While this may not be an urgent issue to address, it is useful to know which products are getting imported into our data model but serve no purpose.
If you have large amounts of data and are looking for a way to speed up the performance and refresh times of your reports, the first thing to look into is whether your tables are bloated with useless data that is not used in your report.
Merging on multiple columns is necessary when you cannot identify unique matches to join on when specifying just a single column.
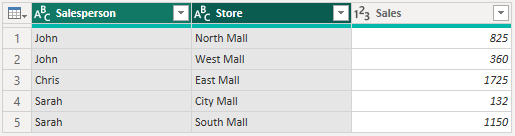
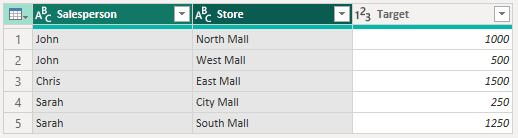
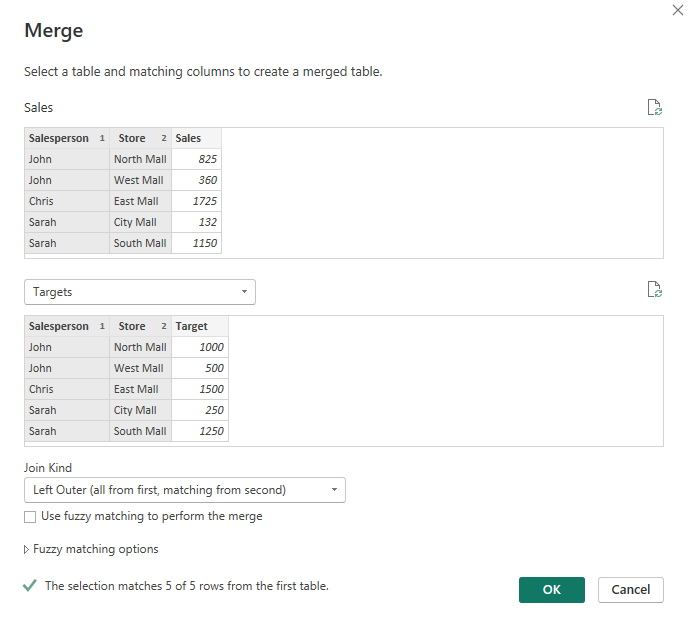
For example, let's suppose you've been asked to create a Power BI report showing the sales per salesperson for the month against their targets. The tricky bit is that each salesperson is responsible for multiple stores and has different targets for each store.
Here are the tables we will be using for this example:
Sales table
Targets table
The Sales table contains data for each Salesperson and their assigned Stores. The Targets table contains the sales Target for each Salesperson and Store.
It is not possible to join these two tables using only the Salesperson because Power BI would not be able to find unique matches (effectively creating a many-to-many join).
Thus, we will need to join these two tables using two columns in each table: Salesperson and Store.
To do this, we must select the Salesperson column and then, while holding the ctrl button, select the Store column for both tables. You must select the columns in each table in the same order. Power BI adds a little 1 and 2 annotation next to each column name so you can confirm the order.
Merge on multiple columns dialog example
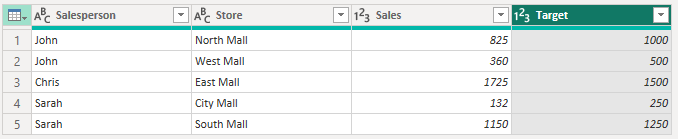
Now, the Sales table contains an accurate and comprehensive view of each salesperson's Sales and Targets.
Merged Sales table: merging on multiple columns
Fuzzy matching only works on text-based columns and is incredibly useful for cleaning data.
What does "fuzzy matching" mean? It's a feature of merge tables that finds and merges rows that are similar but not exactly the same. For example, when there are typos or minor variations in customer names. Regular joins only merge on exact matches, but fuzzy matching allows us to merge on similar matches based on the sensitivity level we set.
Remember to always review the fuzzy match results to ensure they’re accurate. Sometimes, you'll need to make a few manual changes for edge cases where fuzzy matching doesn't work perfectly.
Let's try this with a simple example.
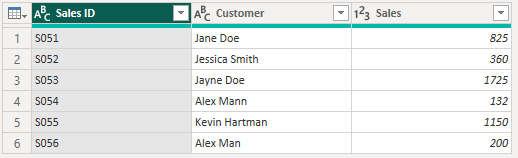
Suppose you have a Sales table containing customer transactions where the customer names are inconsistently recorded. You want to clean up these names to ensure each customer is represented consistently across all records.
Sales table: messy customer names
We'll be able to clean up these customer names by merging the Customers table (with the correct customer names) onto the Sales table and dropping the original messy customer name column.
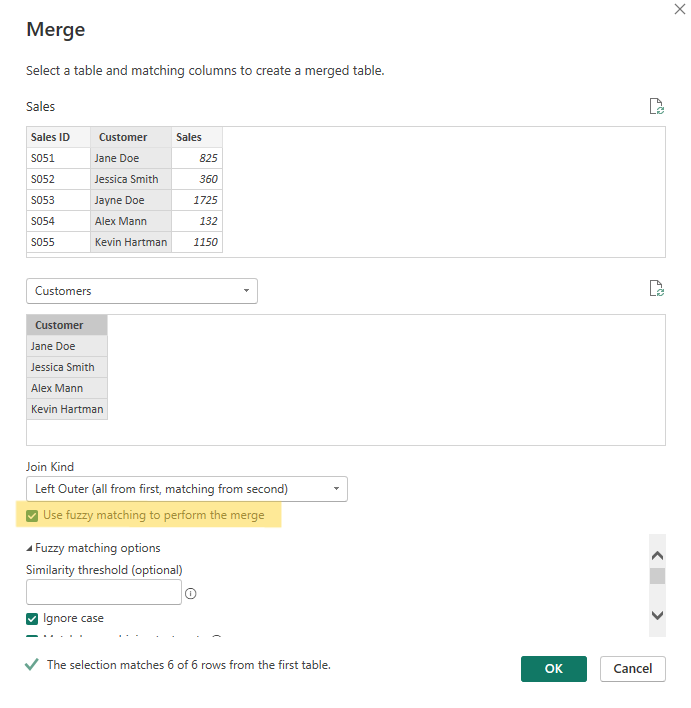
In the Query Editor, select the Sales table and choose the Customer column for the join. Check the “Use fuzzy matching to perform the merge” option and configure the fuzzy matching options if necessary (e.g., similarity threshold).
Merge tables: Fuzzy matching
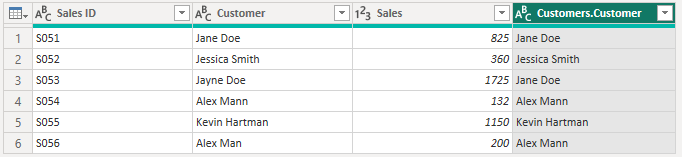
Comparing with and without fuzzy matching for this join, we can see that the two customers with typos in their names are included.
Without fuzzy matching
With fuzzy matching
Expand the column from the Customers table to include the clean Customer column in the Sales table. We can now safely remove the original Customer column and continue building our report using the cleaned Customer column.
Using fuzzy matching to clean text data
Using our first simple example above, let's explore what data transformations are possible after merging the two tables.
If you transform the Products table after merging, those transformations will update the merged results. For example, if you clean up data or add new columns in the Customers table, these changes will be visible in the merged table when the data is refreshed.
For this reason, be careful not to make any changes that could cause errors or inaccurate results for any tables that use the Products table in a merge (such as the Sales table in our example).
On the other hand, you are free to apply transformations to the Sales table in the steps following the merge, as these do not directly affect the merge itself. However, be careful not to add additional transformation steps before the merge, as this could cause an error in the merge and prevent the entire table from loading.
Check out our course on data transformations in Power BI to learn your way around the Power Query editor and everything you can do to prepare your data for reporting.
Managing and merging tables in Power BI can be challenging, especially since there are so many types of joins to choose from.
However, merging tables is too useful a feature for it to be overlooked.
With this tutorial, you can now confidently use Power BI’s merge tables to clean your data and build reports that can incorporate data from various sources.
If you’re ready to take the next step and start your career with Power BI, our comprehensive Data Analyst in Power BI career track covers everything you need to know to land your first job as a Power BI developer. It also fully prepares you to get certified.
Top Power BI Courses
Track
Track
Course
cheat-sheet
Richie Cotton
Tutorial
DataCamp Team
Tutorial
Joleen Bothma
Tutorial
Kafaru Simileoluwa
Tutorial
Joleen Bothma
Tutorial
Joleen Bothma