Course
Intermediate Google Sheets
4 hr
57.2K
While many organizations store data in databases and storage options such as AWS, Azure, and GCP, Microsoft Excel spreadsheets continue to be widely used for storing smaller datasets.
Excel's data science functionality is more limited than R's, so it's useful to be able to import data from spreadsheets to R.
In this tutorial we'll cover reading Excel worksheets (as well as specific rows and columns) into R using the readxl package.
To understand this, you'll need a basic working knowledge of R.
For a more general guide on importing many different file types into R, read How to Import Data Into R: A Tutorial.
The dataset we will read into R is a small one with only two sheets to demonstrate how to specify which sheet to read. It can be found here.
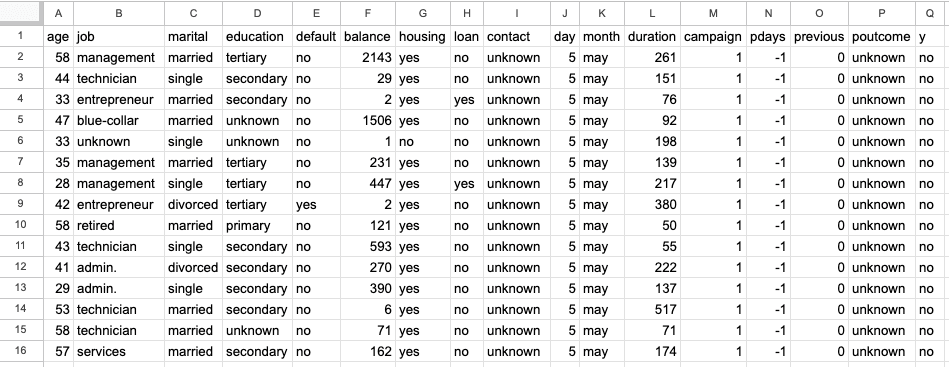
The first sheet is a bank marketing dataset with 45,211 rows and 17 columns. The screenshot below is from the excel file “sample.xlsx” and sheet name “bank-full”.
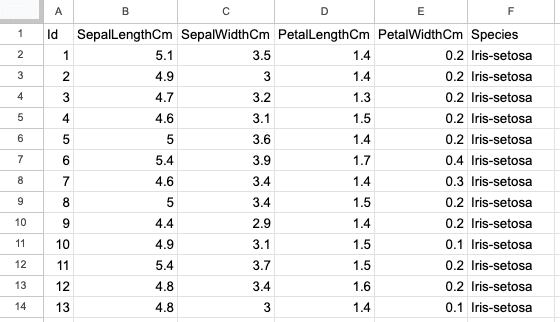
The second sheet is the Iris dataset with 150 rows and 6 columns and contains information about Iris flower types, such as their sepal and petal lengths and widths. The screenshot below is from the same excel file, “sample.xlsx” and sheet name “iris”.
This tutorial uses the readxl package. The openxlsx package is a decent alternative that also includes the ability to write to XLSX files, but has less strong integration with tidyverse packages such as dplyr and tidyr.
To read Excel files with the readxl package, we need to install the package first and then import it using the “library” function.
install.packages("readxl")You will see the below output in the console, signaling successful installation.
trying URL 'https://cran.rstudio.com/bin/macosx/big-sur-arm64/contrib/4.2/readxl_1.4.2.tgz'
Content type 'application/x-gzip' length 1545782 bytes (1.5 MB)
==================================================
downloaded 1.5 MB


The downloaded binary packages are in
/var/folders/mq/46mc_8tj06n0wh2xjkk08r140000gn/T//RtmpHIGYqM/downloaded_packages
To use “readxl” methods, run the below command in the R-console.
library(readxl)Note that openxlsx package is another good alternative to write to XLSX files.
Let’s read all the data from the first worksheet, “bank-full”, with read_xlsx() and only the path argument.
bank_df <- read_xlsx(path = "sample.xlsx")The resultant data is a tibble.

You can also use read_excel() in the same way as read_xlsx(), and all the arguments you are going to see in the upcoming sections work similarly with this function. read_excel() will try to guess whether you have an XLSX spreadsheet, or the older XLS spreadsheet type.
bank_df <- read_excel(path = "sample.xlsx")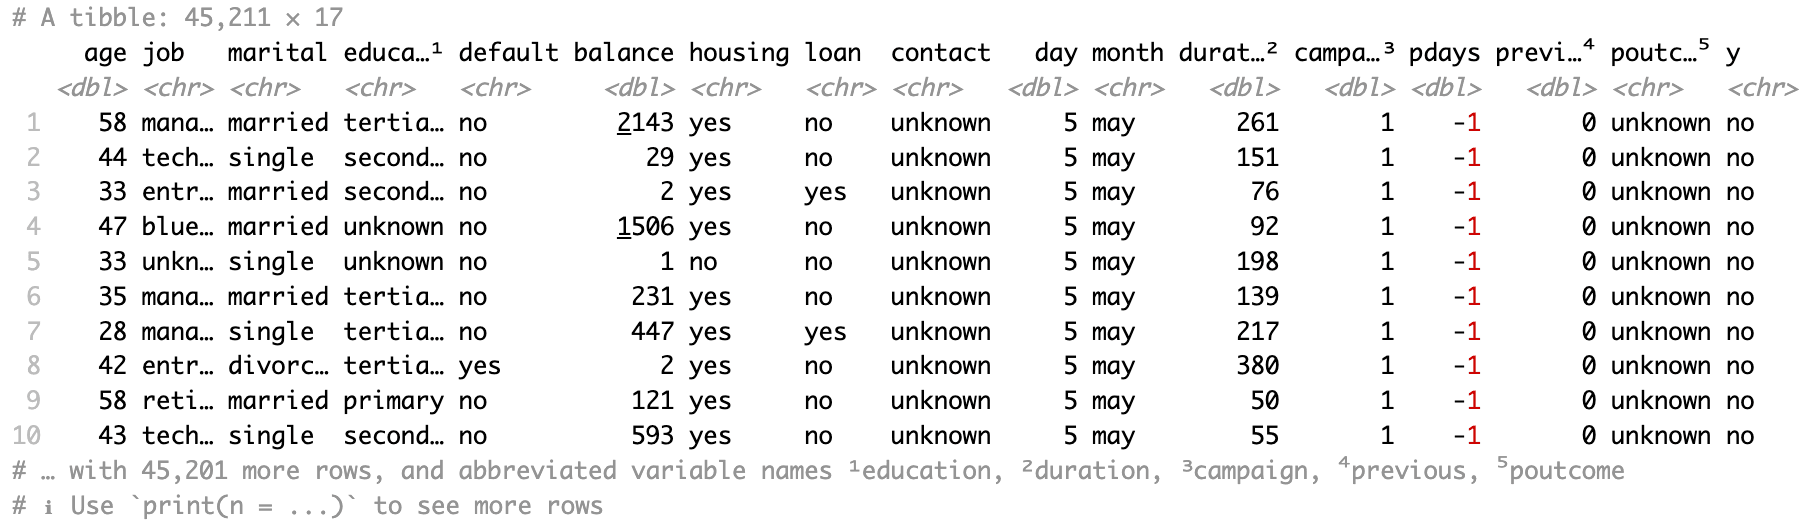
Now let’s read all the data from the second workbook, i.e., “iris” with the read_xlsx() function and sheet argument.
iris <- read_xlsx("sample.xlsx", sheet = "iris")
You can also specify the sheet number in the sheet argument instead of the sheet name.
iris2 <- read_xlsx("sample.xlsx", sheet = 1)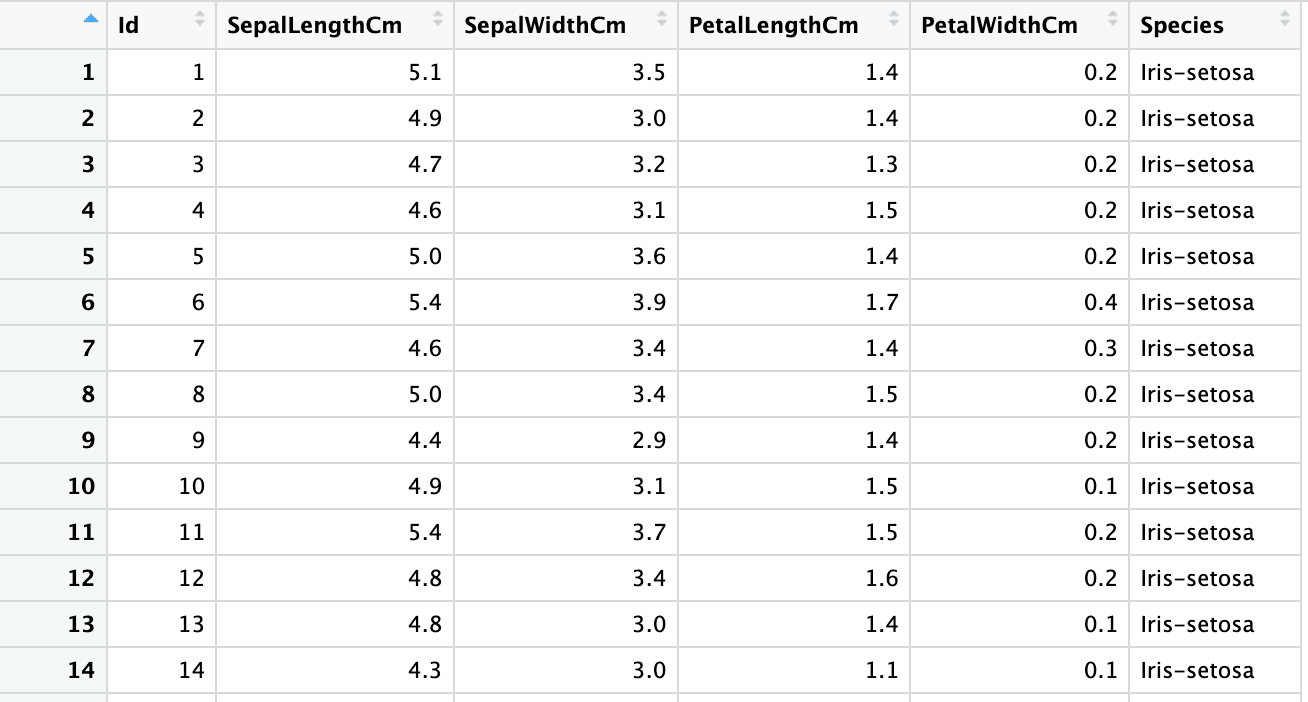
Let’s read specific rows from a workbook by setting the skip and n_max arguments. For skipping the first few rows, you can use the skip argument with a value equal to the number of rows you want to skip.
bank_df_s2 <- read_excel("sample.xlsx", sheet = "bank-full", skip = 2)Please note that the above code skips the headers as well. You will learn how to specify headers explicitly in read_xlsx() function in the subsequent sections.
Similarly, to read the first n rows, specify the n_max argument in the read_xlsx() function. The below code reads the first 1000 rows of the “bank-full” sheet.
bank_df_n1k <- read_excel("sample.xlsx", sheet = "bank-full", n_max = 1000)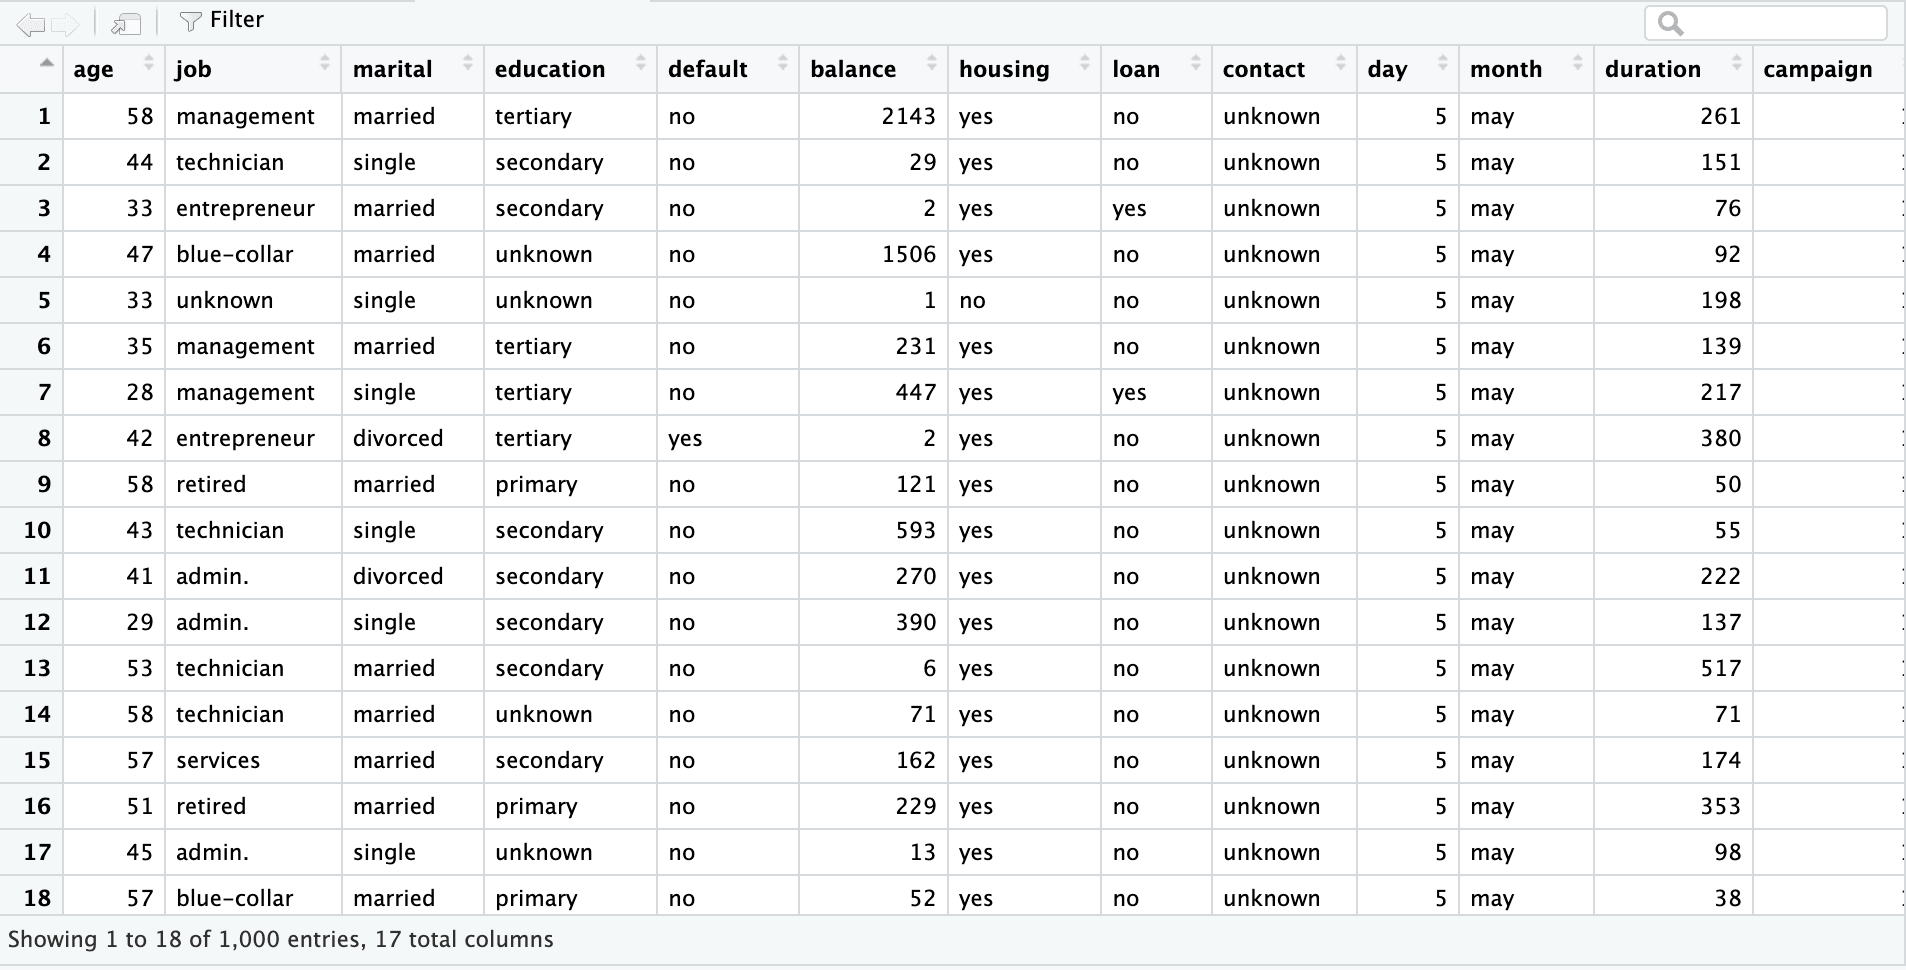
You can also combine both arguments to skip a few rows and read a specific number of rows from the remaining dataset.
While “skip” and “n_max” arguments enable you to read a subset of the rows of the data, you can read specific cells from a workbook by setting the range argument.
There are two notations to specify the subset of the dataset:
The idea is to specify the coordinates of the rectangle you want to snip out from the dataset.
Notation 1:
bank_df_range1 <- read_excel("sample.xlsx", sheet = "bank-full", range = "A3:E10")Notation 2:
bank_df_range2 <- read_excel("sample.xlsx", sheet = "bank-full",

                 range = "R3C1:R10C5")
Range also allows you to include the sheet name in the argument (example: wbook!E4:G8).
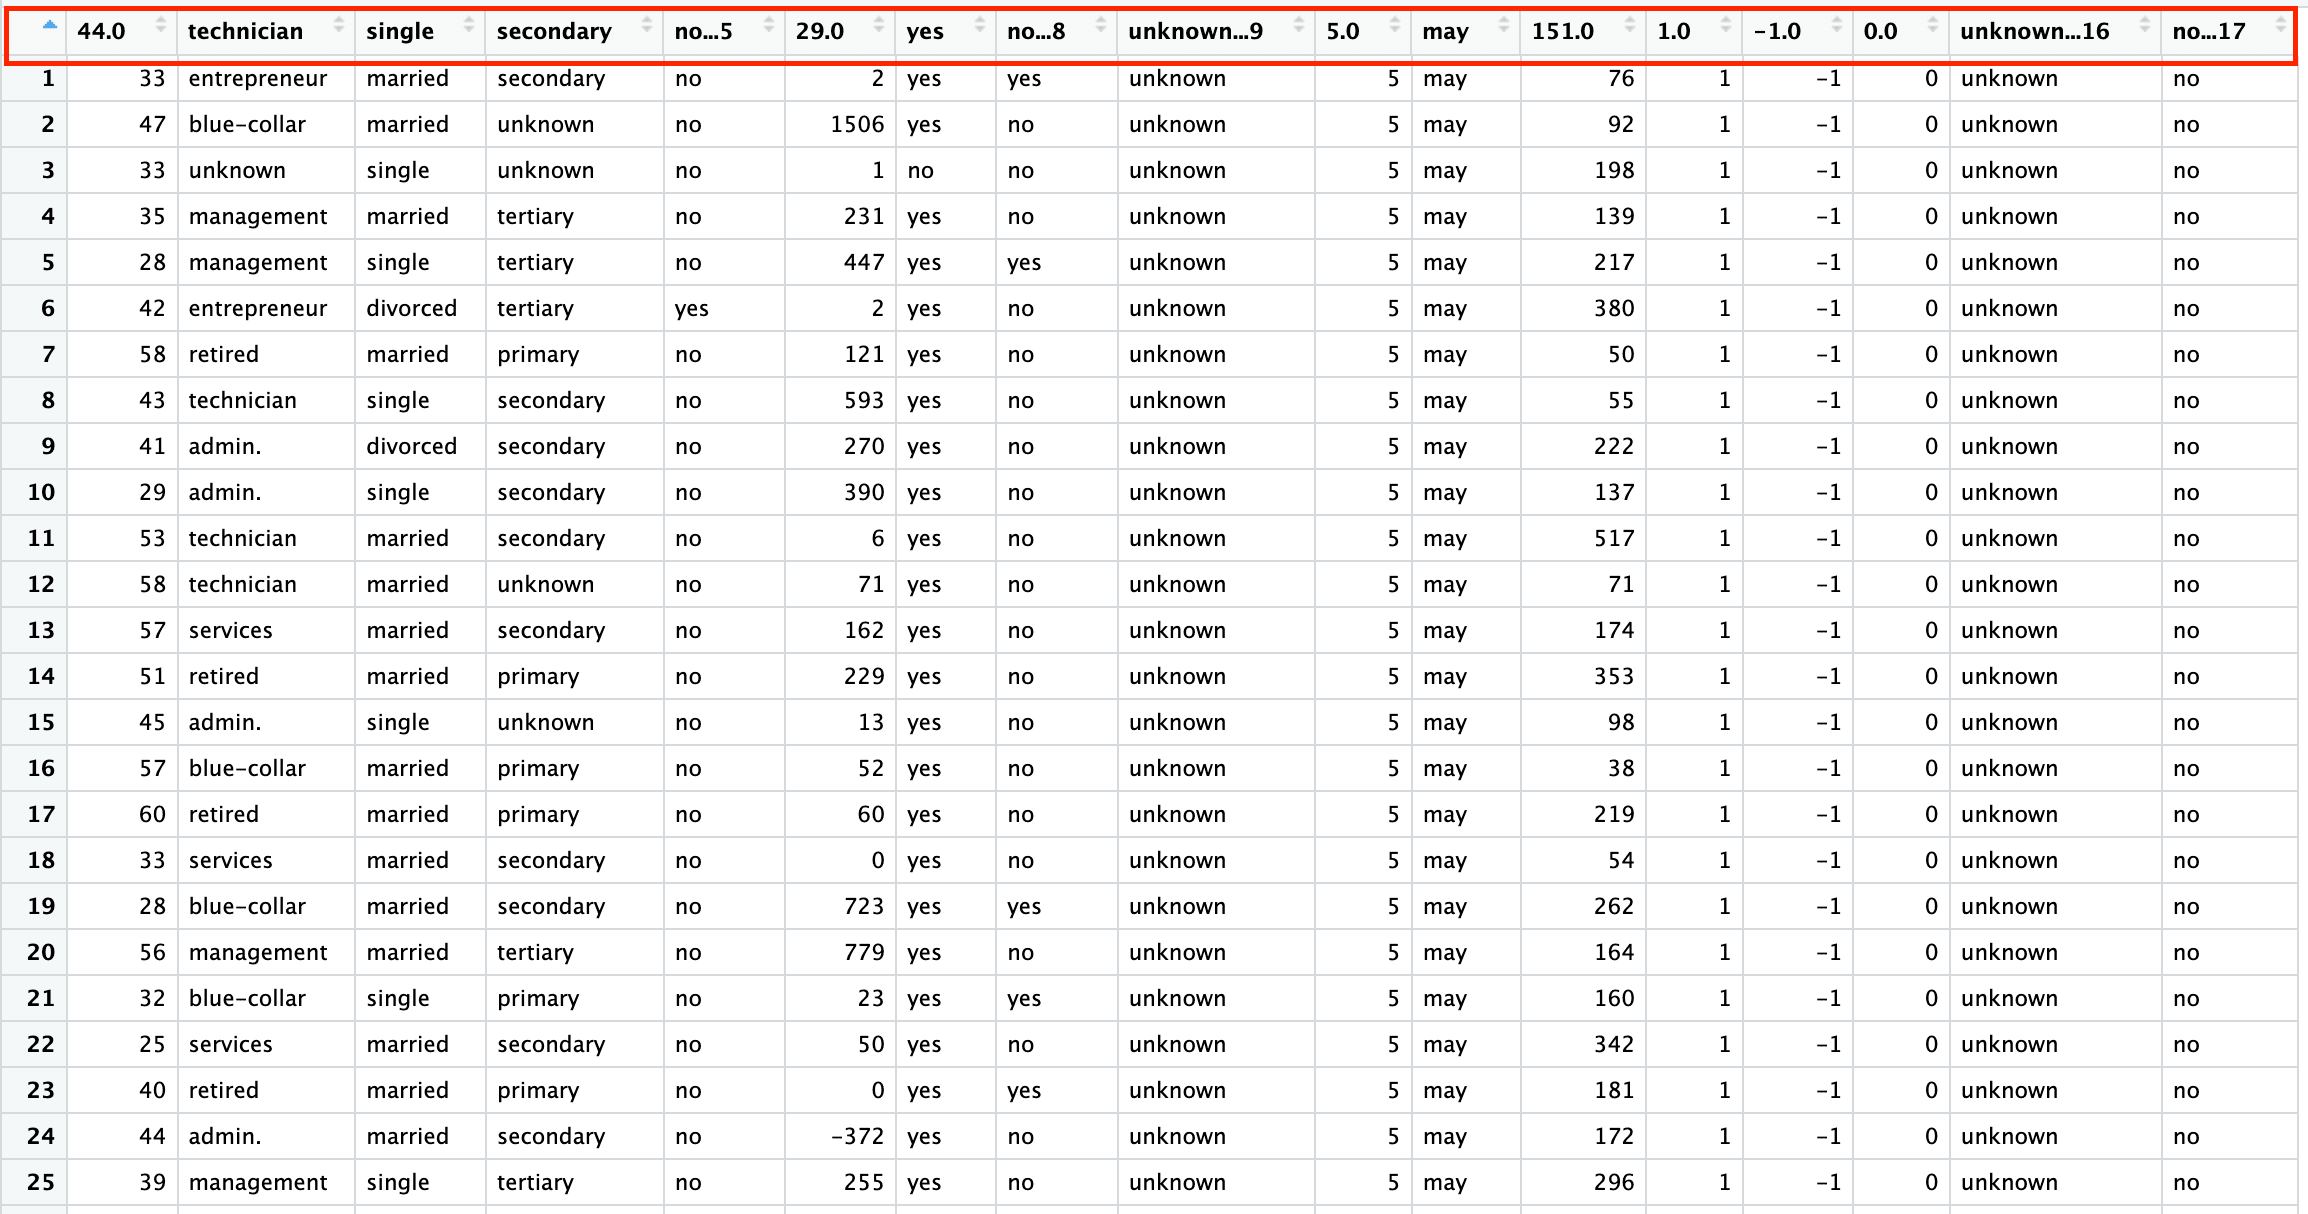
bank_df_range3 <- read_excel("sample.xlsx", range = "bank-full!R3C1:R10C5")Let’s read data that has no header row by setting the col_names argument to a character vector.
PS: We are using the skip argument first to remove the header row.
columns <- c("ID", "Sepal Length", "Sepal Width", "Petal Length", "Petal Width", "Species Name")

iris3 <- read_excel("sample.xlsx", sheet = 2, skip = 1, col_names = columns)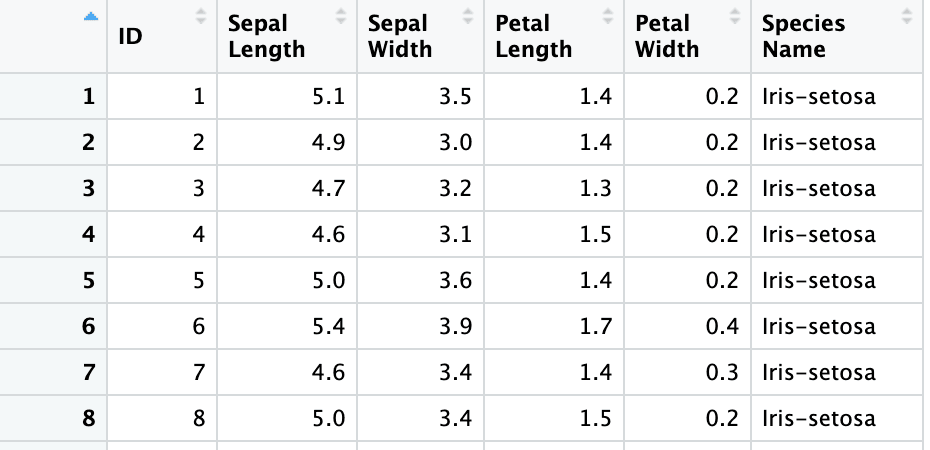
In the last section, the headers we specified were space-separated. You can turn header names into syntactic R variables with .name_repair = "universal" argument.
iris4 <- read_excel("sample.xlsx", sheet = 2, skip = 1,
                  col_names = columns, .name_repair = "universal")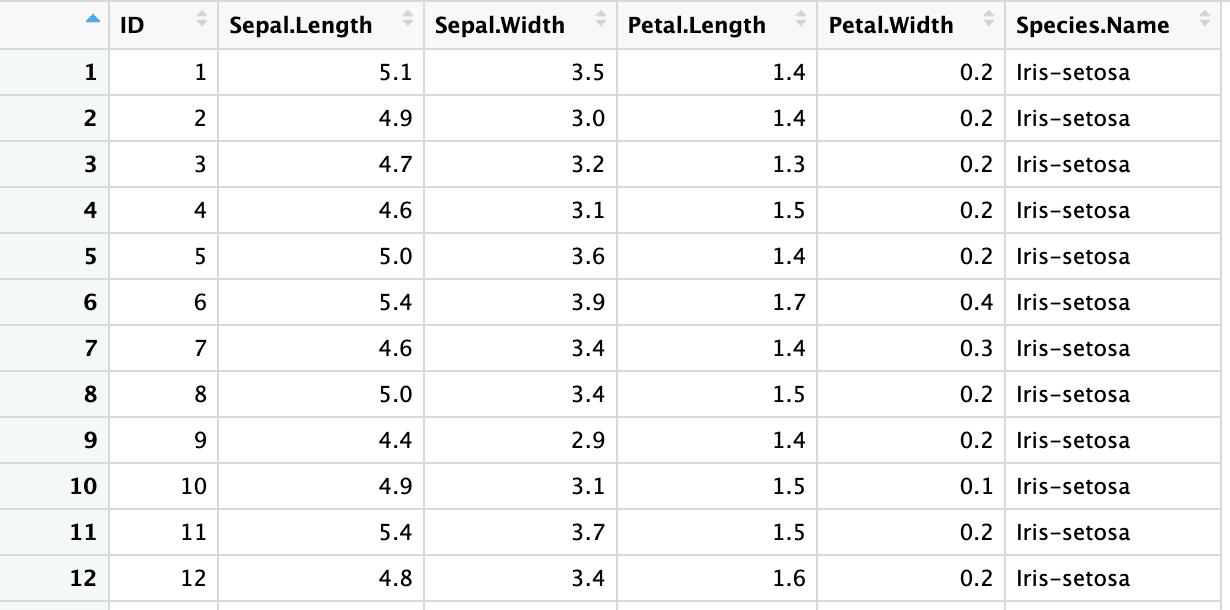
By default, when you read an excel file, R guesses the data type of each variable. Let’s observe the column types of the iris dataset read using the default arguments.
sapply(iris, class) Id SepalLengthCm SepalWidthCm PetalLengthCm PetalWidthCm Species
"numeric" "numeric" "numeric" "numeric" "numeric" "character" To override the column type guesses, you can use the col_types argument.
iris5 <- read_excel("sample.xlsx", sheet = 2,
      col_types = c("numeric", "numeric", "numeric", "numeric", "numeric", "text"))

sapply(iris5, class)
Id SepalLengthCm SepalWidthCm PetalLengthCm PetalWidthCm Species
"numeric" "numeric" "numeric" "numeric" "numeric" "character" 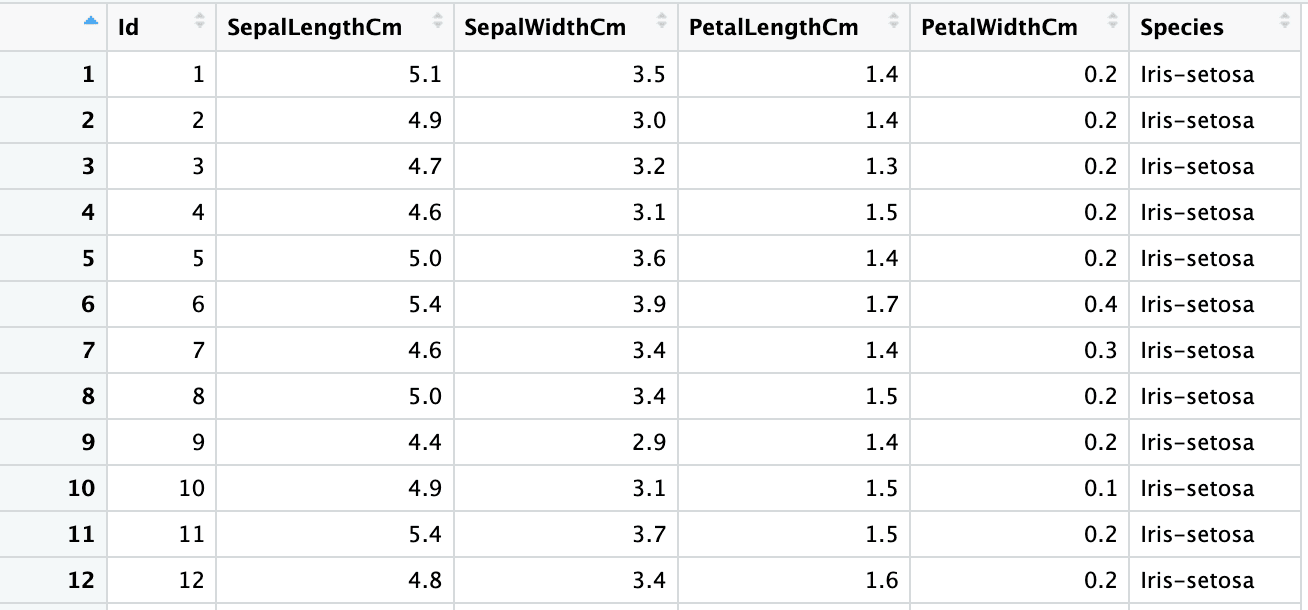
You can also let R guess the column types of selected variables by specifying col_types value as “guess” for a particular column.
iris6 <- read_excel("sample.xlsx", sheet = 2,
        col_types = c("guess", "numeric", "numeric", "numeric", "numeric", "text"))

sapply(iris6, class)
Id SepalLengthCm SepalWidthCm PetalLengthCm PetalWidthCm Species
"numeric" "numeric" "numeric" "numeric" "numeric" "character" 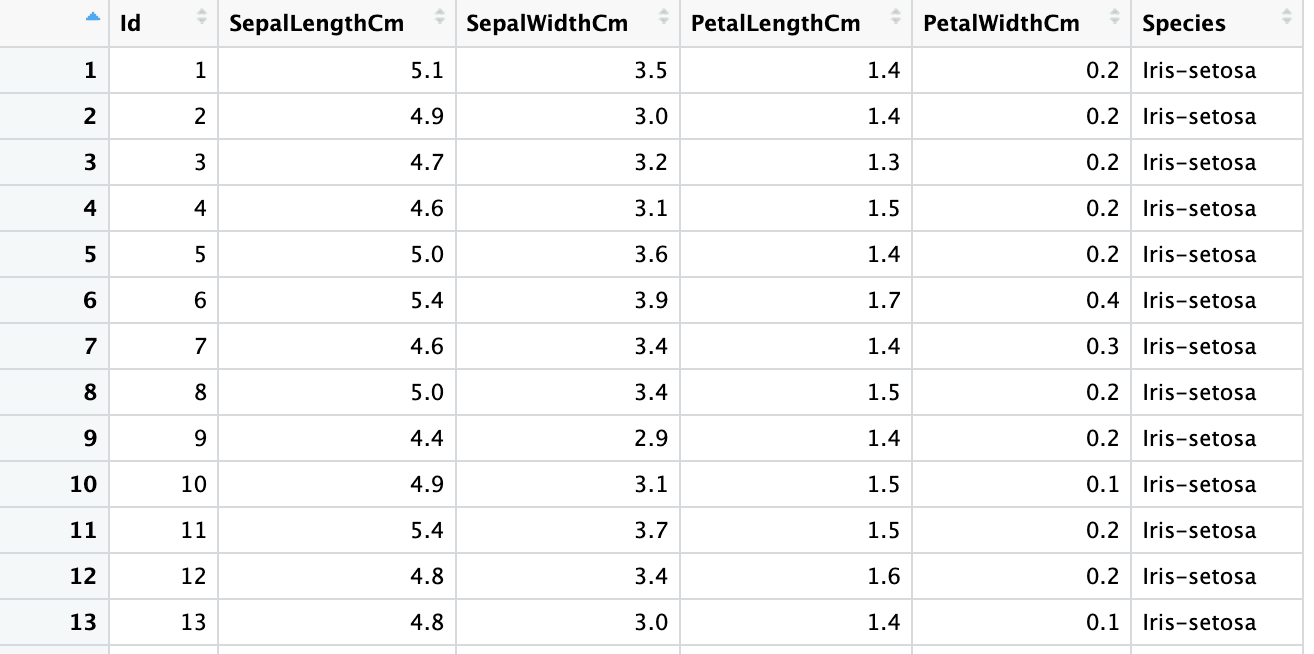
While you often hear people saying, the more the data, the better. But in many use cases, you find that some of the variables/columns do not hold any signal, that can be because of any of the below reasons.
You can skip reading some of the columns by setting col_types to "skip" as demonstrated below.
iris7 <- read_excel("sample.xlsx", sheet = 2,
col_types = c("numeric", "skip", "skip", "numeric", "numeric", "text"))
sapply(iris7, class)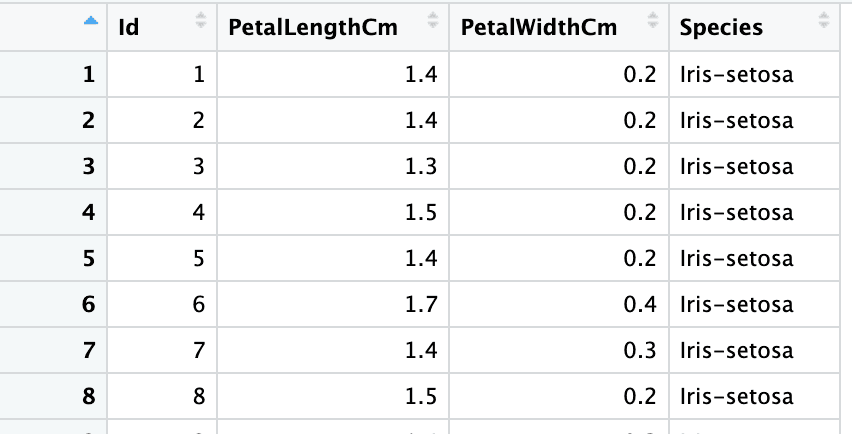 Take It To The Next Level
In a world where data is generated at a humongous pace and in varied forms, your programming language must support reading these data types. R is one of those powerful languages that support this endeavor. Enroll in the “Introduction to Importing Data in R” course to learn how R offers packages to import varied datasets. This course offers tutorials and quizzes to strengthen your understanding of importing data in R.
Learn more about R and Spreadsheets
Course
cheat-sheet
Richie Cotton
Tutorial
Abid Ali Awan
Tutorial
Natassha Selvaraj
Tutorial
Karlijn Willems
Tutorial
Ryan Sheehy