Course
Tableau is not just a data visualization tool. As one of the leading business intelligence platforms, Tableau provides powerful analysis capabilities that can be done through the user interface or by using its comprehensive Calculated Fields formulas.
In this article, we will learn about performing a count distinct operation in Tableau. We will explain what a distinct count is, the different ways to do it, and we will show how to build on it to calculate insightful business metrics as examples.
For those new to Tableau, you might find our Tableau Tutorial for Beginners helpful to get started. Also, consider taking our Introduction to Tableau course or exploring our Tableau Fundamentals skill track.
Importing Data into Tableau
First, we will need to fetch some data. We will use Tableau’s famous “Superstore Sales” dataset. To download the dataset from Tableau Public (or Desktop), follow these steps:
- Choose Explore sample data sets from the right pane. This will open a webpage in the browser.
- Click Download on the “Superstore Sales” dataset.
- Save the file on your computer.

Downloading sample dataset. GIF by Author.
Now, to import the dataset into Tableau:
- Choose Microsoft Excel from the Connect left pane.
- Choose the “Superstore Sales” file. This will open the Data Source page.
- We can see that the file has three sheets. We will work with the "Orders" sheet (the first one). Drag it from the left side and drop it in the upper middle area. We see that our sheet has 22 fields and 9,994 rows.

Importing data into Tableau. GIF by Author.
Become a Tableau Data Analyst
How to Count Distinct Values in Tableau
There are two ways of performing a distinct count in Tableau: from the Measure Names shelf, and through a Calculated Field. Calculated Fields have the advantage of being reusable and can be expanded to create more complex measures, making them more efficient in the long run compared to off-the-shelf methods, which are quicker but need to be recreated each time. Let’s start with the easy one- the Measure Names shelf.
Count Distinct with the Measure Names shelf
Before we do the distinct count, we will need to start building a simple visual. Let's start with a basic bar chart that compares product categories based on the number of customers who purchased items from each category in Superstore's catalog.
To start, go to "Sheet 1" and drag and drop Category into the rows area and Customer ID into the columns area. Since Customer ID is a dimension column (categorical data), it will be colored blue. Also, since it has too many distinct values, Tableau will ask you if you want to add all members of the column. For now, select Add all members.
Now, we will use the Customer ID as a measure to count how many unique customers purchased the products of each category. To do so:
- Go to the Columns shelf.
- From the dropdown menu, go to Measure.
- Notice that the options include Count and Count (Distinct). We will choose Count (Distinct).
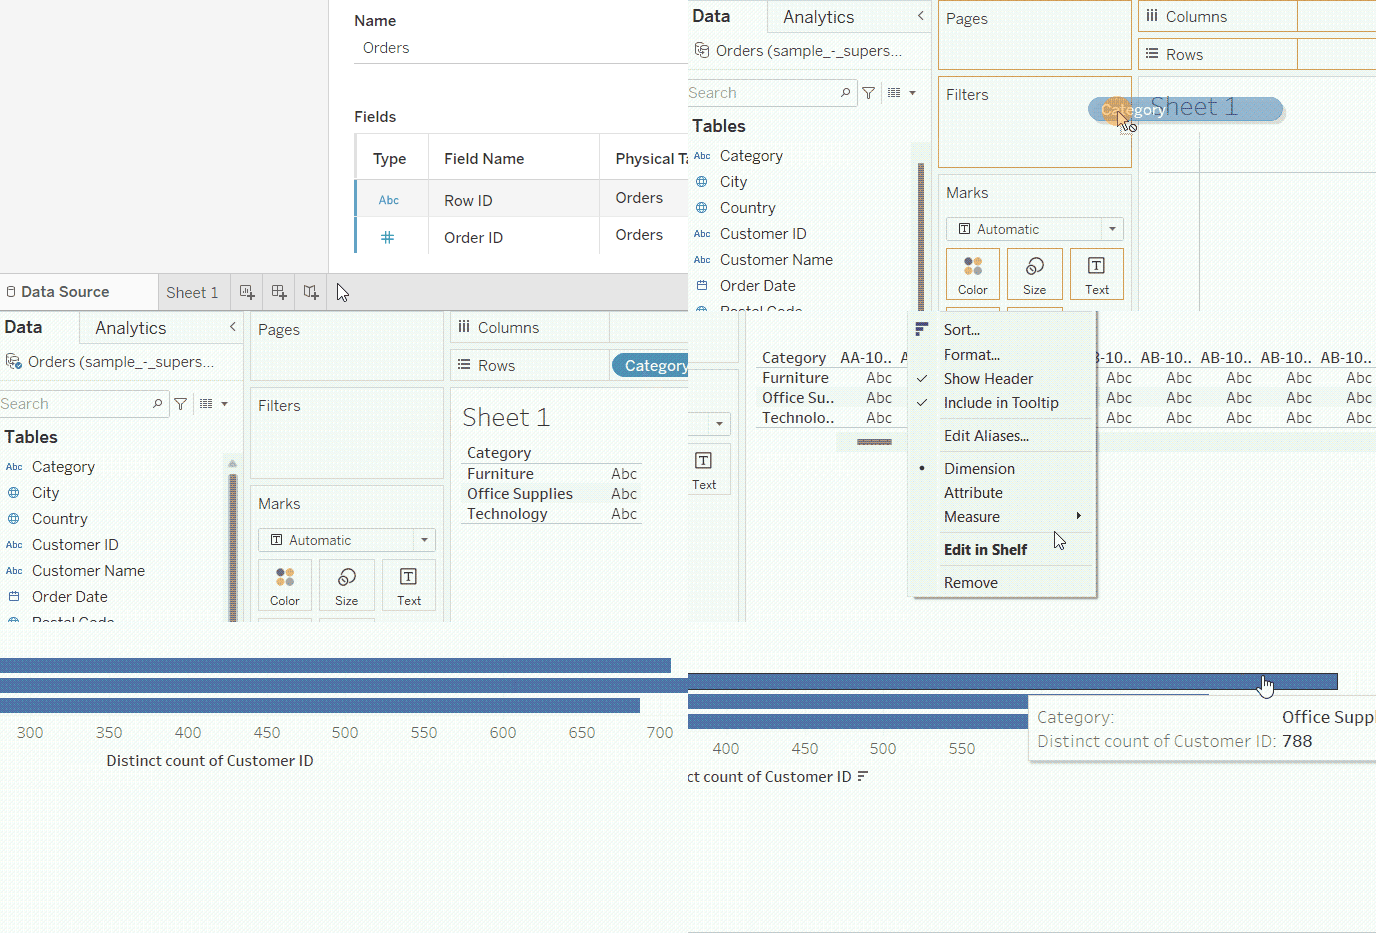
Distinct count from the Measure Names shelf. GIF by Author.
And there you have it! The number of unique customers for each category of products. We see that there are 788 customers for the Office Supplies category.
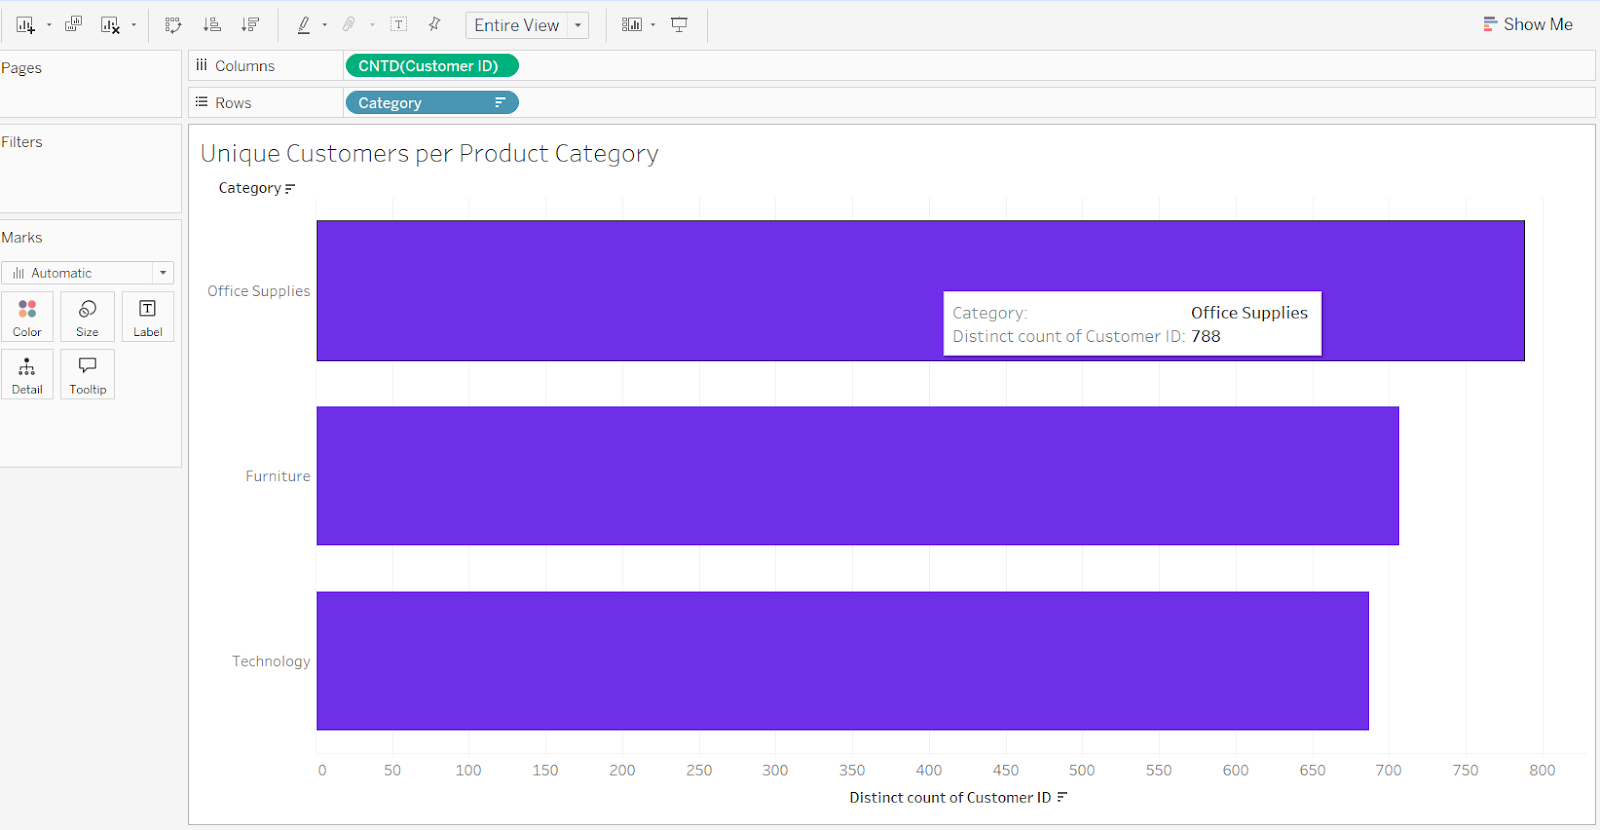
Unique customers of each product category. Image by Author.
Count vs. Count Distinct in Tableau
Before we proceed further, let’s see the difference between count and distinct count in the case of Customer ID. To show the difference, we can add a second Customer ID field on the columns shelf. Follow the same previous steps, except, this time, we will choose Count not Count (Distinct) from the Measures menu.
Don’t worry if, for the moment, this results in a weird view. We will change it in a second. Continue by going to the Show Me tab on the right corner, and choose one of the bar chart options.
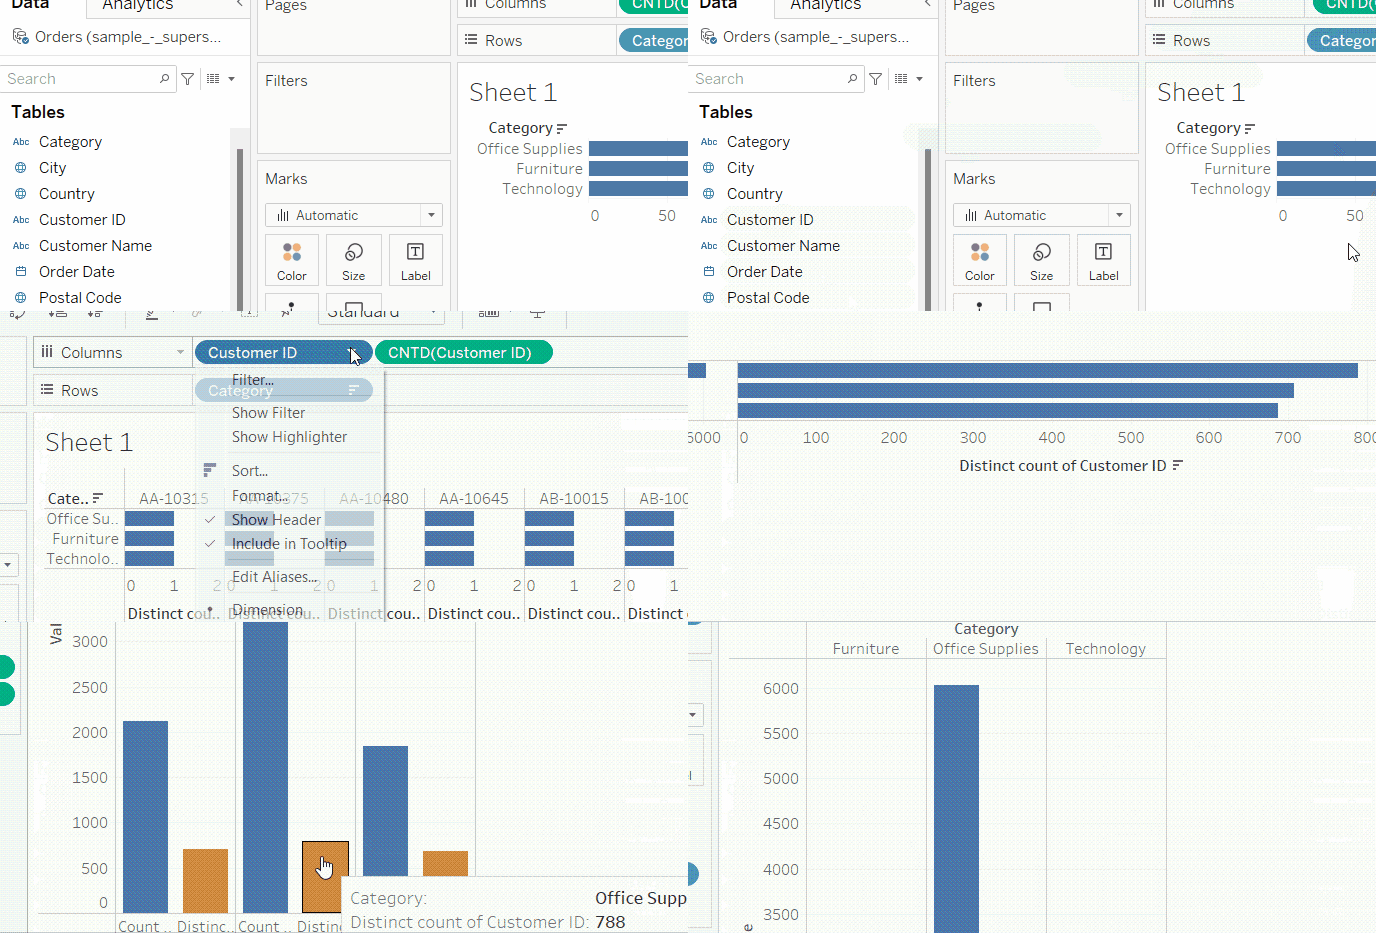
Comparing Count and Distinct Count. GIF by Author.
In the resulting view, we see a comparison between count (grey columns) and distinct count (light green columns) for each product category. The difference between the two is the number of repeated customer IDs. We also discover that Office Supplies is the category with the biggest difference between the two counts, and therefore has the highest frequency of purchases by its customer base.
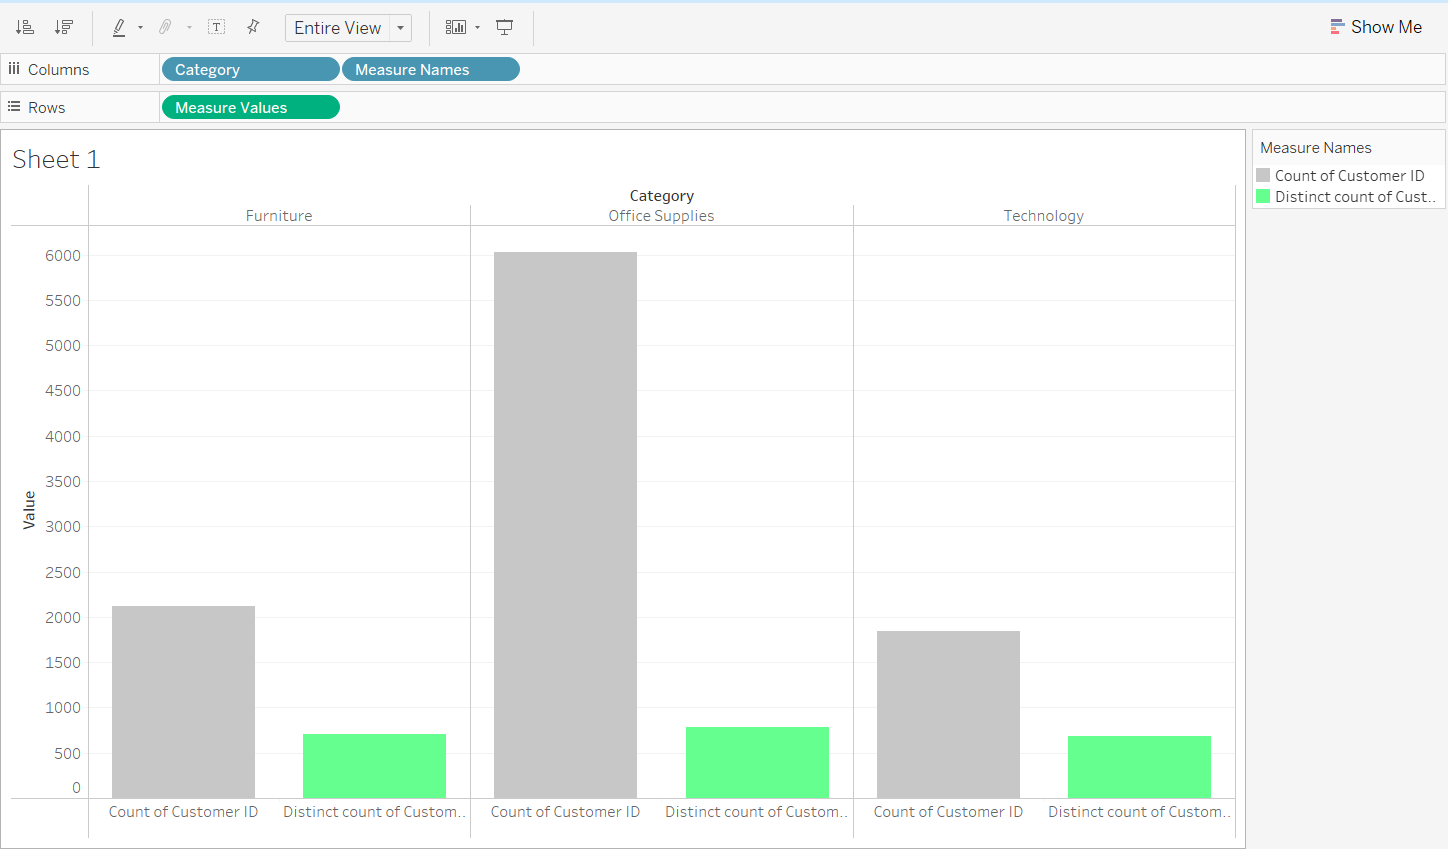
Comparing Count and Distinct Count using a bar chart. Image by Author.
Count Distinct with Calculated Fields
Creating a distinct count from the measures shelf is an easy and quick method, but it does have a big drawback. If we needed to add another distinct count for Customer ID in the same view, or in a new sheet, we would have to repeat the same steps. Additionally, if we wanted to build a new measure based on the distinct count of customers, we would need to create the measure from scratch. In other words, using the Measure Names shelf gives us a one-time aggregation, and not a permanent one.
To create a permanent distinct count, we would need to create a Calculated Field that uses the COUNTD() function. We will now do so in one of two ways:
-
Simple
COUNTD()Calculated Field -
COUNTD()with an LOD expression
Simple COUNTD() Calculated Field
Behind the distinct count that we created in the Measure Names shelf, what actually happened is that Tableau used the COUNTD() function, which simply counts each unique Customer ID once. In our previous method, the aggregation is performed on the shelf, and not stored as a measure in our fields list.
To store it as a measure in our fields list, we need to create a Calculated Field. To create a simple distinct count Calculated Field for customers in our dataset, we follow these steps:
-
Click on the small downward arrow, next to the search bar, in the Data pane on the left.
-
From the dropdown menu, choose Create Calculated Field….
-
In the popup window, we give the field a name:
Unique Customers, and write the following formula:COUNTD([Customer ID]). -
Notice that when we complete the formula, we get a message at the bottom of the box saying “The calculation is valid,” which is good news. Let’s click OK.
-
The Calculated Field is now listed permanently in our measures list. We now replace the
CNTD(Customer ID)field in the shelf with our new Calculated Field. It gives the same result, which is what we expect.
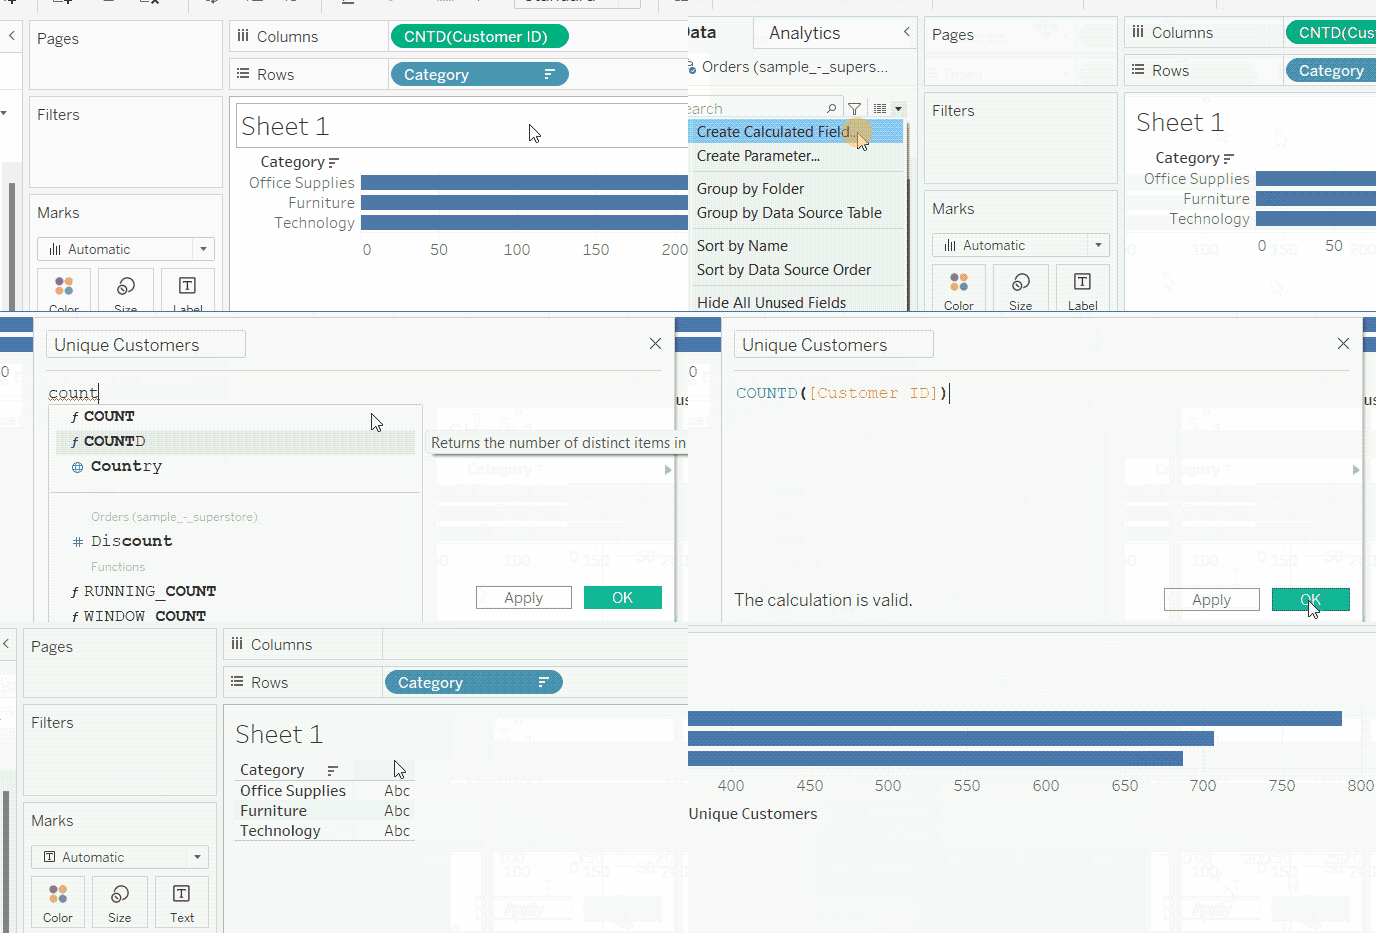
Distinct Count with a Calculated Field. GIF by Author.
COUNTD() with an LOD expression
We can use COUNTD() in a level of detail (LOD) expression to create a distinct count for customers per each product category. This would give us a permanent measure for category customer base, which we can use for more complex measures later on.
To do so, we will follow the same previous steps for creating a Calculated Field, but this time, we will call it Category Customer Base and write the following formula:
{FIXED [Category]: COUNTD([Customer ID])}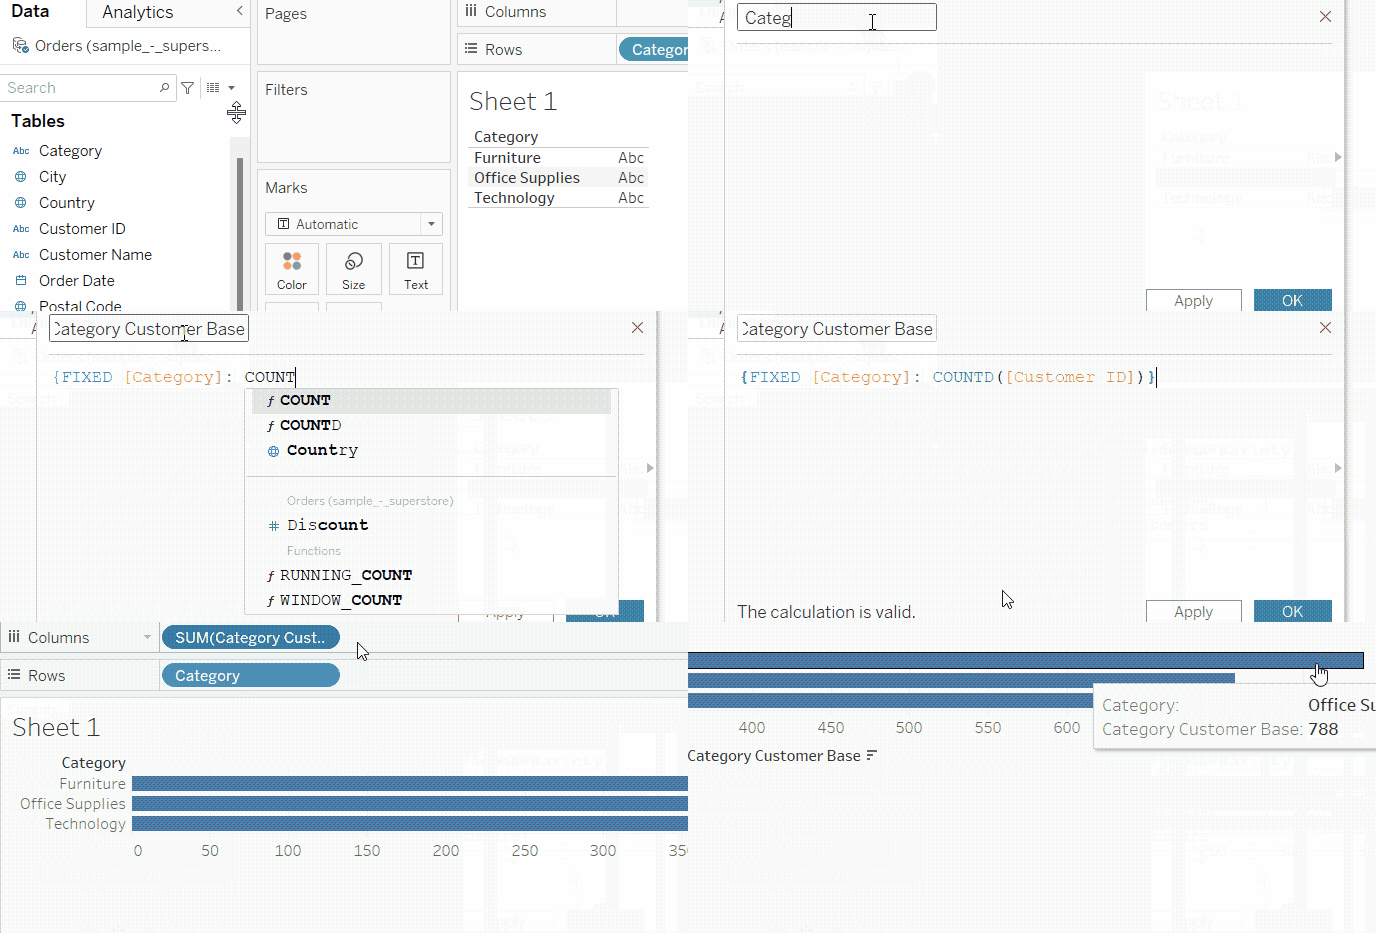
Distinct Count in LOD expressions. GIF by Author.
If you are new to LOD expressions, I recommend you read our LOD Expressions in Tableau tutorial. However, for the scope of this article, know that what the previous formula does simply is count the unique customers for each category separately. We use the curly brackets {} to indicate that this is an LOD expression, and we use FIXED to indicate that the distinct count should be on the level of detail of the Category column.
Creating KPIs with Count Distinct in Tableau
One of the benefits of creating Calculated Fields is that they can be used in other measures without having to write the whole formula from scratch in each one.
For this reason, using COUNTD() with Calculated Fields is a great technique that helps you move forward quickly to find new insights. It can help us find the number of orders, customers, or products, which can be business metrics themselves, or to use them to calculate more complex business KPIs, like average profit per customer or average quantity per order, to name a couple. Let’s take a look at ways in which we can use COUNTD() to gain valuable, business-relevant insights.
Average orders per customer
We can use the Unique Customers measure alongside a new measure that calculates the average number of orders per customer. We do this by creating a new Calculated Field with the following formula, which we call Avg Orders per Customer:
COUNT([Order ID])/[Unique Customers]Ratio of customers receiving discounts
Similarly, we can take it up a notch to calculate the ratio of customers that got a high discount (say above 50%) on any of their orders out of all the customers the Superstore has. For this, we will use a formula that combines a logical function with the COUNTD() function.
COUNTD(IF [Discount] > 0.5 THEN [Customer ID] END)/[Unique Customers]Customer retention rate
We can use another combination of COUNTD() with IF to create more complex metrics, like retention rate. So, to count the ratio of customers who placed an order in the most recent year out of all customers in the dataset, we create a Customer Retention Rate field with the following formula:
COUNTD(IF YEAR([Order Date]) = {MAX(YEAR([Order Date]))} THEN [Customer ID] END)/[Unique Customers]Here, the LOD expression is used to get the maximum (most recent) year in the whole dataset and compare it with the year of each row. If they are equal, then the customer has been retained in the most recent year and therefore should be counted. If not, then the customer will not be considered by the COUNTD() function.
Category penetration ratio
We can use both Category Customer Base and Unique Customers in one formula to calculate a KPI that measures the ratio of each category’s customers out of the overall number of customers in the dataset. Let’s call this Category Penetration Ratio.
[Category Customer Base]/{[Unique Customers]}Like the previous formula, an LOD expression, indicated by the curly brackets {}, is used to calculate the unique customers in the whole dataset. We needed to do this as the Category Customer Base Calculated Field has a different level of aggregation.
Average profit per customer in each category
To find the average profit per customer in each category, we would create Avg Profit per Customer in Each Category, and define it as follows:
{FIXED [Category]: SUM([Profit])}/[Category Customer Base]Here, a full FIXED LOD expression is used to calculate the total profit per category before dividing it by Category Customer Base. The denominator part of the formula could also have been created as a separate measure first.
Labeling categories with limited customers
Another way to use Category Customer Base as an LOD field is to label each category based on the size of its customer base. If a category has fewer customers than the average across the three categories, it will be labeled as Limited Base. Otherwise, it will be labeled as Normal. We can create this field using the following formula, and call it Limited Categories.
IF [Category Customer Base] < {AVG([Category Customer Base])} THEN "Limited Base" ELSE "Normal" ENDResources and Further Learning
In this article, we saw how to create a distinct count through both the Measure Names shelf, as well as through by using Calculated Fields with the COUNTD() function. For Calculated Fields, we used both a simple form and also an LOD expression. Finally, we used our knowledge to show how a business analyst might create more complex metrics and KPIs.
If you are intrigued by what you saw in this tutorial, and you are getting started with Tableau, you can check out our Tableau Fundamentals skill track. If you are looking to become certified as a data analyst in Tableau, check out our Data Analyst in Tableau career track which has a certification available, and stay tuned for more Tableau tutorials to come from DataCamp!
Become Certified in Tableau

Islam is a data consultant at The KPI Institute. With a journalism background, Islam has diverse interests, including writing, philosophy, media, technology, and culture.
Frequently Asked Questions
What is the difference between Count and Distinct Count?
Count counts all values in the field, where Distinct Count counts unique values only.
When should I use Distinct Count instead of Count?
Use a distinct count when a column in the dataset has repetitions, and you need to count its unique values only.
What is the function for a Distinct Count in Tableau?
You can do distinct count with the COUNTD() function in Tableau’s calculation fields.
Can I use `COUNTD()` function in Tableau LOD expression?
Sure you can!