Course
Введение в Python для финансов
4 ч
103.2K
Most stock API comparisons start in the wrong place.
They compare pricing tiers, endpoint counts, documentation pages, and free-plan limits. Those details matter, but they do not tell you whether the API can support the system you are building.
A backtest does not fail because the provider has fewer endpoints than a competitor. It fails because historical prices are not adjusted correctly, the data history is too short, or corporate actions are handled poorly.
A dashboard has a different failure mode. It breaks when quote responses are slow, fields change unexpectedly, or rate limits become a problem once users start refreshing the page.
That is why I treat generic “best stock API” lists as starting points, not answers. The real question is: "Will this API still work when my project stops being a prototype?"
Once an API powers a real workflow, it becomes data infrastructure:
Switching later is painful because you are not only changing a request URL. You may need to rewrite pipelines, refresh jobs, update storage logic, adjust model inputs, and revise parts of the user interface.
The IEX Cloud shutdown in 2024 is a useful reminder. Many developers and companies had built dashboards, apps, and internal tools around its API. Once the service was discontinued, migration meant rethinking endpoints, fields, pricing, licensing, and data assumptions.
Before comparing providers, identify the workflow the API will support. A backtester and a dashboard may both use stock prices, but they do not depend on the same data requirements.
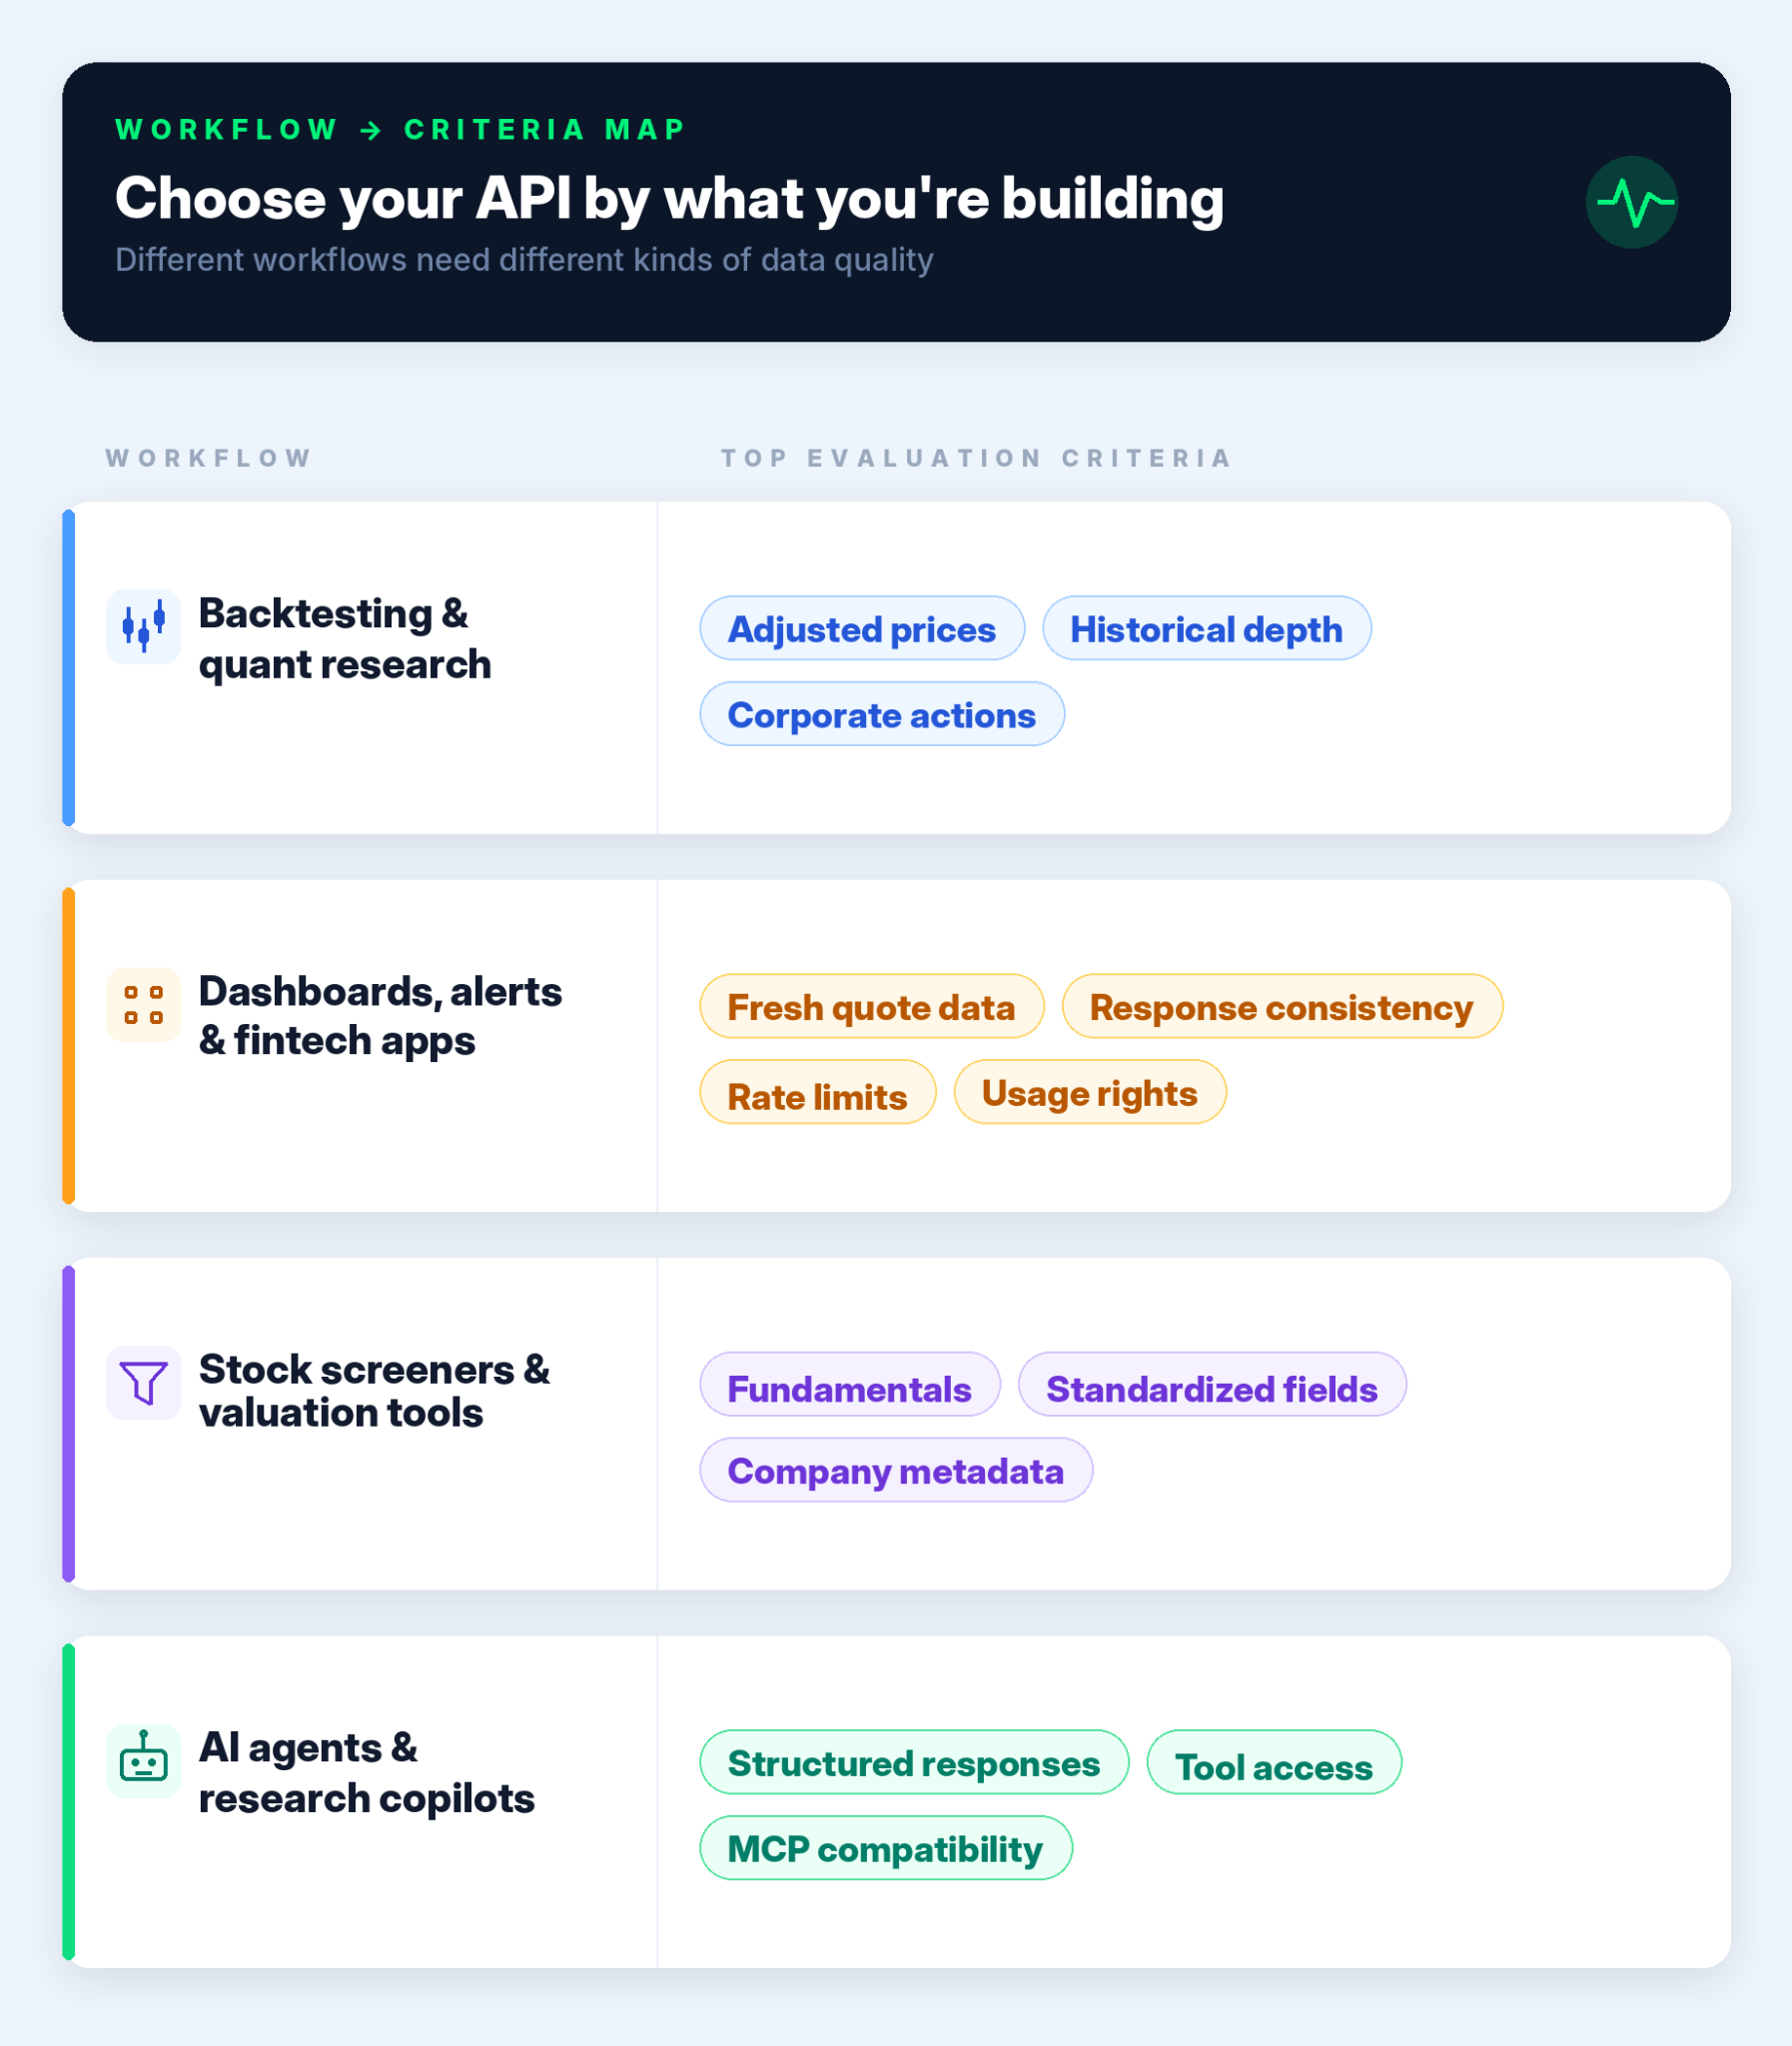
For backtesting, clean historical data usually matters more than live data.
Key criteria to check:
For a deeper dive into implementing and testing trading strategies in Python, our Algorithmic Trading in Python tutorial walks through backtesting concepts and pitfalls in more detail.
Dashboards and alert systems prioritize freshness, reliability, and consistency. A private notebook can tolerate a failed request or a messy field name. A user-facing product cannot.
Key criteria to check:
Screeners and valuation tools need business data, not just price data. The main challenge is comparison because you are usually filtering or ranking many companies at once.
Key criteria to check:
AI workflows need APIs that return structured, predictable data. An LLM can summarize text, but it should not guess financial data.
Key criteria to check:
To go from API data to a working agent, the Model Context Protocol (MCP) guide covers how MCP connects AI models to external tools, while the Building LangChain Agents and OpenAI Agents SDK tutorials show how to put that into practice with Python.
Once you know the workflow, comparing APIs becomes easier. You are no longer asking, “Which provider has the most features?” You are asking, “Which provider can support the data layer this project needs?”
|
Criterion |
What To Check |
Why It Matters |
|
Data coverage |
Asset classes, markets, symbols, and geography |
The API should cover the universe your project actually needs |
|
Historical depth |
Length of history, full-history access, adjusted and unadjusted data |
Backtests and research tools need more than recent data |
|
Data quality and corporate actions |
Splits, dividends, ticker changes, missing rows, and stale symbols |
Bad adjustments can distort charts, returns, and model outputs |
|
Fundamentals support |
Statements, earnings, ratios, company profiles, and metadata |
Screeners and valuation tools need business context, not just prices |
|
Licensing and redistribution |
Display rights, storage rights, commercial use, and exchange rules |
A notebook use case is different from a public or paid product |
|
Developer experience |
Documentation, response format, errors, rate limits, and Python usability |
Clean APIs save time after the first request |
|
AI and agent readiness |
Structured responses, tool access, MCP support, and predictable schemas |
AI assistants need data they can retrieve, parse, and reason over |
Coverage should match the project, not the marketing page.
Check:
The mistake is choosing the provider with the largest coverage claim instead of the one that covers your actual query universe.
Historical depth matters when the project needs to test ideas across different market conditions.
Check:
There is a difference between “we provide historical prices” and “this dataset is deep enough for serious testing.”
This is where stock data gets annoying.
Check:
For handling the messier side of financial data (think of missing values, inconsistent fields, and format issues), the Importing & Cleaning Data in Python track covers the core techniques you'll need once the API calls are working.
Fundamentals matter when the project needs business context, not just price movement.
Check:
The key term is consistency. If you are comparing companies, fields should work across the universe without custom logic for every ticker.
Licensing is boring until it blocks the product.
Check:
I would rather find these limits before writing the pipeline than after building the frontend.
A clean API saves time after the first request.
Check:
The first successful call is not the real test. The real test is whether the API still feels clean after you add refresh jobs, error handling, and joins with other datasets.
AI workflows need predictable data access.
Check:
The API does not need to be “AI-native” for every use case. But if you are building a financial research assistant, the data layer should be easy for both Python code and AI tools to work with.
Our Codex CLI MCP tutorial shows a concrete example of this in a finance context, building a live portfolio dashboard agent using Alpha Vantage data through an MCP workflow.
The criteria above are useful, but I would not choose a provider from a checklist alone. I would test the API against the failure modes that matter for the project.
For the examples below, I’ll use Alpha Vantage because it gives us historical prices, live quote data, fundamentals, technical indicators, and AI workflow options in one place. The goal is to check whether the API can meet real project requirements without creating excessive cleanup work.
For a backtester, this is one of the first checks I would run. If a price series does not handle splits cleanly, every return calculation built on top of it becomes questionable.
The code below pulls Tesla’s daily adjusted prices around its 2022 stock split and compares raw returns with adjusted returns.
import requests
import pandas as pd
import time
api_key = 'YOUR ALPHA VANTAGE API KEY'
url = f'https://www.alphavantage.co/query?function=TIME_SERIES_DAILY_ADJUSTED&symbol=TSLA&outputsize=full&apikey={api_key}'
response = requests.get(url)
data = response.json()
tsla = pd.DataFrame(data['Time Series (Daily)']).T
tsla.index = pd.to_datetime(tsla.index)
tsla = tsla.sort_index()
tsla = tsla.rename(columns={
    '4. close': 'close',
    '5. adjusted close': 'adjusted_close',
    '7. dividend amount': 'dividend',
    '8. split coefficient': 'split'
})
cols = ['close', 'adjusted_close', 'dividend', 'split']
tsla[cols] = tsla[cols].astype(float)
tsla['raw_return'] = tsla['close'].pct_change()
tsla['adjusted_return'] = tsla['adjusted_close'].pct_change()
tsla.loc['2022-08-22':'2022-08-31', ['close', 'adjusted_close', 'split', 'raw_return', 'adjusted_return']]
Here is the output:
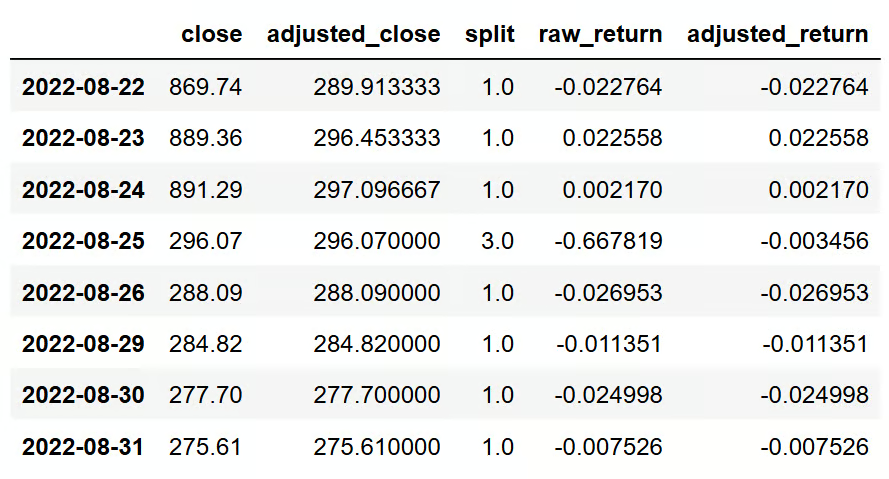
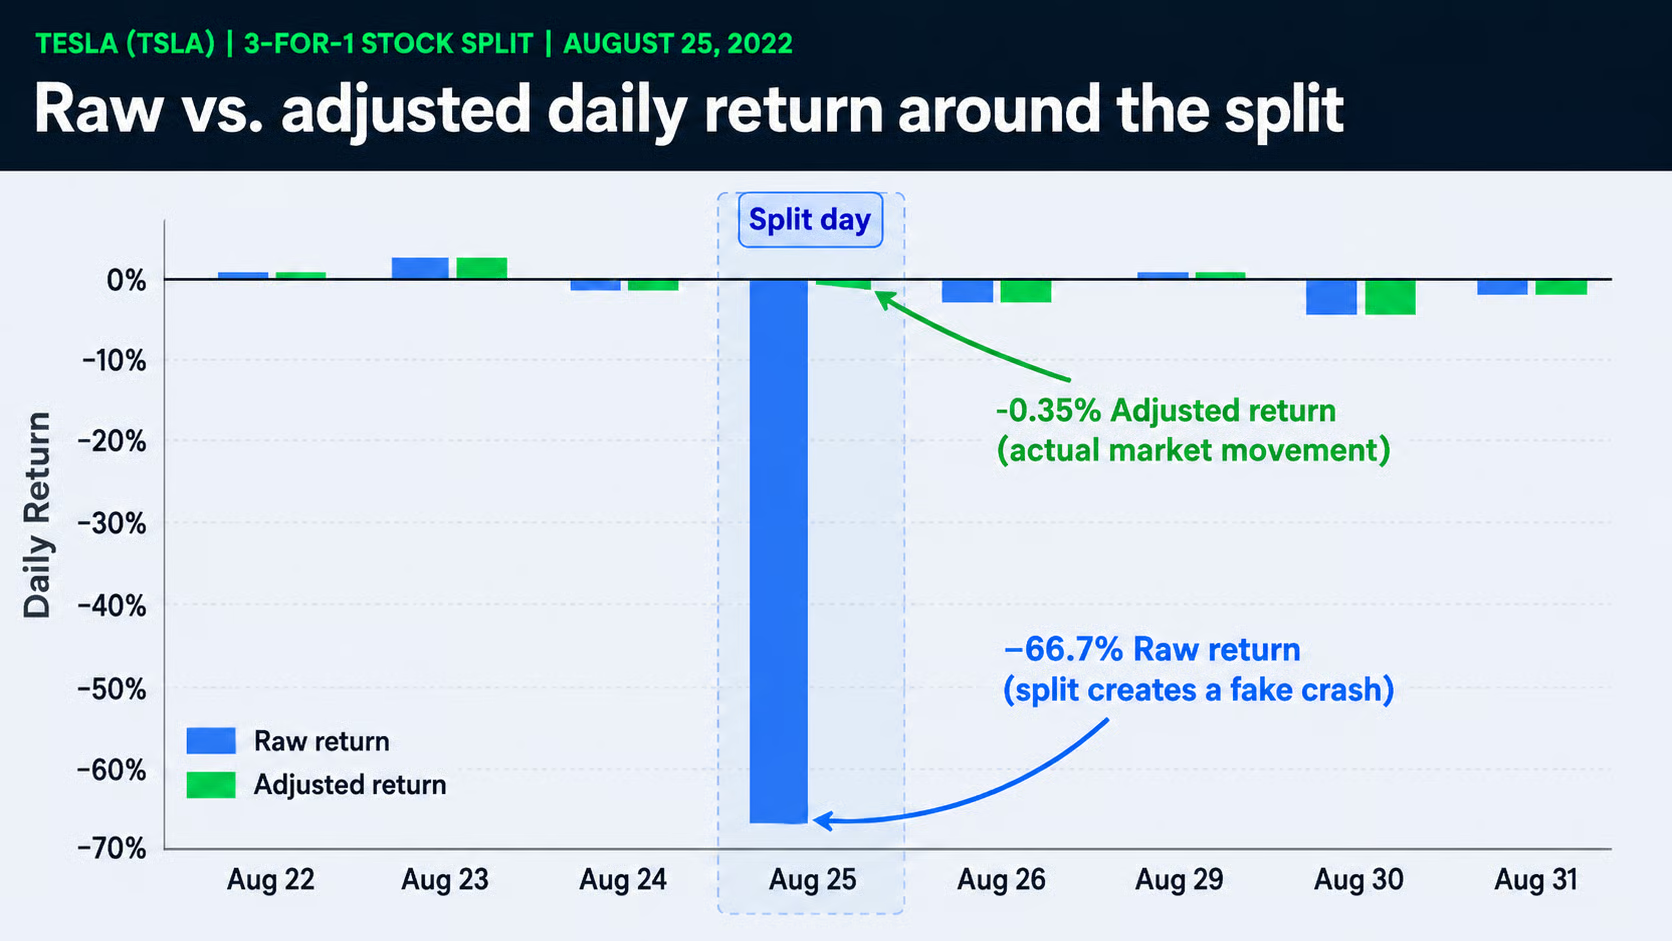
This is exactly why adjusted data matters.
The raw close suggests a 66.7% drop on August 25, 2022. That was not a real crash. It was Tesla’s 3-for-1 stock split showing up in the raw price series.
The adjusted return for the same day is only around -0.35%, which is much closer to the actual market movement after accounting for the split.
This small check tells you whether the API gives you the fields needed to catch a common backtesting problem. A long feature list cannot tell you that.
A dashboard or alert system does not only need data. It needs requests that fail clearly.
This helper adds a simple retry pattern and checks for common API response issues. It is not production infrastructure, but it is enough to test whether an API behaves predictably when something goes wrong.
def get_json(url, retries=3, wait=10):
    for i in range(retries):
        try:
            response = requests.get(url, timeout=20)
            data = response.json()
            if 'Error Message' in data:
                raise ValueError(data['Error Message'])
            if 'Note' in data:
                print('API note:', data['Note'])
                time.sleep(wait)
                continue
            if not data:
                raise ValueError('Empty response')
            return data
        except Exception as e:
            print(f'Attempt {i + 1} failed:', e)
            time.sleep(wait)
    return None
This is the kind of check I would add before trusting an API inside a dashboard or scheduled job.
The important part is not the retry count. It is whether your code can separate a bad symbol, an empty response, a rate-limit message, and a temporary request failure. If every failure looks the same, debugging becomes painful once the project has users.
For screeners, valuation tools, and AI assistants, I would test whether the API can produce a clean research object from multiple endpoints.
The example below pulls a quote and company overview for Apple, then turns the result into a compact dictionary. This is closer to what a dashboard card, screener row, or AI tool response would need.
def get_research_snapshot(symbol):
    quote_url = f'https://www.alphavantage.co/query?function=GLOBAL_QUOTE&symbol={symbol}&apikey={api_key}'
    overview_url = f'https://www.alphavantage.co/query?function=OVERVIEW&symbol={symbol}&apikey={api_key}'
    quote_data = get_json(quote_url)
    overview = get_json(overview_url)
    quote = quote_data.get('Global Quote', {}) if quote_data else {}
    price = quote.get('05. price')
    eps = overview.get('EPS') if overview else None
    pe_check = None
    if price and eps:
        pe_check = float(price) / float(eps)
    return {
        'symbol': symbol,
        'price': price,
        'latest_trading_day': quote.get('07. latest trading day'),
        'volume': quote.get('06. volume'),
        'sector': overview.get('Sector') if overview else None,
        'market_cap': overview.get('MarketCapitalization') if overview else None,
        'pe_ratio_api': overview.get('PERatio') if overview else None,
        'pe_ratio_check': pe_check,
        'profit_margin': overview.get('ProfitMargin') if overview else None
    }
snapshot = get_research_snapshot('AAPL')
snapshot
The output looks like this:
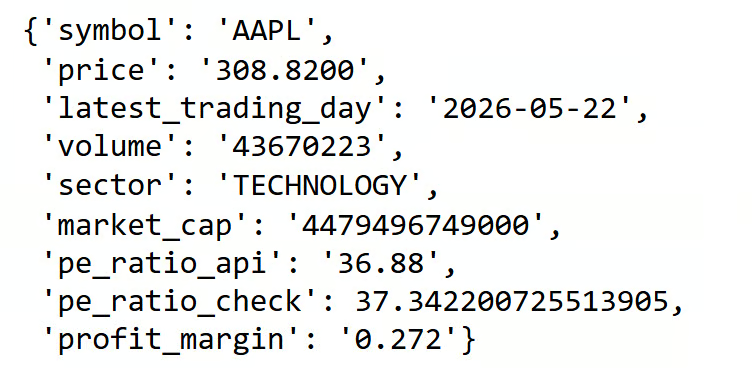
The API’s reported PE ratio and our simple price-to-EPS calculation are not identical, which is normal because providers may use different timing conventions or adjusted inputs. But the comparison is still useful because it tells us whether the fields are directionally usable.
This test is not only useful for backtesting:
That last point matters. MCP or tool calling does not magically fix messy data. The API still needs to return fields that can be turned into a predictable object. If every endpoint requires custom cleanup, the agent workflow will quickly become fragile.
The practical test is simple: can you pull the data, validate it, calculate a basic metric, and return something another part of the system can use? If yes, the API is much closer to being useful beyond the first notebook.
Now we can put the workflow and evaluation criteria together.
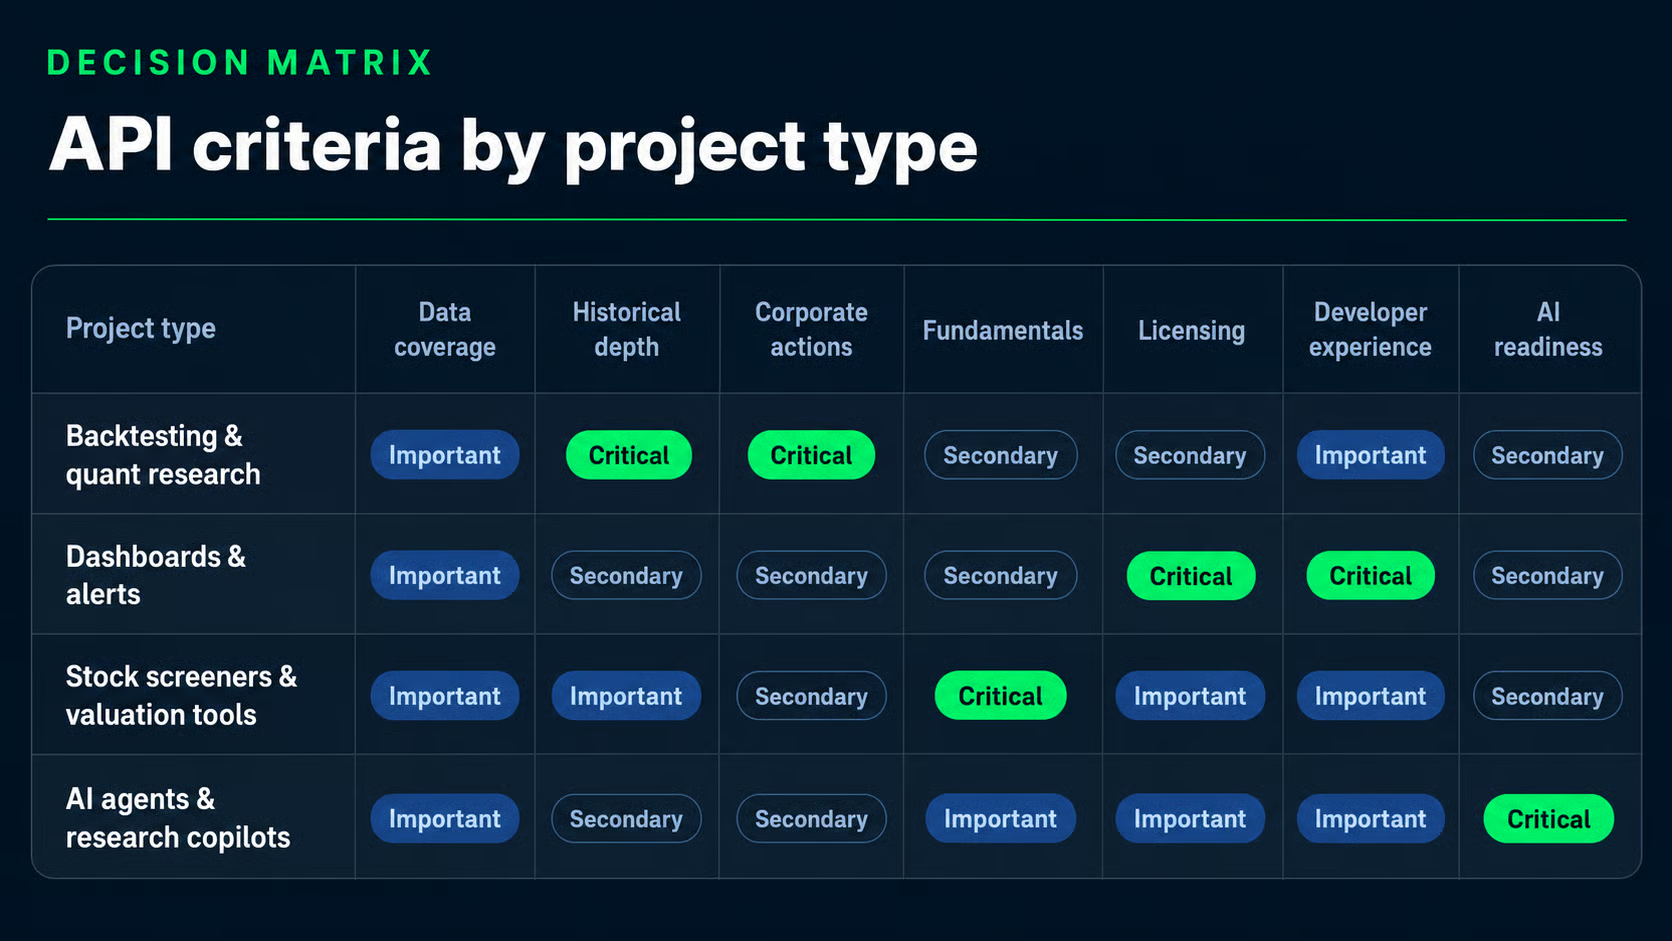
The point of this matrix is not to rank providers. It is to help you decide which criteria deserve the most attention for the project you are building.
|
Project Type |
Most Important Criteria |
Secondary Criteria |
Provider Fit To Consider |
|
Backtesting and quant research |
Historical depth, adjusted prices, and corporate actions |
AI readiness, licensing |
Alpha Vantage for broad historical and indicator workflows; EODHD for global EOD research |
|
Dashboards and alerts |
Licensing, response developer experience, rate limits |
Historical depth, fundamentals |
QuoteMedia for developer-friendly dashboards; Xignite for enterprise financial apps |
|
Stock screeners and valuation tools |
Fundamentals, company metadata, ratios, and financial statements |
Historical depth, symbol coverage |
Alpha Vantage for broad fundamentals and price workflows; Intrinio for US fundamentals-heavy tools |
|
AI agents and research copilots |
Structured responses, tool access, and MCP readiness |
Fundamentals, indicators, licensing |
Alpha Vantage for MCP and broad API coverage |
This table is deliberately imperfect. Real projects rarely fit into one row, and most serious products combine more than one workflow.
For a backtester, I would start with historical depth and corporate actions before worrying about live quotes.
The key question is not, “Can I fetch price history?” It is, “Can I trust this price history across splits, dividends, missing dates, and long market regimes?”
For this workflow, check:
Real-time data can matter later if you move toward live monitoring or execution. For historical research, it should not be the first priority.
For an AI assistant, the API has to be easy for both code and the model to work with.
A human developer can inspect a messy JSON response and fix the parsing logic. An agent workflow is less forgiving. If the schema is unpredictable, the model may call the right tool but still struggle to use the result.
For this workflow, check:
The broader point is simple: choose the API based on the failure mode you can least afford. A backtester fails when the history is wrong. A dashboard fails when users cannot get fresh responses. An AI assistant fails when the data access layer is too messy to use.
There is no single best stock API for every project. The right choice depends on what your system needs to do: historical depth for backtesting, freshness for dashboards, fundamentals for screeners, and structured responses for AI workflows.
This is also why Alpha Vantage was a versatile API to use throughout the examples in this article. It covers several of the layers we discussed, including market data, fundamentals, technical indicators, and MCP-based AI workflows, so it lets us test more than one decision factor without switching providers.
I would treat a stock API as part of the project’s data infrastructure, not just a collection of endpoints. It affects your code, database, refresh jobs, model inputs, user experience, and even what you can show in the final product.
If you are keen to build stronger finance workflows in Python, I recommend starting with our Python for Finance course.
Learn Financial Analysis in Python with DataCamp!
Course
Course
Course
blog
Kurtis Pykes
10 мин
Tutorial
Oluseye Jeremiah
Tutorial
Karlijn Willems
Tutorial
Thushan Ganegedara
Tutorial
Patrick David
code-along
Chris Ramakers