
Track
AWS Cloud Practitioner (CLF-C02)
10 hr
Amazon QuickSight is a cloud-native business intelligence (BI) service that enables organizations to visualize, analyze, and share data at scale.
It is designed for modern data teams (including analysts, data scientists, and business intelligence professionals) that want to leverage AWS for data-driven decision-making.
When I first started working with cloud-based analytics platforms, I was searching for a solution that could scale, integrate with my AWS ecosystem, and deliver visualizations without server management overhead. This is when I found out about Amazon QuickSight, and it transformed how I approached dashboard creation and real-time analytics.
In this guide, I will show you how to use Amazon QuickSight to create compelling dashboards, accelerate query performance using SPICE, embed interactive reports, and implement advanced machine learning insights.
> For a foundational understanding of similar cloud-based visualization tools, explore the Introduction to Tableau course.
QuickSight is part of Amazon’s broader AWS ecosystem, which offers a serverless, scalable solution for business intelligence needs.
It enables you to easily connect to multiple data sources, perform analysis, and present findings via interactive dashboards.
Amazon QuickSight offers the following features that differentiate it from legacy BI platforms and even newer cloud-based competitors.
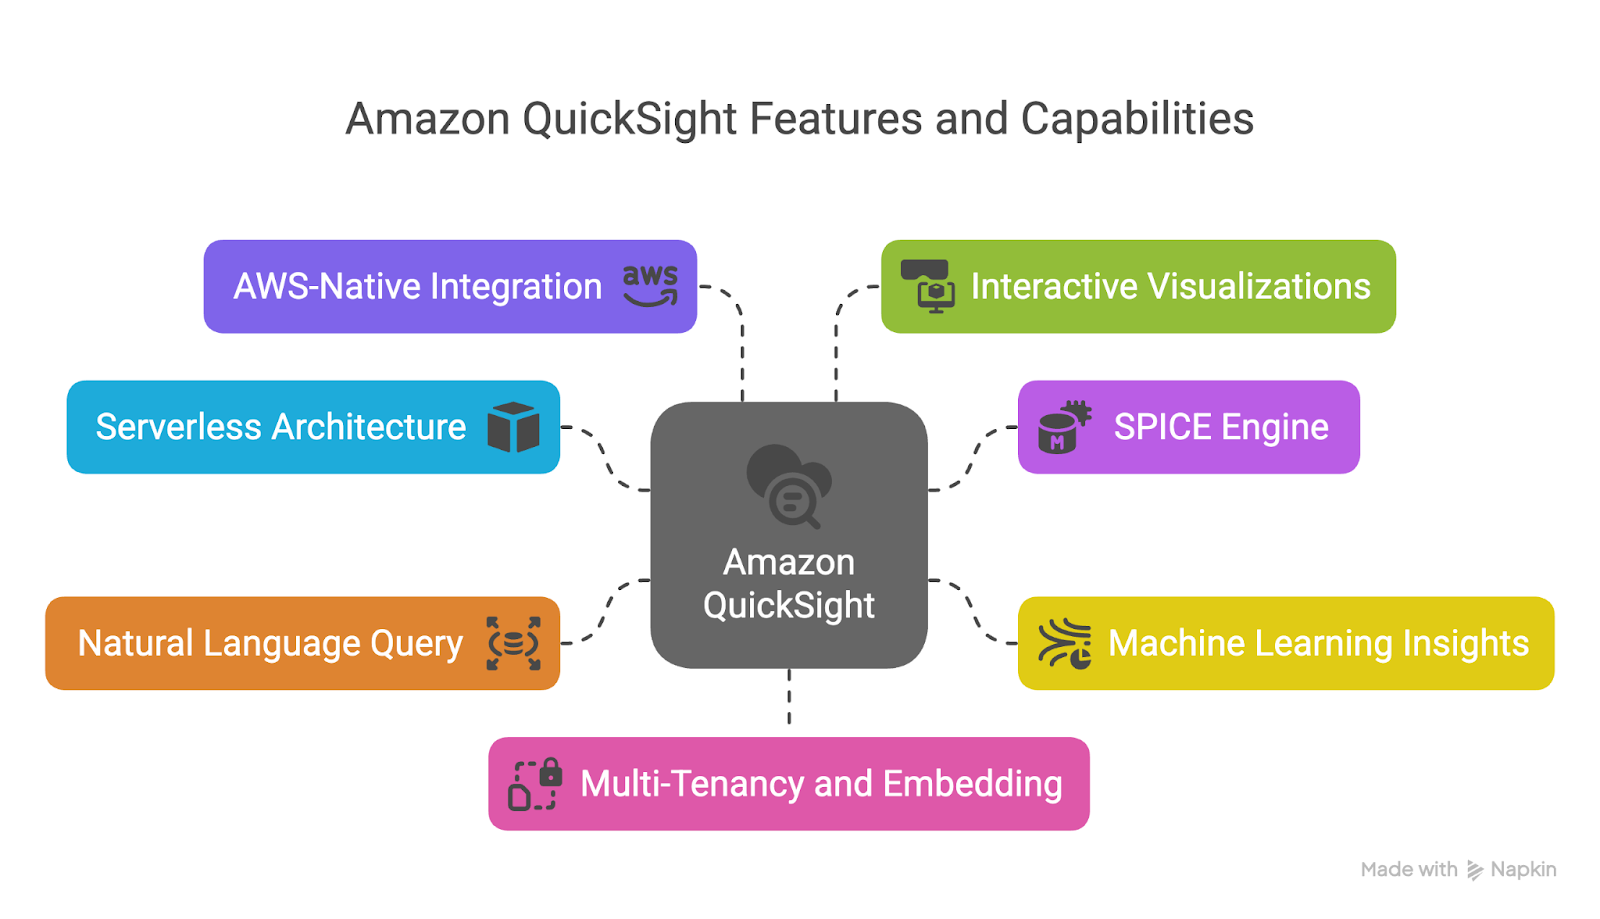
Image detailing the key features of QuickSight. Created using Napkin AI
QuickSight is a fully managed service. This means there are no servers to deploy, maintain, or scale.
It automatically adjusts to your demand, which allows you to avoid the complexity and cost of manual provisioning and capacity planning.
SPICE (Super-fast, Parallel, In-memory Calculation Engine) is QuickSight’s proprietary in-memory engine that allows you to perform fast, interactive analysis.
It preloads and compresses data for faster querying and enables caching for frequently accessed datasets.
SPICE supports millions of rows with high concurrency, ensuring low latency across dashboards and reports.
QuickSight includes built-in machine learning capabilities that allow you to detect anomalies, generate forecasts, and summarize dashboards automatically.
These features are accessible directly from the UI and do not require you to build, train, or deploy models themselves.
For example, anomaly detection highlights unusual patterns in your data with visual cues, while ML-powered forecasting can project future metrics based on historical trends.
With the Q feature, you can ask questions in plain English, such as “What were the top-performing regions last quarter?” and get immediate visual responses.
This opens up data access and reduces dependency on technical teams, making self-service BI a reality for non-technical stakeholders.
As part of AWS, QuickSight integrates with services like:
This tight integration simplifies data connectivity and lets you build end-to-end analytics pipelines within the AWS ecosystem.
QuickSight supports a wide variety of visuals, including bar charts, line graphs, heat maps, geospatial maps, and KPI visuals.
You can build interactive dashboards with filters, parameters, and drill-downs that help uncover insights.
QuickSight enables the creation of multi-tenant dashboards that are securely shared with different user groups.
It also allows embedding into web and mobile applications using the JavaScript SDK or APIs, which is ideal for SaaS providers and internal business applications.
> To learn more about cloud-based architectures and services that support tools like QuickSight, check out the AWS Cloud Technology and Services course.
QuickSight also provides value for business intelligence teams by addressing several challenges, which include the following.
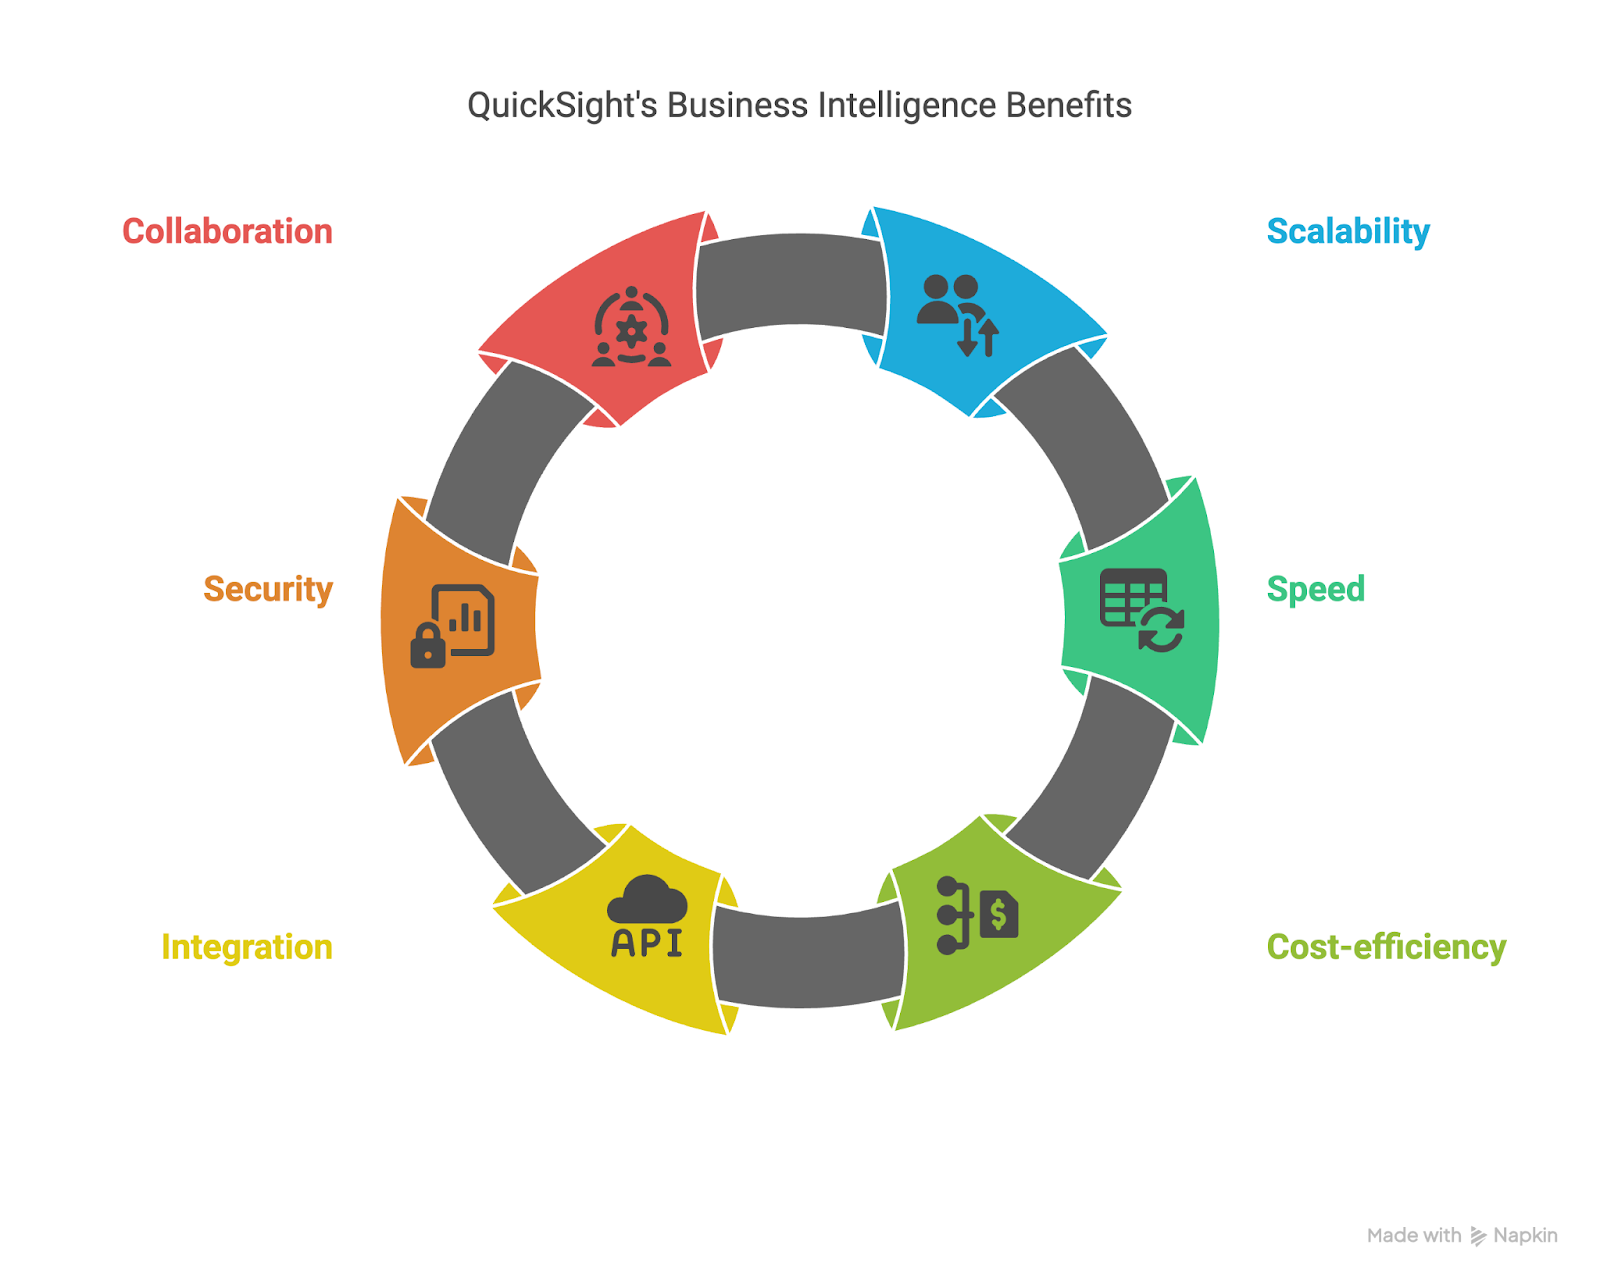
Image detailing the benefits of QuickSight for business intelligence. Created using Napkin AI
Traditional BI tools often struggle to support thousands of users concurrently without significant infrastructure investment.
QuickSight's serverless model allows organizations to scale analytics to thousands of users without the burden of infrastructure management.
Because SPICE stores data in memory, dashboards and visualizations return results in sub-seconds, even with millions of rows of data.
This responsiveness is crucial for enabling real-time decision-making and maintaining user engagement.
QuickSight’s pay-per-session pricing means that organizations only pay when dashboards are actually viewed. For more predictable usage, a capacity-based pricing model is also available.
These options allow you to optimize costs based on usage patterns and team needs.
Because it integrates so well with AWS services, QuickSight reduces the need for complex ETL processes.
Analysts can query live data directly from Redshift, Athena, or RDS, or work with imported datasets through SPICE, all within the same interface.
QuickSight supports granular data access controls through AWS Identity and Access Management (IAM), row-level and column-level security, and encryption at rest and in transit.
Integration with AWS CloudTrail ensures auditability and compliance with regulatory standards.
QuickSight makes it easy to share dashboards across teams, set access permissions, and allow business users to explore data on their own using filters, drill-downs, and NLQ.
This promotes a data-driven culture without overwhelming IT or analytics teams.
QuickSight is especially well-suited for organizations that are already using AWS and want to extend their analytics capabilities without adopting separate platforms.
> If you are new to Redshift, which is a common QuickSight data source, have a look at the Introduction to Redshift course for a detailed walkthrough.
Before creating dashboards, you need to set up your QuickSight environment and familiarize yourself with the interface.
To start using Amazon QuickSight, follow these steps:
Go to the AWS Management Console.
Once you are in, select the AWS region where your data sources are located. This is important for latency, compliance, and integration purposes.
Regions supported by QuickSight include US East (N. Virginia), US West (Oregon), and EU (Ireland). These regions could change in the future.
The image below provides a screenshot of the AWS Management Console, showing the available AWS regions.
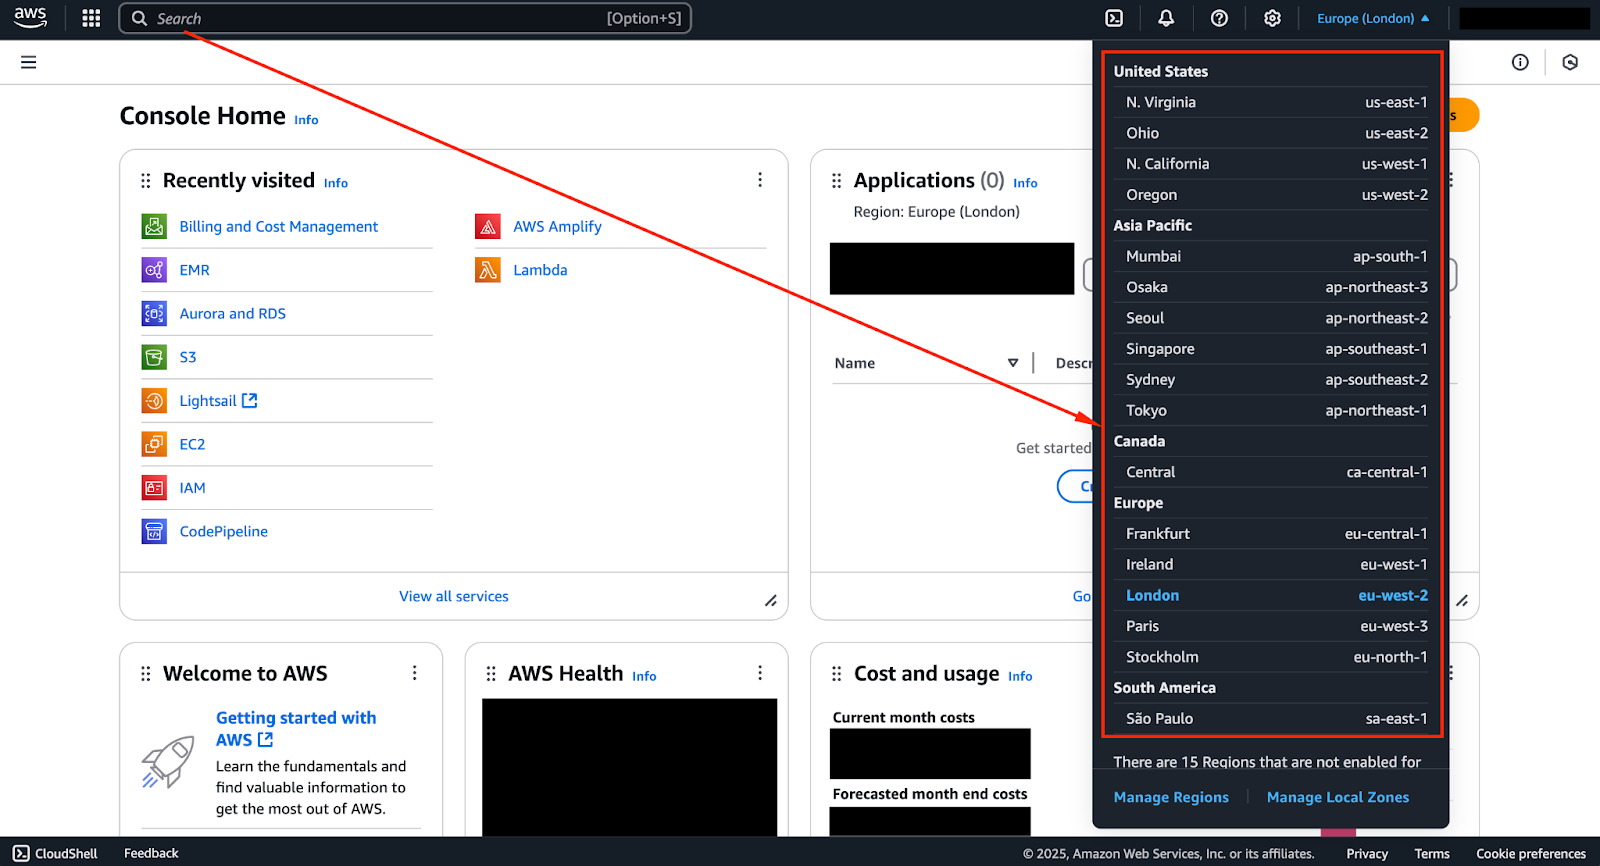
Screenshot of the AWS Management Console showing the available AWS Regions.
In the search bar, type “QuickSight” and select it from the results.
The image below shows a screenshot of the AWS Management Console with “QuickSight” entered in the search bar.
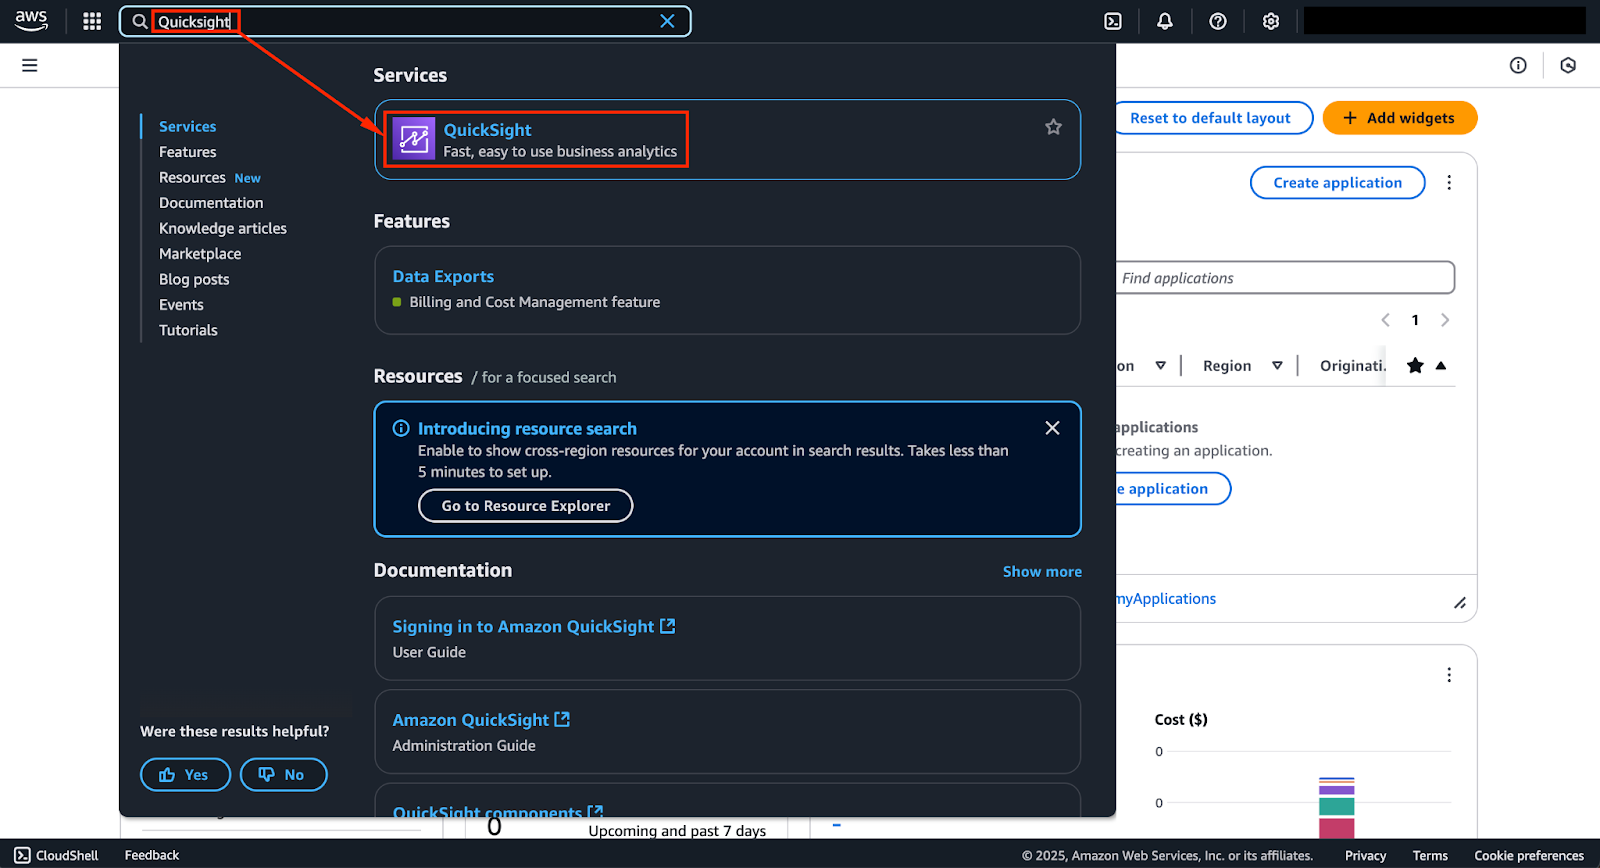
Screenshot of the AWS Management Console with 'QuickSight' entered in the search bar at the top.
Click on “QuickSight” to navigate to the service page.
Once you are on the page, click the “Sign up for QuickSight” button if it is your first time using the service.
The image below shows a screenshot of the QuickSight console with the sign-up page.
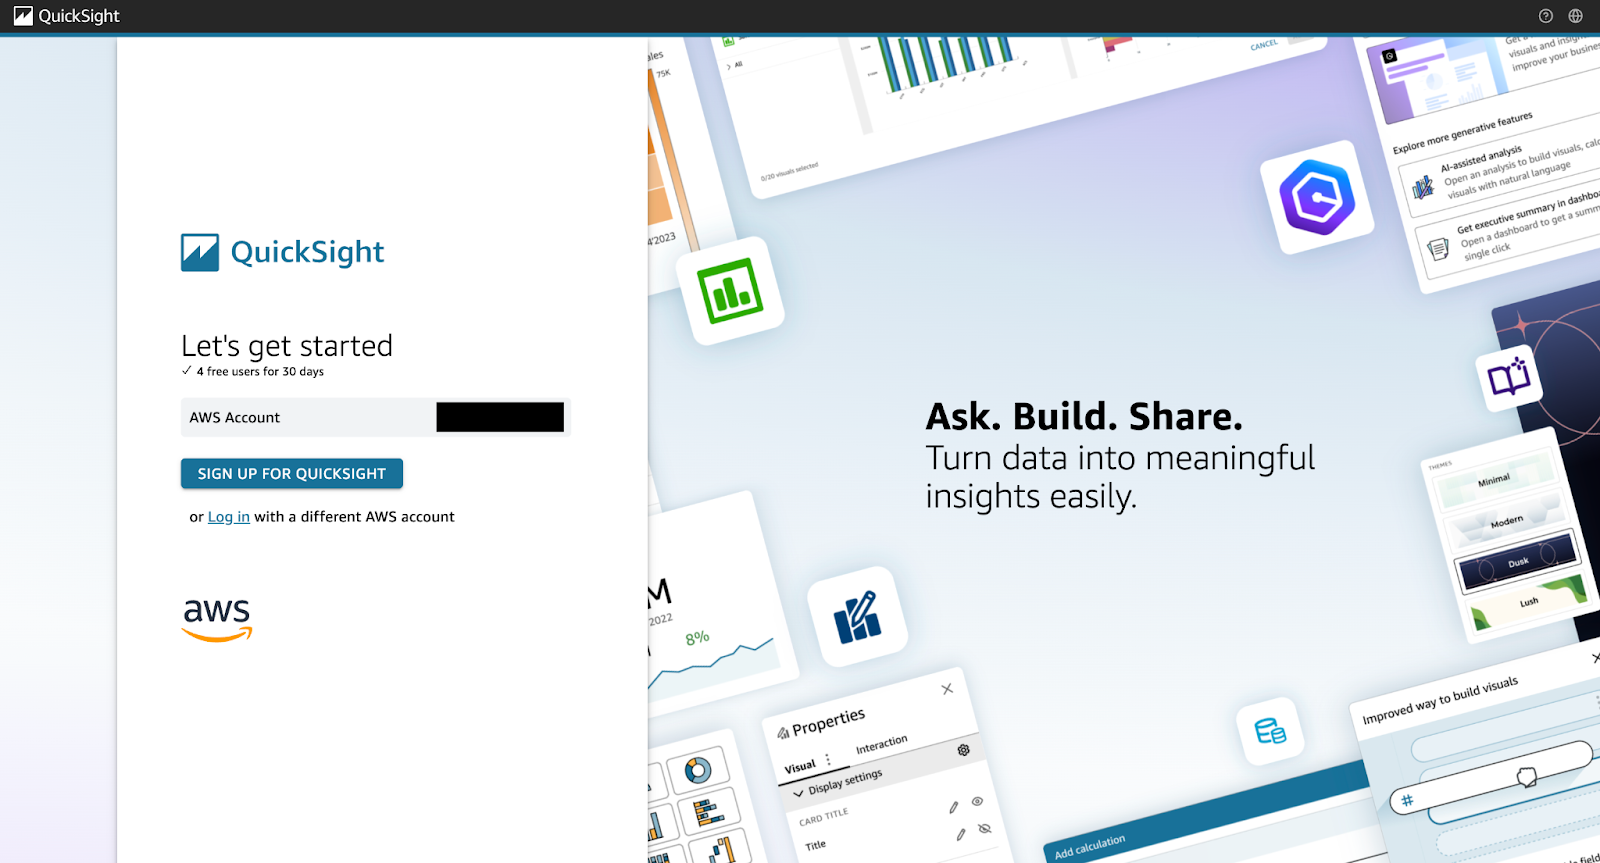
Screenshot of the QuickSight console showing the sign-up page.
The images below show additional steps in the sign-up process.
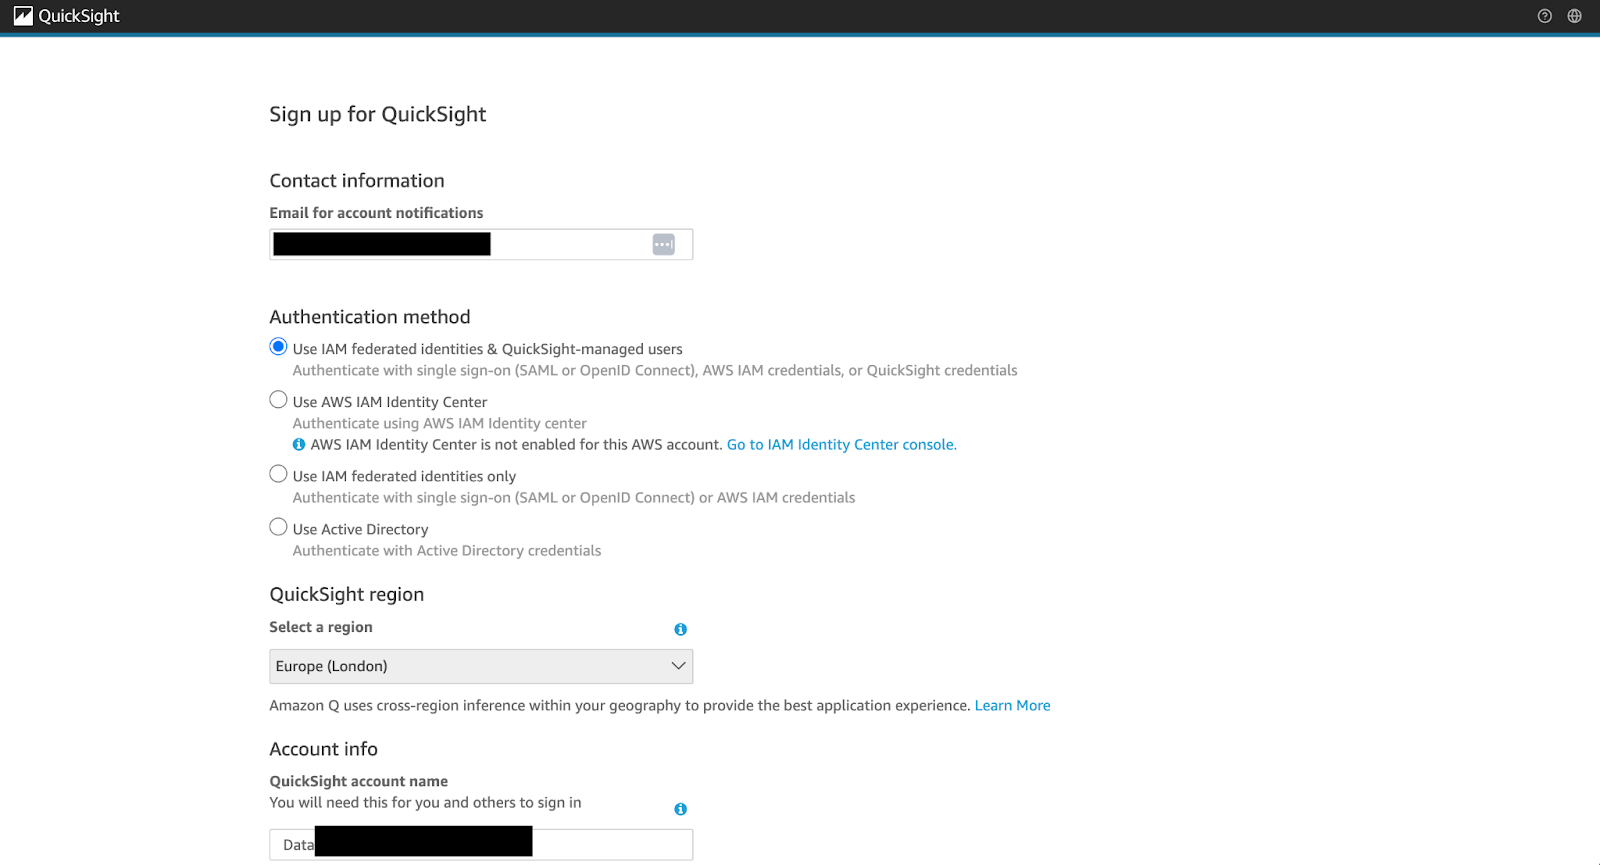
Screenshot of the QuickSight console showing the sign-up process (part 01).
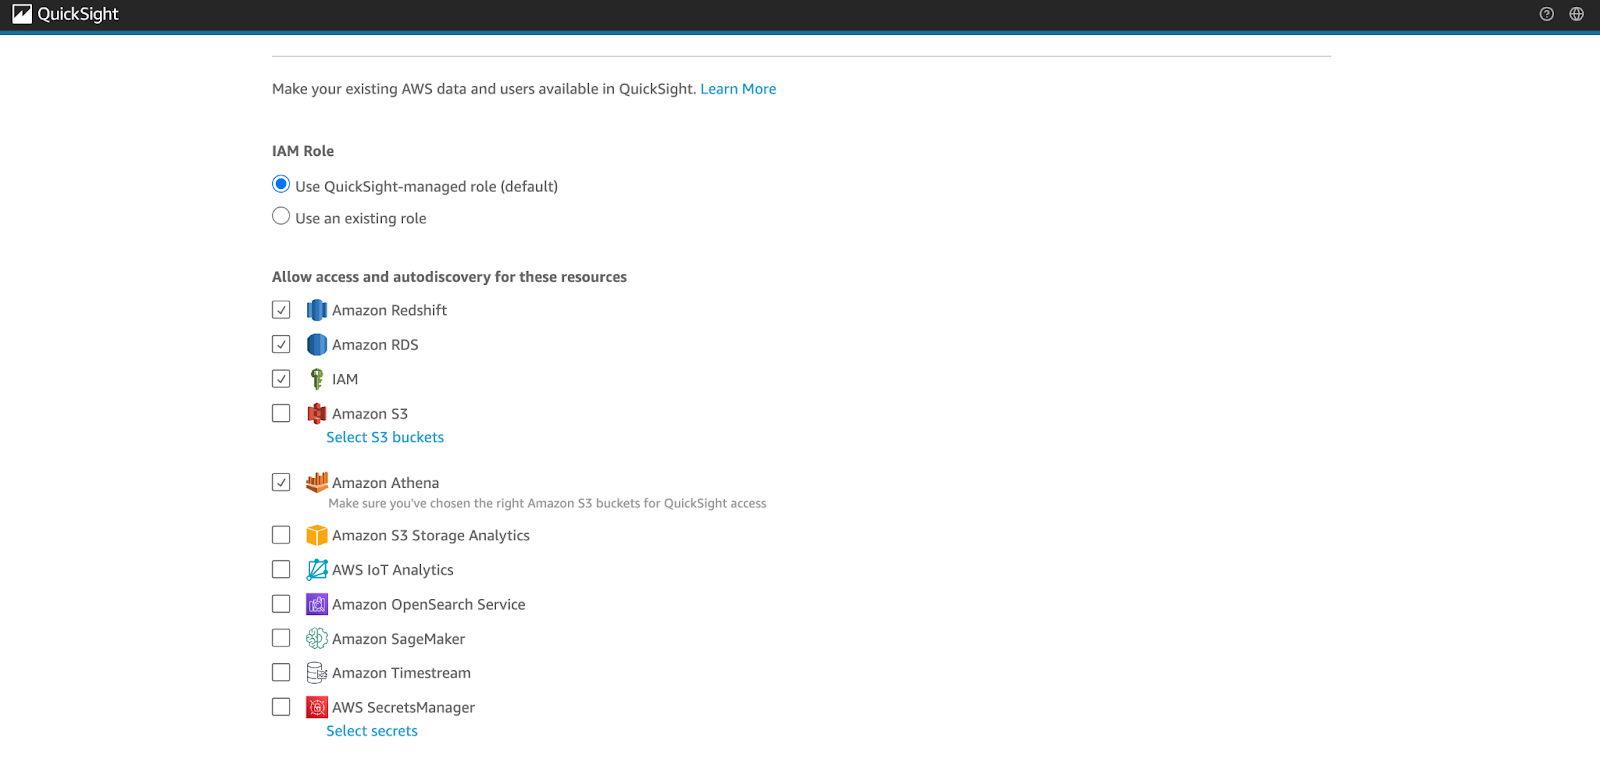
Screenshot of the QuickSight console showing the sign-up process (part 02).
You will then be asked to:
You will also need to set up permissions to access your AWS resources.
Use AWS Identity and Access Management (IAM) to configure permissions.
Under “Manage QuickSight,” navigate to the Users tab.
Invite users by email and assign them roles:
You are now ready to explore the QuickSight UI.
A key area to become familiar with is the Navigation Pane (left sidebar), which serves as your command center for accessing core features:
The image below shows the QuickSight console, showing the most important options within the navigation pane.
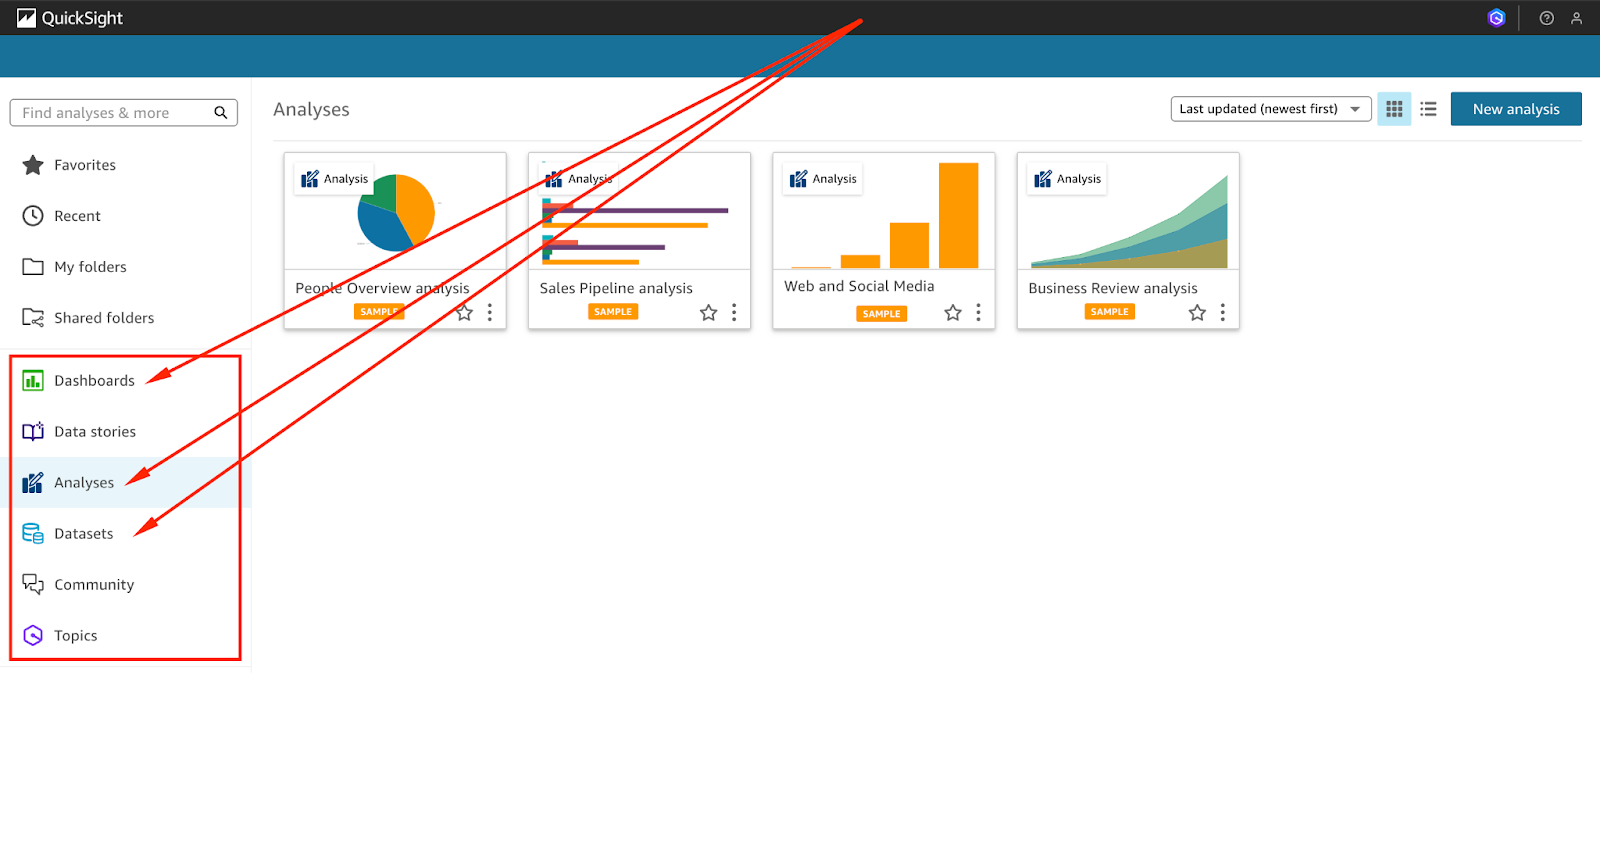
Screenshot of the QuickSight console showing the most important options within the navigation pane.
The core power of Amazon QuickSight lies in its ability to transform raw data into visually intuitive, actionable insights.
Before you can build meaningful charts and reports, it is important to ensure that your dataset is clean, accurate, and well-structured.
Amazon QuickSight provides built-in tools for basic data preparation and transformation, allowing you to shape your data before analysis.
Navigate to the “Datasets” section and click “New Dataset.” From here, you can either:
QuickSight supports a variety of data source options, including:
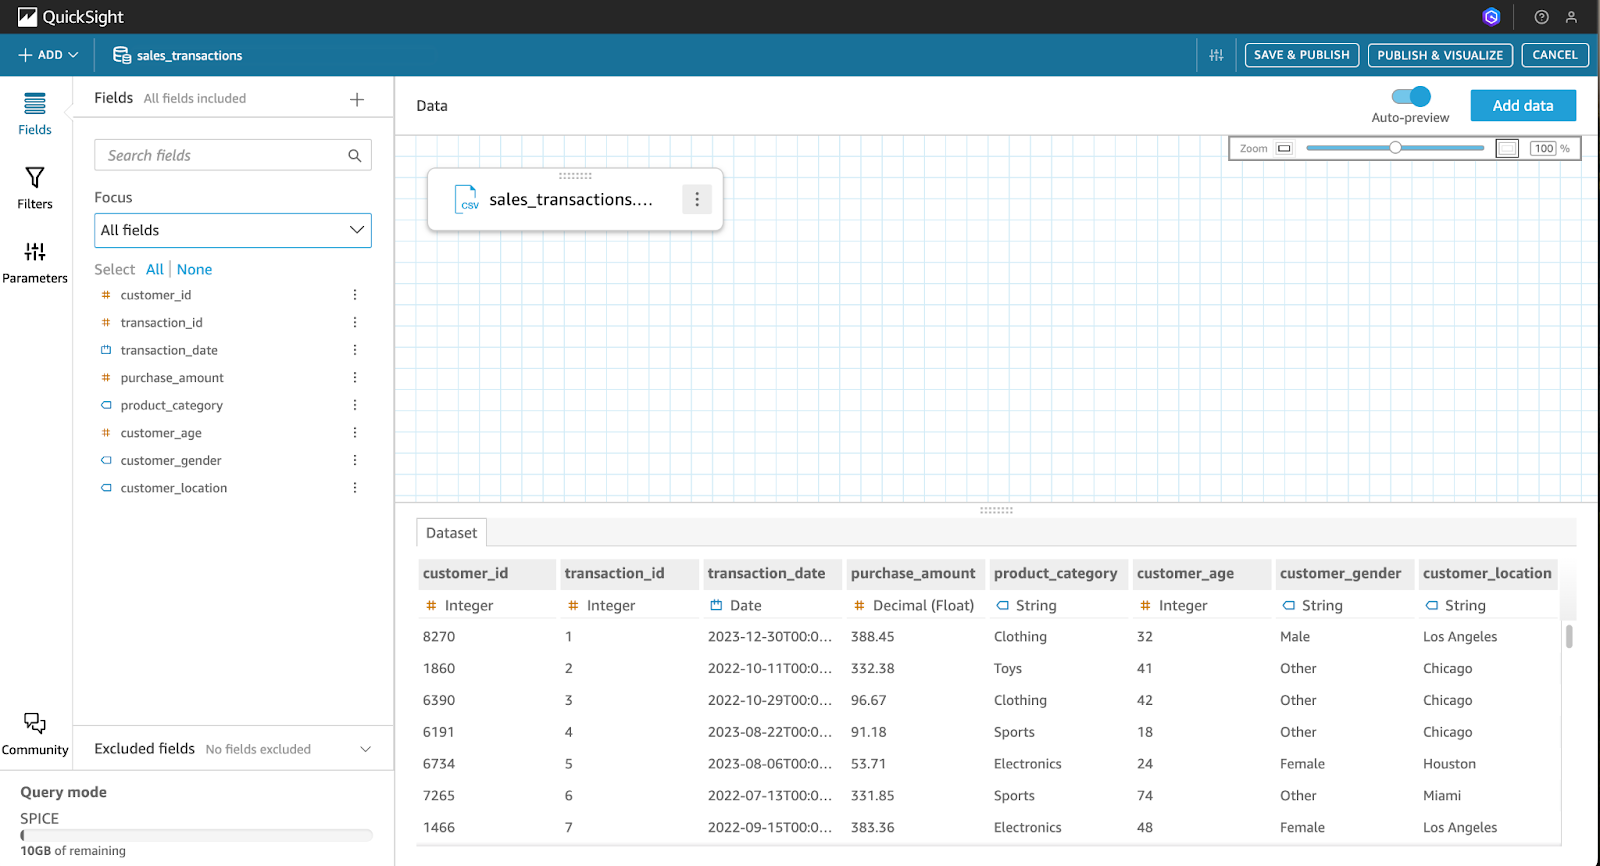
The four images below take you through the process of locating the “Datasets” tab, exploring import options, and finally, viewing a dataset once it has been successfully imported:
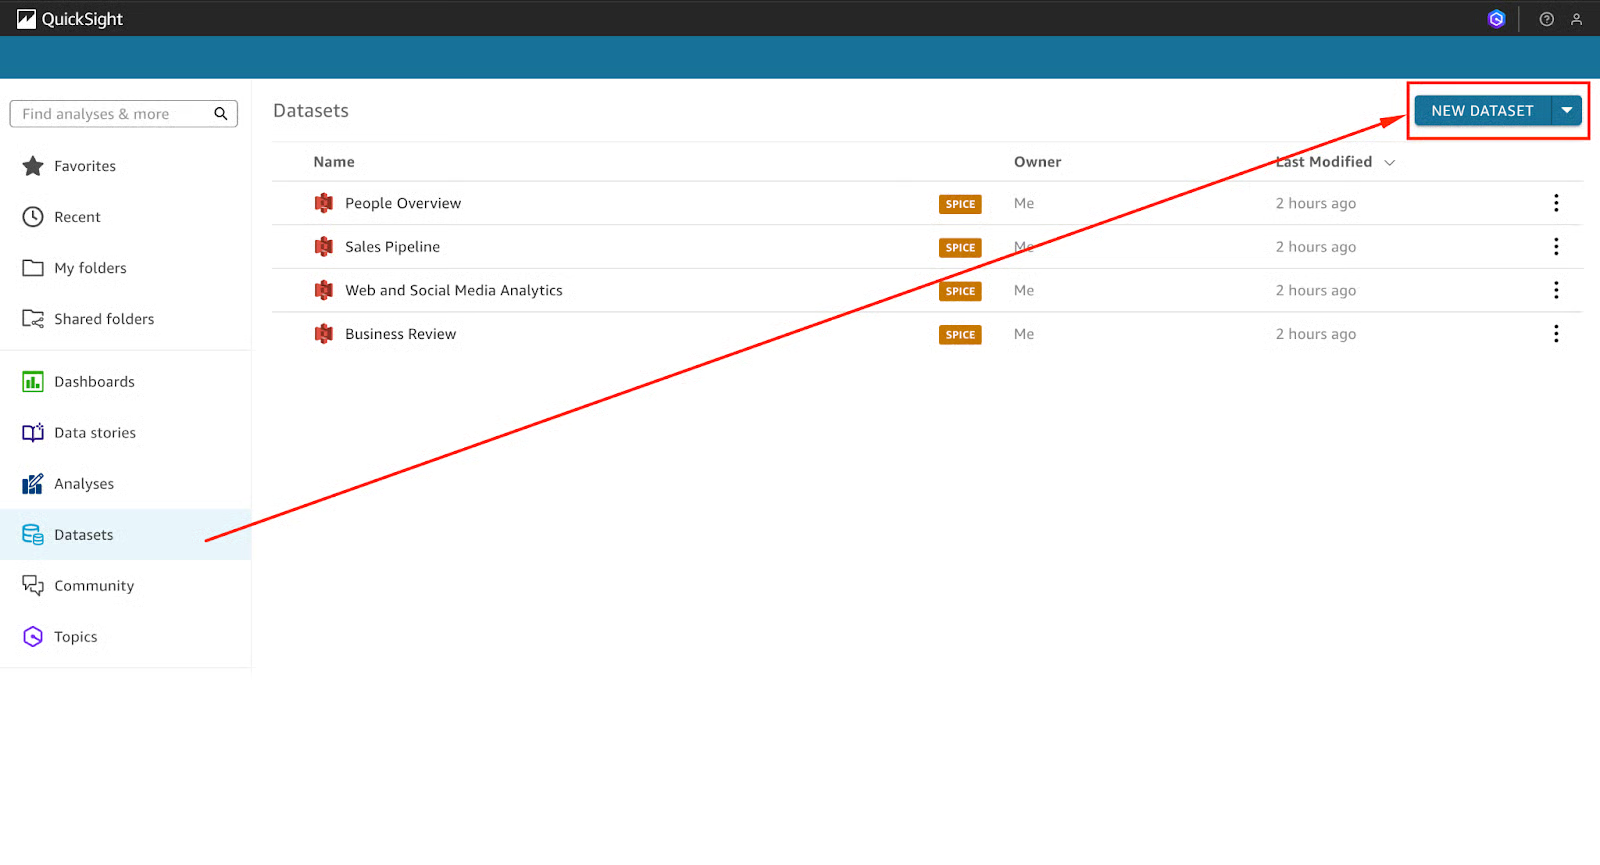
Screenshot of the QuickSight console showing the ‘Datasets’ tab.
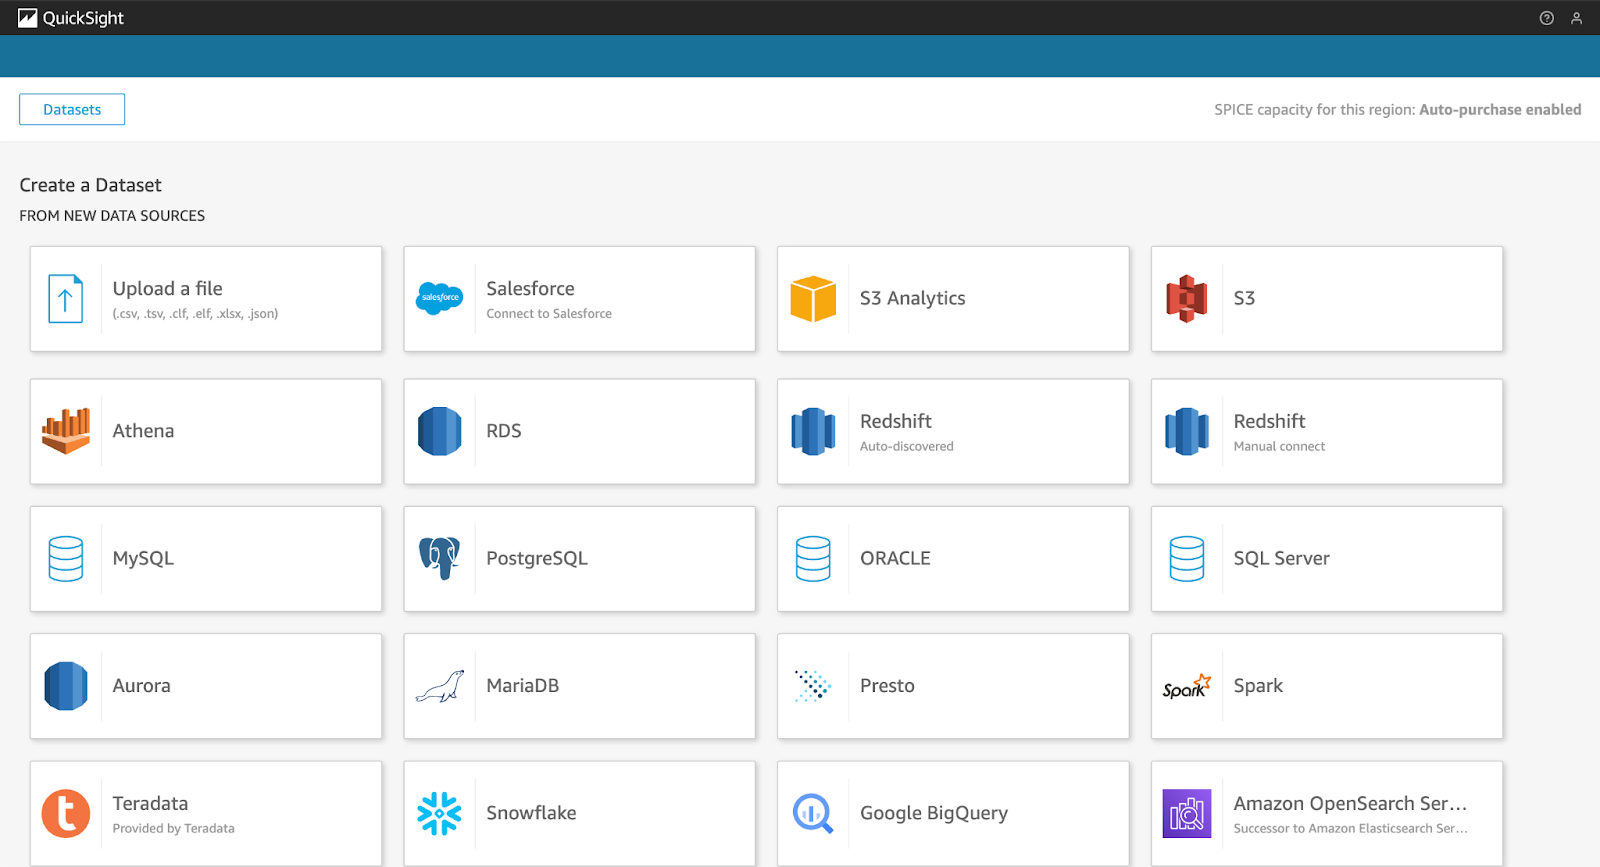
Screenshot of the QuickSight console showing the datasets import options available (part 01).
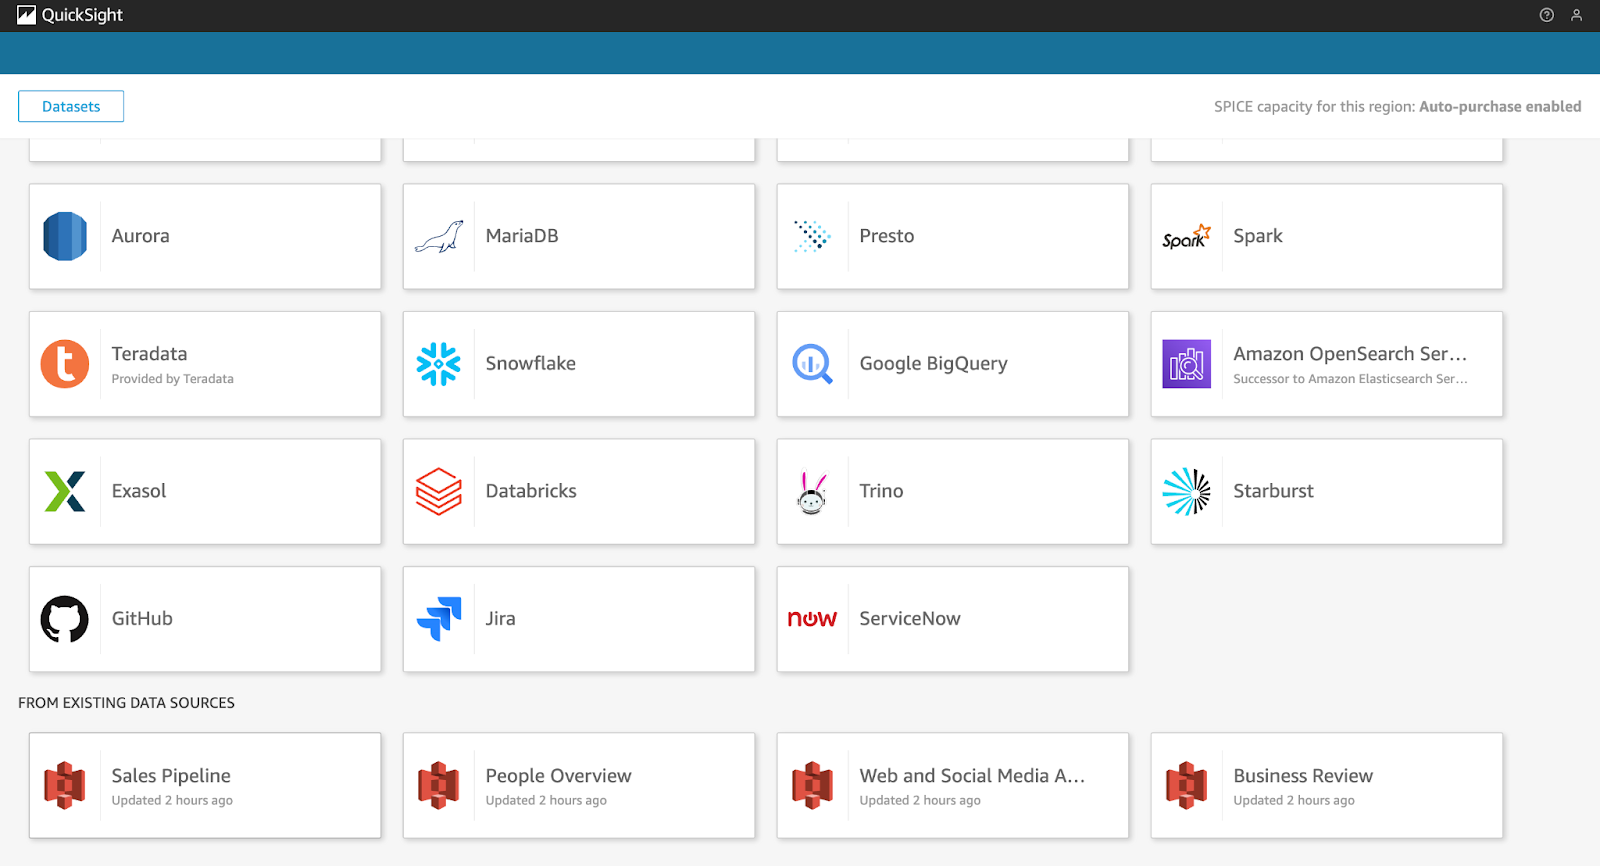
Screenshot of the QuickSight console showing the datasets import options available (part 02).
Screenshot of the QuickSight console showing the view once a dataset has been imported.
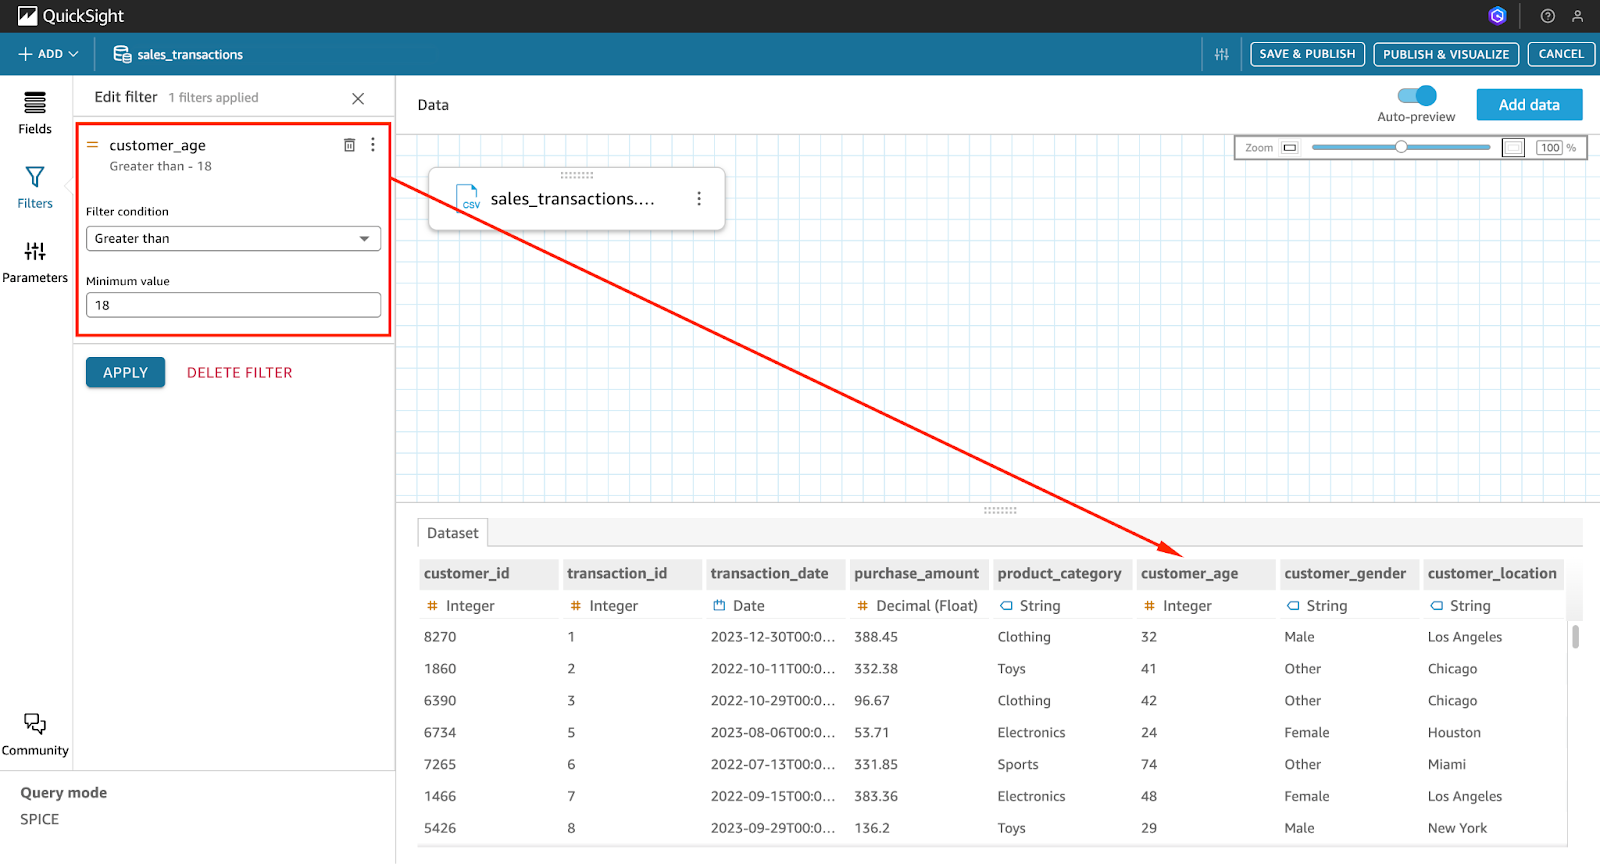
QuickSight allows you to carry out limited transformations during dataset creation. These transformations include:
You can also enhance your dataset with calculated fields, filters, and simple logic to derive new insights from your data.
Here is an example:
You can create a calculated field to categorize sales values into two groups:
ifelse({sales} > 1000, "High", "Low")This formula creates a new column that classifies each record as "High" or "Low" based on sales volume.
QuickSight provides a preview of your data after any transformation. You can use this to confirm that values, labels, and formats align with your goals.
Once your data looks correct, click Save & Visualize to move into the analysis interface.
The images below show the process of importing a dataset from a CSV file and reviewing it in the data preparation stage:
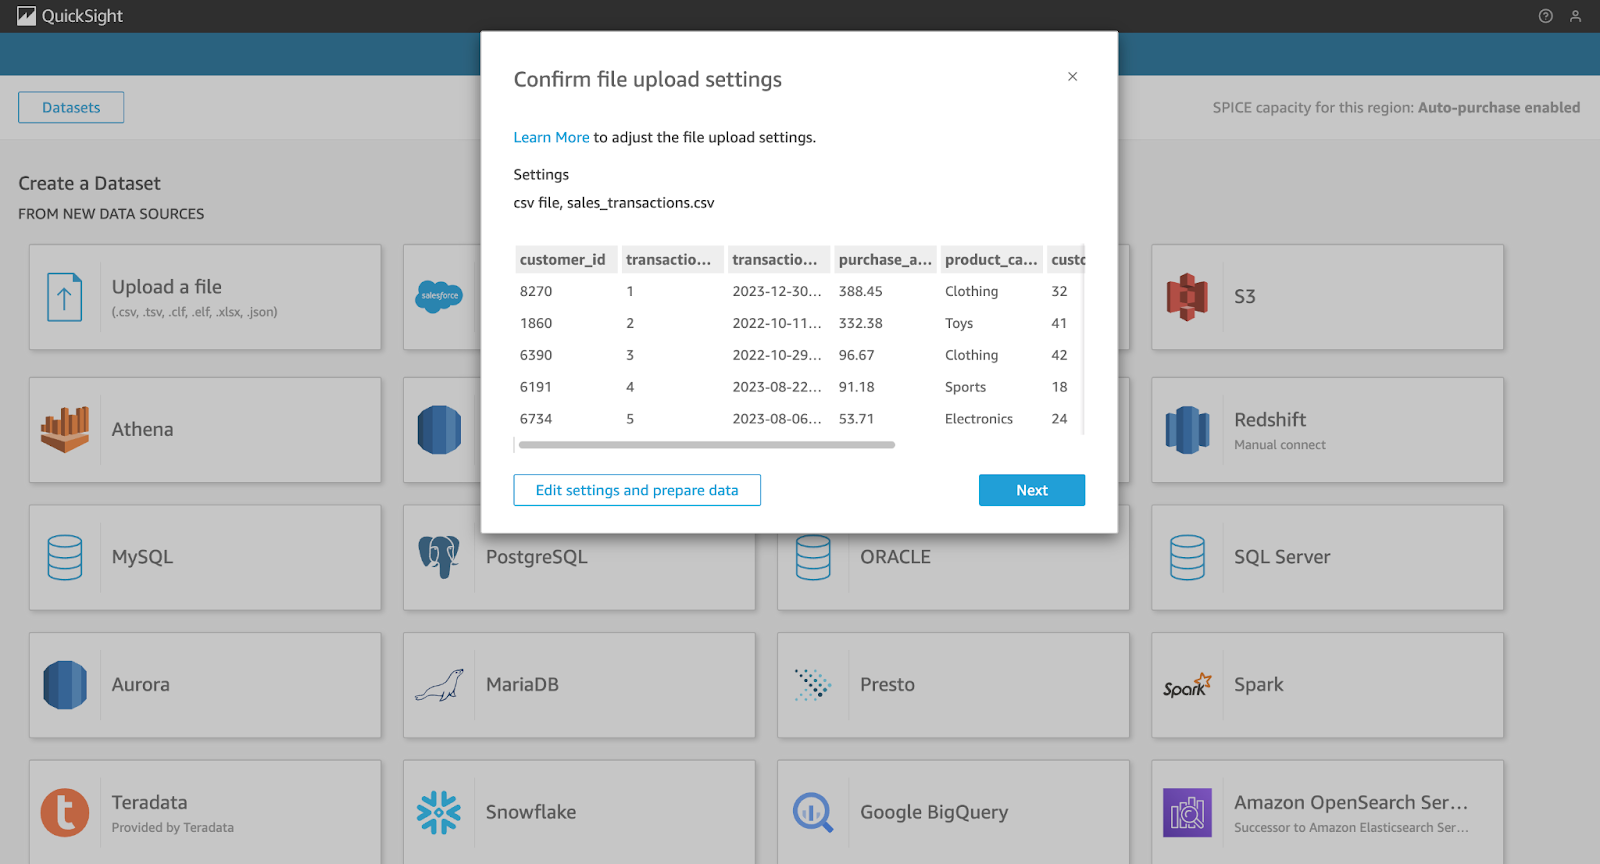
Screenshot of the QuickSight console showing the process of importing a dataset from a CSV (part 01).
Screenshot of the QuickSight console showing the process of importing a dataset from a CSV (part 02).
Screenshot of the QuickSight console showing the process of importing a dataset from a CSV (part 03).
After your dataset is prepared and validated, you can begin creating your first QuickSight dashboard.
Here is how to get started:
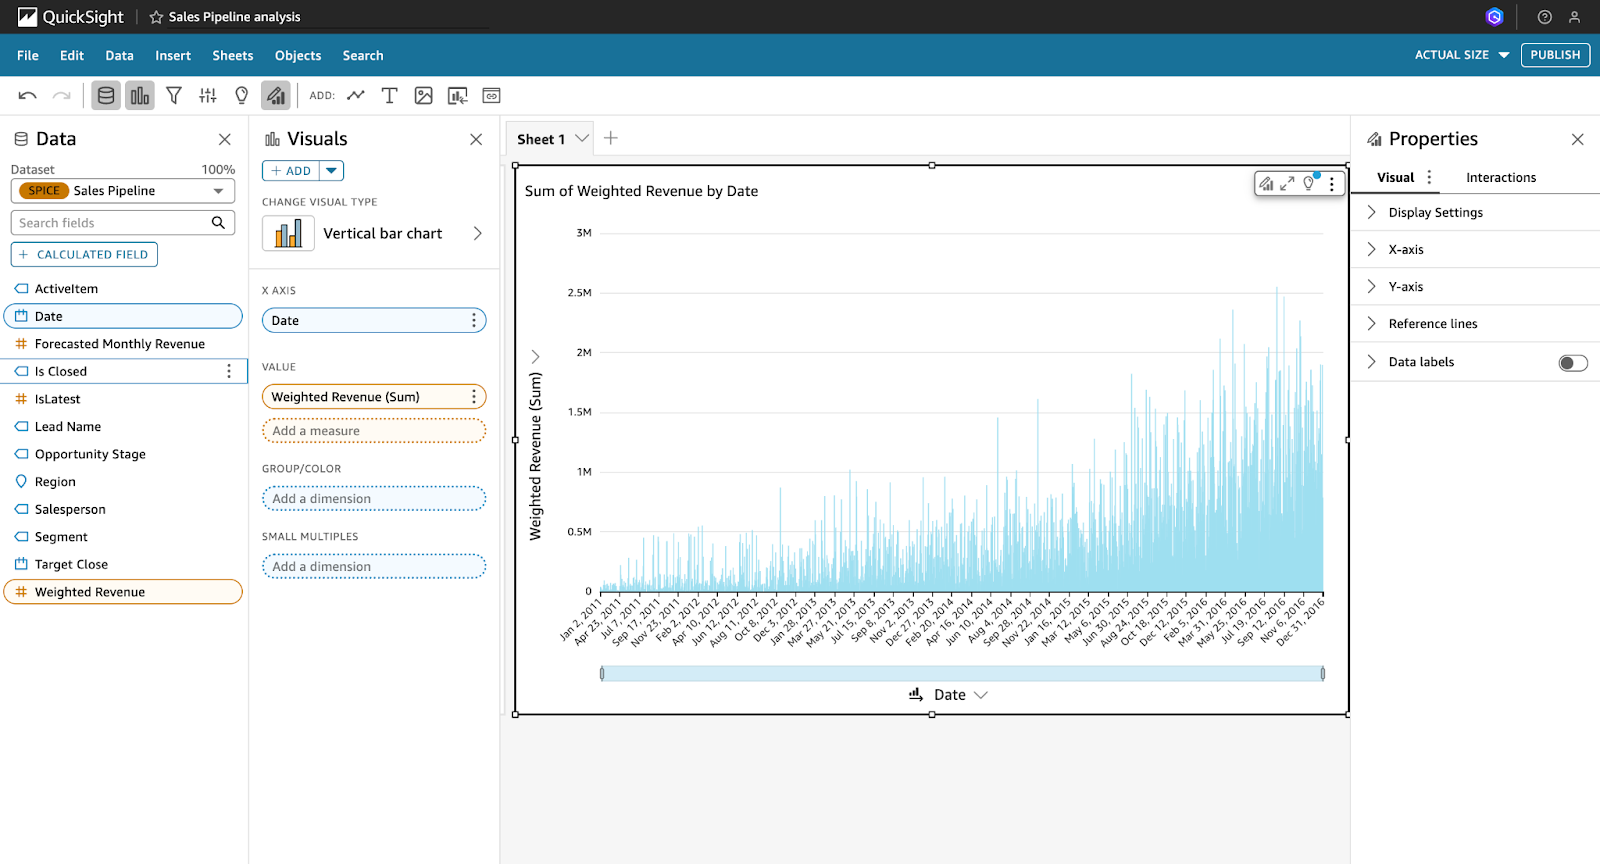
Navigate to the Analyses section, click New Analysis, and select the dataset you just created or imported.
The image below shows the Analyses tab, where you begin a new analysis.
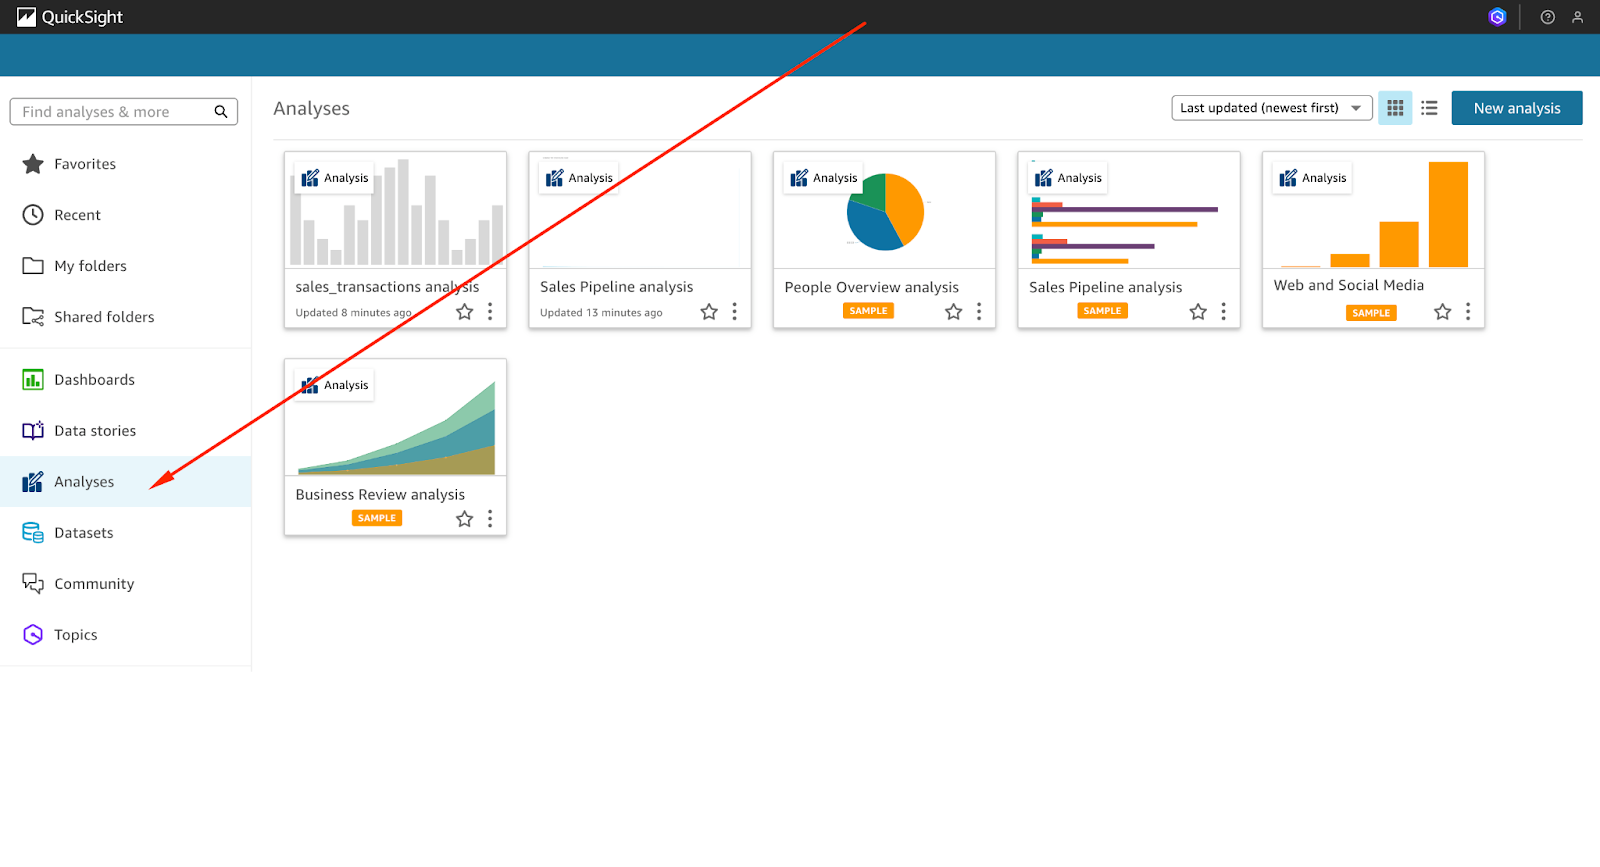
Screenshot of the QuickSight console showing the ‘Analyses’ tab.
Click Add, then Add Visual to insert a new chart into your analysis.
Choose from a wide variety of visual types:
The image below shows where to access visual options within the analysis interface.
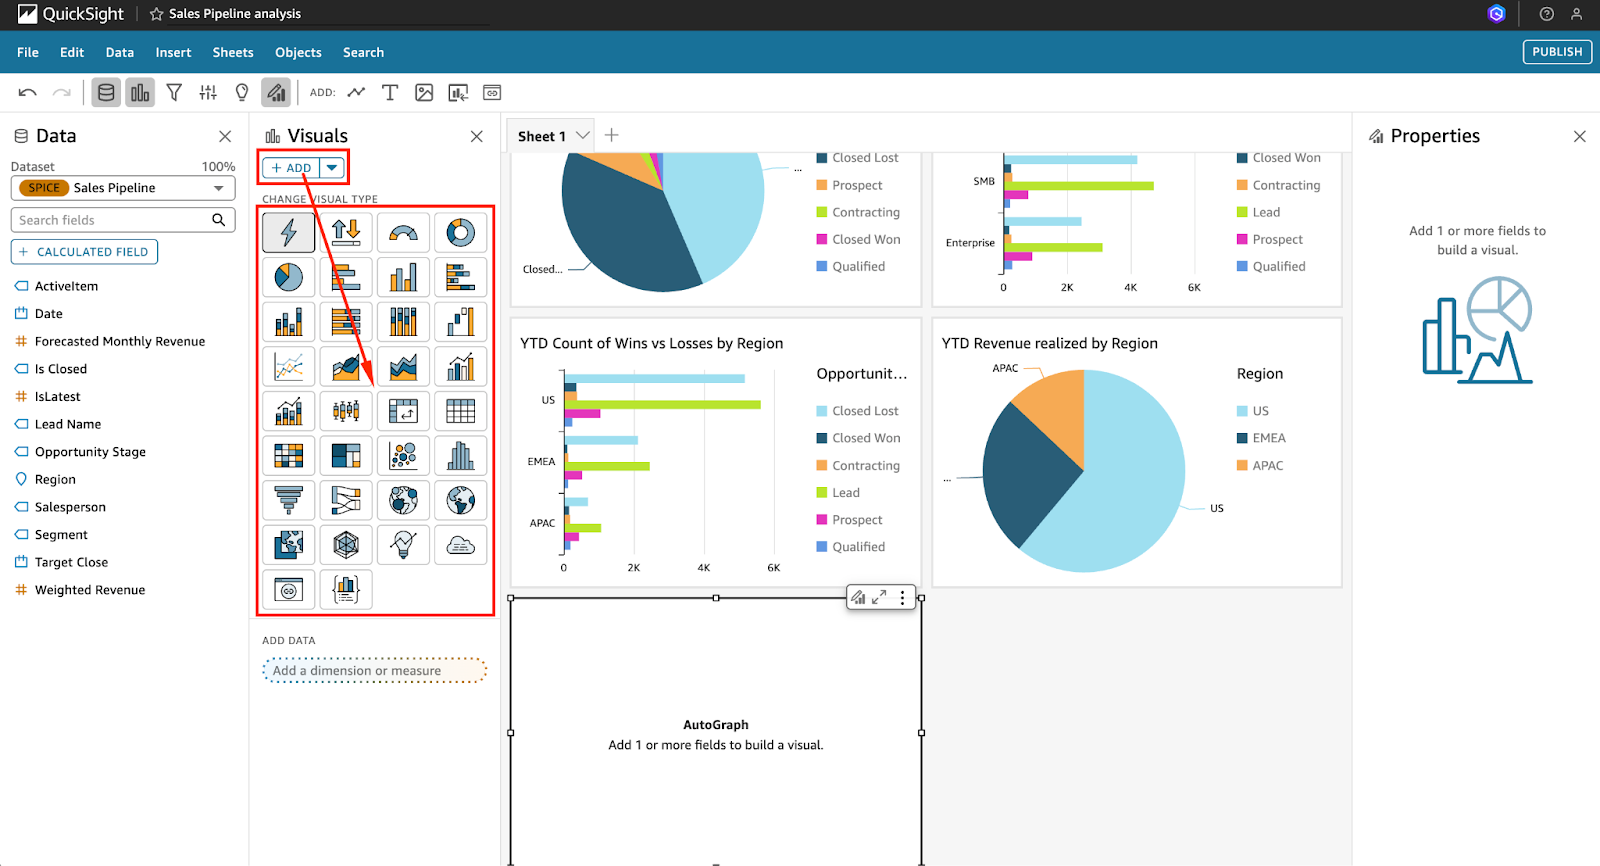
Screenshot of the QuickSight console showing the option to add visuals within the ‘Analyses’ tab.
To configure the visual, you can drag fields to the appropriate zones:
You can also use ‘filters’ to focus on a subset of the data (e.g., a specific region, time range, or category) and sort results by field or value to surface trends and outliers.
To customize your dashboard, click Format Visual. You can then:
You can use “Auto-Narratives” to auto-generate insights in natural language.
You can also enable built-in ML features like “Anomaly Detection” and “Forecasting” to add predictive elements to your dashboard without building a model.
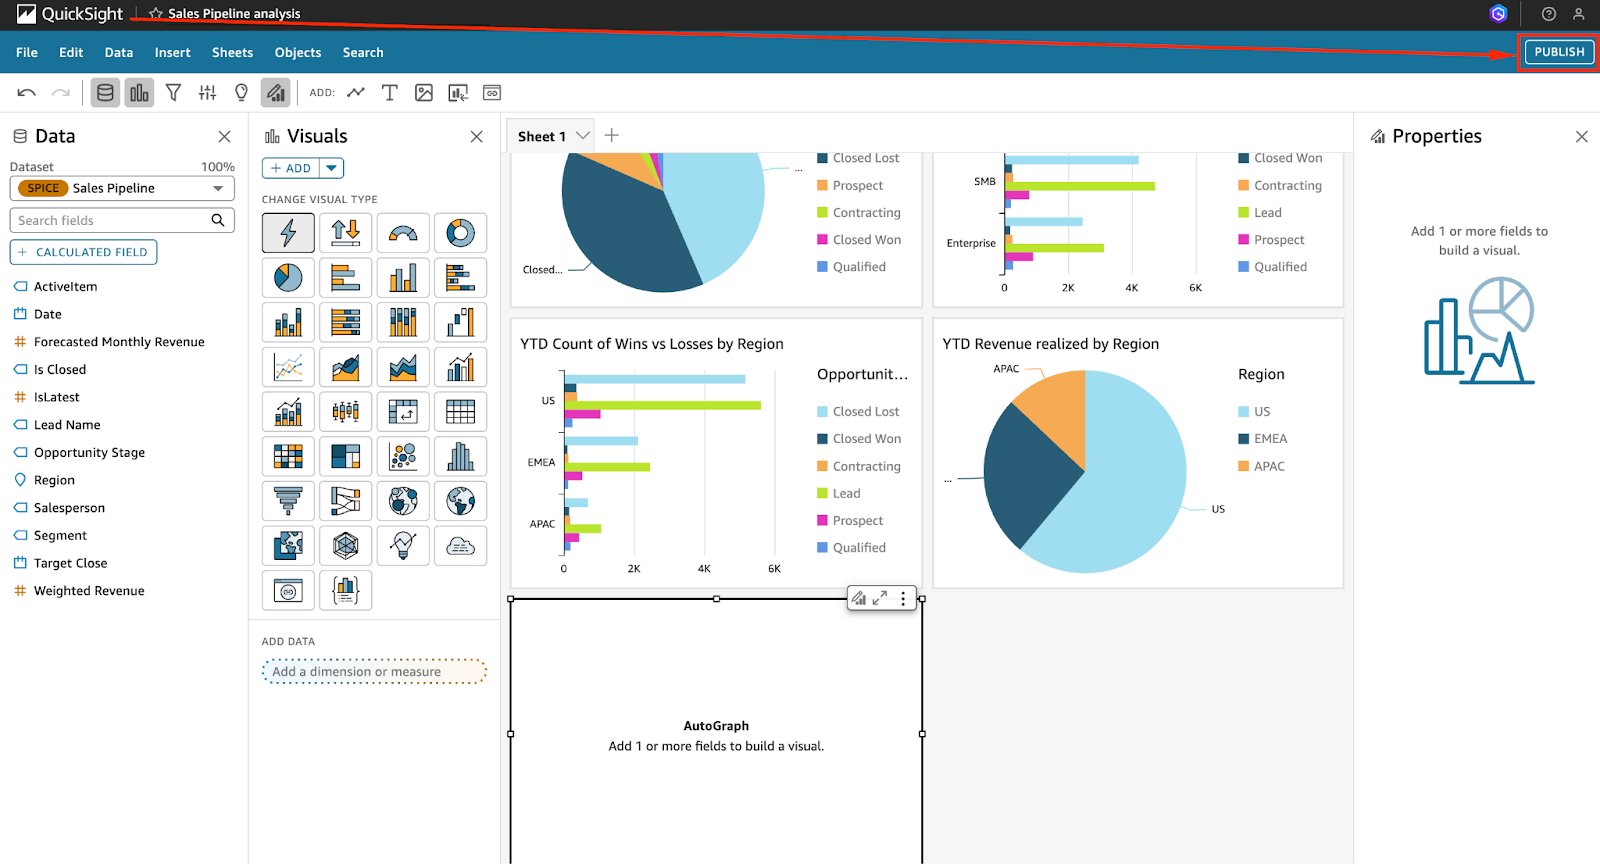
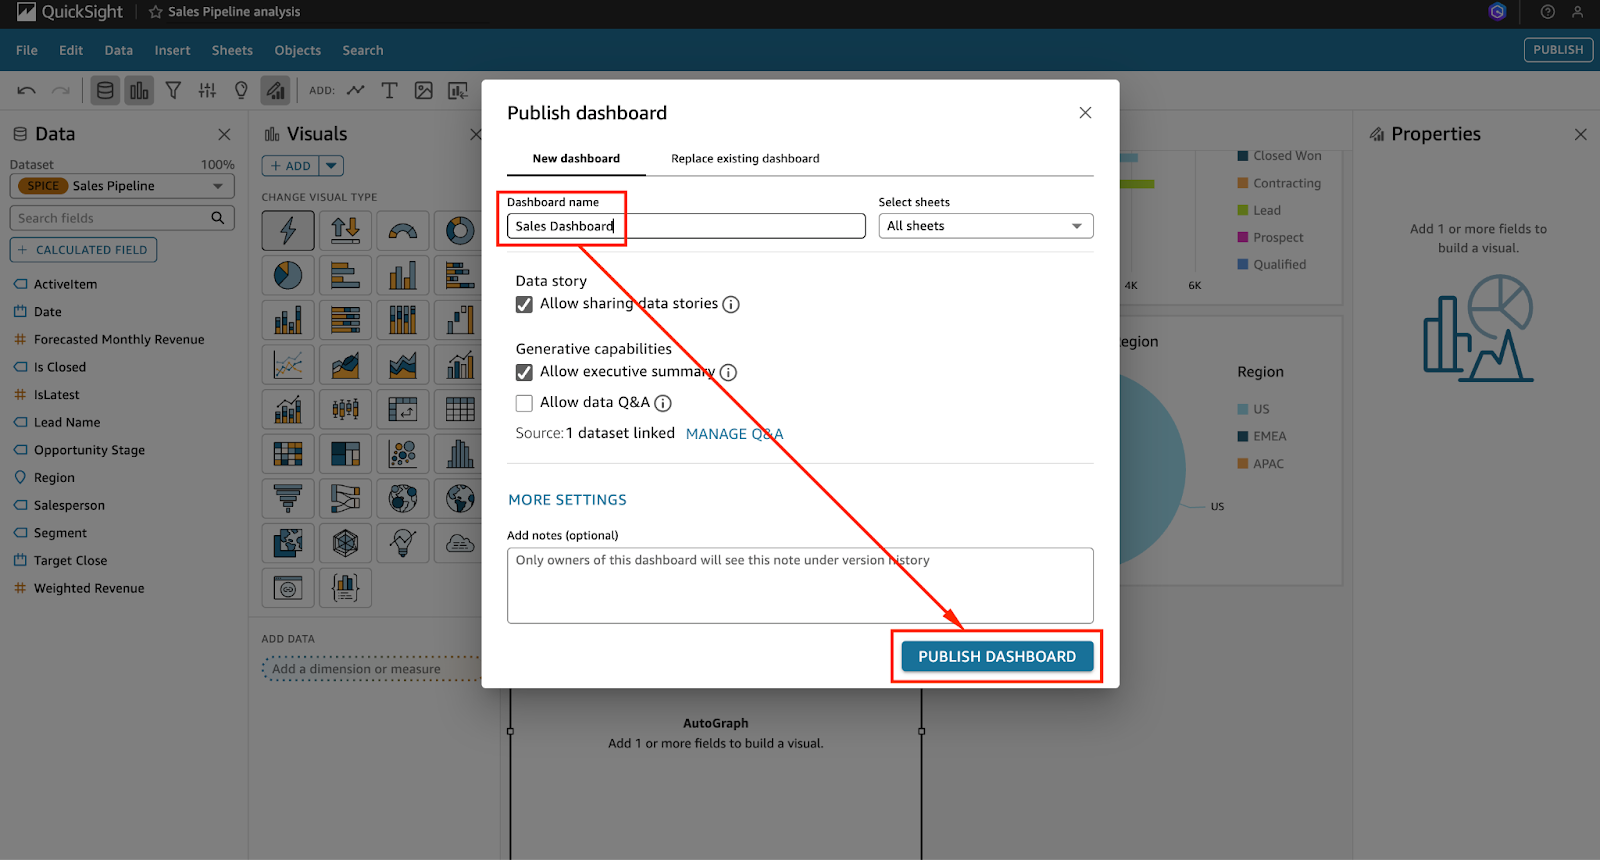
Once your dashboard looks the way you want:
The images below walk through the publishing process, from naming your dashboard to setting sharing options.
Screenshot of the QuickSight console showing the option to publish a dashboard (part 01).
Screenshot of the QuickSight console showing the option to publish a dashboard (part 02).
Screenshot of the QuickSight console showing the option to publish a dashboard (part 01).
It should be noted that you can also embed dashboards into internal tools or portals using QuickSight’s embedding APIs.
Once you are familiar with the foundational features of Amazon QuickSight, it is time to explore more advanced capabilities that enhance performance and deliver predictive insights.
These include leveraging the SPICE engine and machine learning-powered features.
SPICE, which stands for Super-fast, Parallel, In-memory Calculation Engine, is Amazon QuickSight’s proprietary in-memory engine.
It is designed to significantly improve query performance by caching data in memory, which minimizes latency and reduces the load on live data sources.
Rather than querying data directly from the source every time a visual loads, SPICE allows you to import data into QuickSight, which enables dashboards and analyses to render much faster, especially when working with large or complex datasets involving multiple joins and aggregations.
This makes SPICE ideal for dashboards that are shared across teams, accessed frequently, or based on large volumes of historical data.
To use SPICE, begin at the dataset setup stage:
SPICE also supports incremental refreshes, which allow you to update only the new or changed data, saving both time and compute resources.
QuickSight democratizes machine learning by making it accessible to analysts and business users without requiring data science expertise. Several ML-powered features come built-in, helping you discover trends, detect anomalies, and forecast future metrics with just a few clicks.
For example, if you are tracking monthly revenue across multiple regions, enabling anomaly detection on your line chart will highlight any outlier behavior, such as an unexpected drop or surge.
QuickSight provides confidence intervals and contextual explanations to help interpret the cause, in addition to flagging the anomalies.
You can activate forecasting with a single right-click on a time-series visual, and QuickSight will display future data points along with confidence bounds, making it easier to anticipate demand, sales, or customer engagement.
These AI-generated text boxes automatically adapt as data changes, which offers dynamic written insights such as "Sales increased by 15% in Q2 compared to Q1" or "Anomaly detected in product returns during the holiday season."
These machine learning capabilities enhance QuickSight into a more predictive and intelligent BI solution.
Amazon QuickSight offers a variety of options for securely sharing dashboards, both internally within your organization and externally through embedding into web applications.
One of QuickSight’s most powerful capabilities is the ability to embed interactive dashboards into portals, intranets, or customer-facing applications.
This is particularly useful for SaaS platforms, internal tools, or any environment where users should interact with BI content without accessing the AWS Console.
To embed a dashboard:
GenerateEmbedUrlForAnonymousUser or GenerateEmbedUrlForRegisteredUser API call, depending on your authentication model.<iframe>.Security is essential when embedding dashboards:
QuickSight provides several features for secure collaboration among team members:
The images below show how to share a dashboard for collaboration purposes.
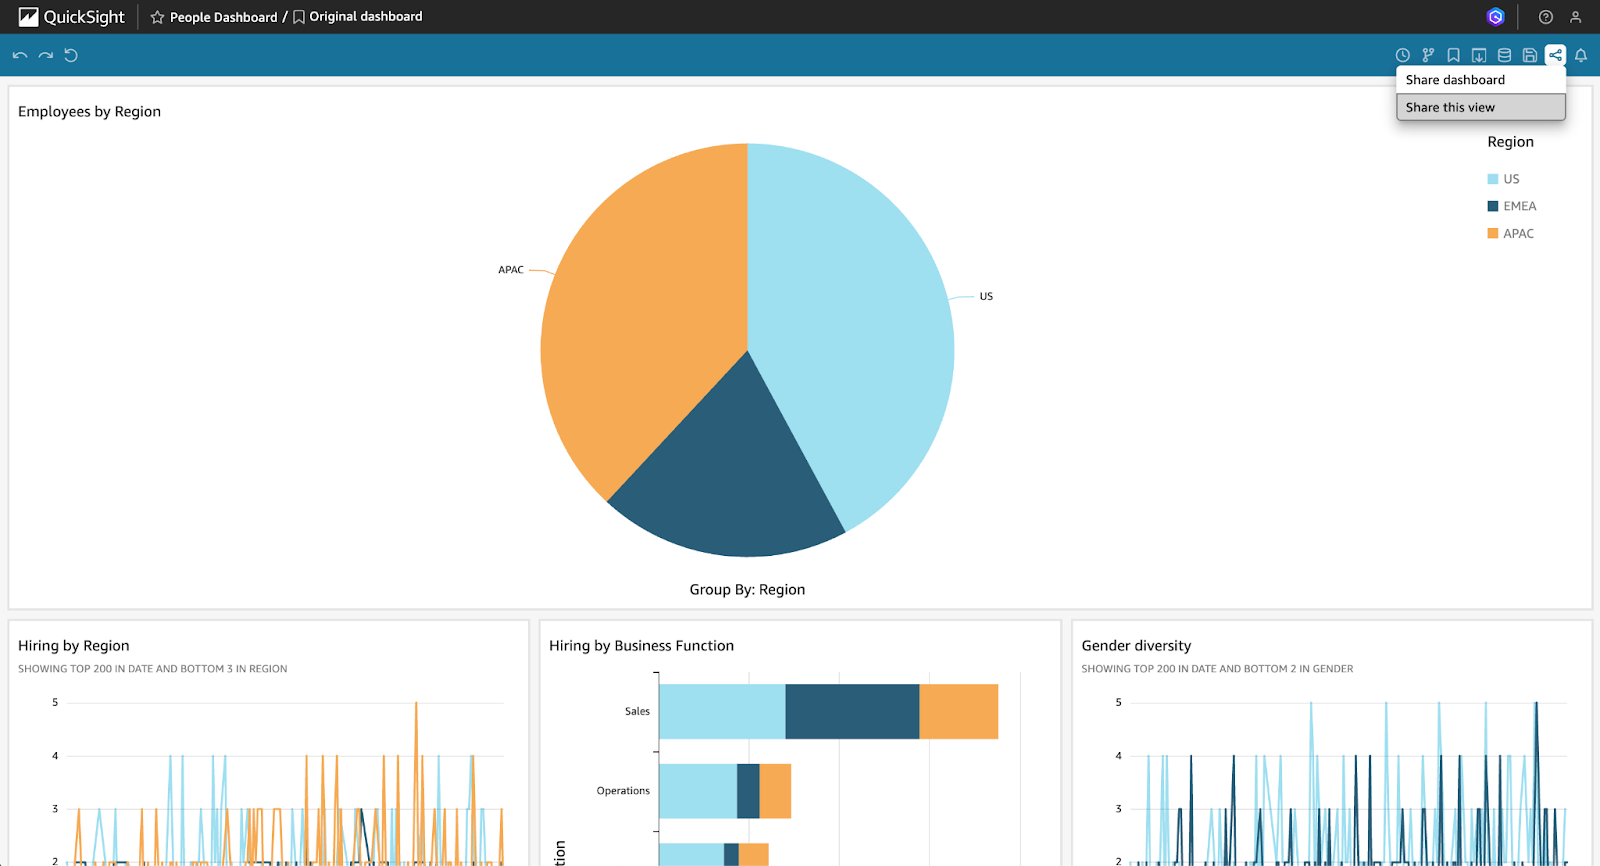
Screenshot of the QuickSight console showing the option to share a dashboard for collaboration purposes (part 01).
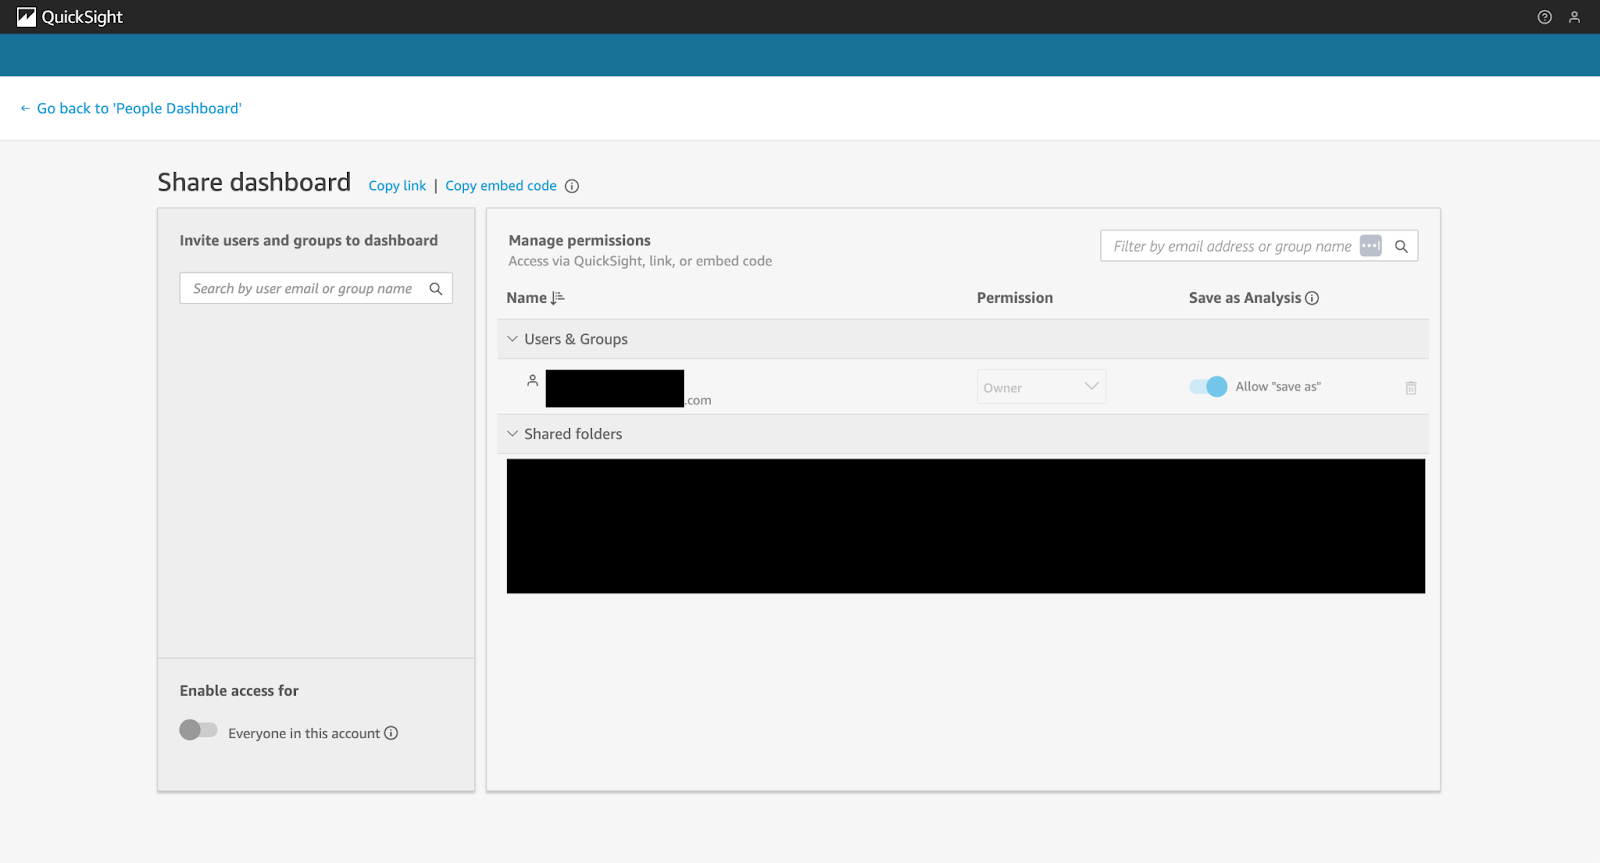
Screenshot of the QuickSight console showing the option to share a dashboard for collaboration purposes (part 02).
When working with business-critical or sensitive data, maintaining strong security controls and meeting compliance requirements are non-negotiable.
Amazon QuickSight provides enterprise-grade features that align with modern security and governance standards.
To protect your data at various levels:
Here is a sample RLS rule using user-based filtering:
{
  "region": "${user.region}"
}
You can manage user attributes directly in IAM or pass them dynamically via embedded session parameters.
QuickSight also integrates with AWS IAM, which enables fine-grained access control.
All data is encrypted at rest and in transit using AWS KMS, which ensures compliance with enterprise and industry security standards.
QuickSight’s Enterprise edition supports a range of governance features:
Best practices include tagging assets (dashboards, datasets), version-controlling important visuals, and reviewing access logs regularly to ensure proper governance.
Although Amazon QuickSight is built with cost-efficiency in mind, strategic configuration can help further reduce expenses while maintaining high performance.
QuickSight offers two primary pricing models:
To optimize costs:
SPICE capacity is limited based on your account plan, but you can maximize its efficiency by:
These strategies help keep SPICE usage under control while boosting dashboard performance.
QuickSight dashboards are highly interactive, but performance can be impacted as visuals and datasets grow.
Here are several ways I recommend to optimize dashboard responsiveness:
If your dashboards are slow to load:
You can also use a composite SPICE dataset to join and reuse data across multiple sources while improving load speed:
These techniques are especially effective in enterprise settings where scalability and performance consistency are essential.
> If you want to explore similar tutorials, check out the AWS EC2 Tutorial for Beginners or Amazon Bedrock: A Complete Guide.
After working with Amazon QuickSight, I have come to appreciate how it streamlines the process of turning raw data into interactive visuals.
Its built-in machine learning capabilities, high-speed performance via SPICE, and tight AWS integration make it a strong choice for scalable, cloud-native BI.
QuickSight is clearly a solution worth exploring for any data-driven organization.
To get a better understanding of the AWS ecosystem, explore the AWS Cloud Technology and Services course. If you are looking to extend your visualization skills beyond QuickSight, check out Introduction to Tableau.
Learn more about AWS with these courses!
Track
Course
Course
Tutorial
Tim Lu
Tutorial
Bex Tuychiev
Tutorial
Don Kaluarachchi
Tutorial
Zoumana Keita
Tutorial
Don Kaluarachchi
code-along
Suman Debnath