
Track
AWS Cloud Practitioner (CLF-C02)
10 hr
In my years working with AWS infrastructure, I've discovered that visibility into your cloud resources is the difference between proactive problem-solving and reactive firefighting.
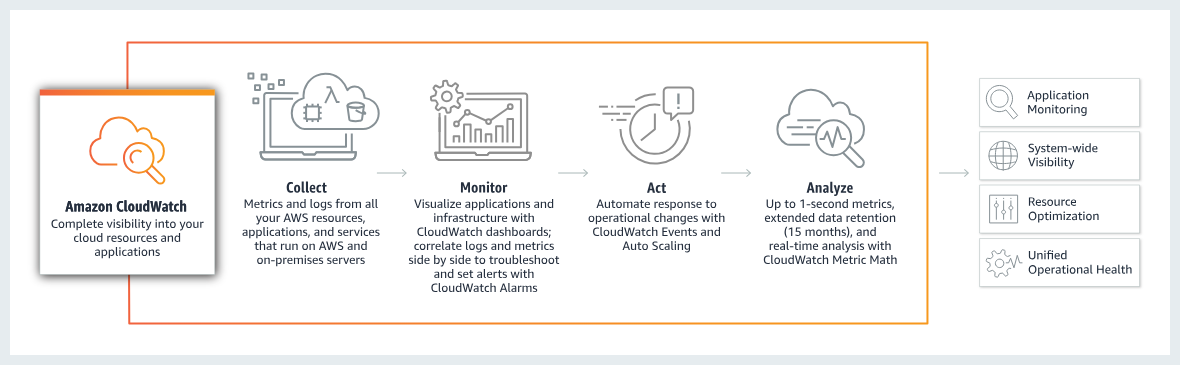
Amazon CloudWatch does exactly that: It serves as the central nervous system of your AWS environment, providing comprehensive monitoring, logging, and observability across your entire infrastructure.
I'll walk you through CloudWatch's capabilities, from basic metrics monitoring to advanced AI-powered operations. By the end of this tutorial, you'll understand how to use CloudWatch to monitor your AWS resources effectively, optimize costs, and resolve issues before they impact your users.
If you’re new to AWS, I recommend taking our AWS Cloud Technology and Services course.
Before diving into the practical aspects, let's first understand what CloudWatch is and how it fits into the broader AWS ecosystem.
CloudWatch is AWS's unified observability platform that collects, monitors, and analyzes data from your cloud resources and applications. The service enables you to monitor your complete stack, such as applications, infrastructure, network, and services, and use alarms, logs, and events data to take automated actions.
The platform operates across AWS-native environments and hybrid scenarios, supporting workloads across AWS, other cloud providers, and on-premises data centers. The CloudWatch Agent collects telemetry data from any environment, providing a single pane of glass for all monitoring needs.
AWS Cloudwatch
What makes CloudWatch particularly powerful is its integration depth within AWS. Every major AWS service automatically publishes metrics to CloudWatch:
This native integration means you can start monitoring immediately without complex configuration. Now that you understand what CloudWatch is, let's explore the costs involved in using this powerful service.
Understanding how much CloudWatch costs is crucial before implementing it in your infrastructure. Let me break down the pricing model and share strategies to keep costs under control.
The service operates on a pay-as-you-go basis with no upfront commitments. Most AWS Services send metrics automatically for free to CloudWatch.
The free tier includes generous allowances that cover basic monitoring needs:
Beyond the free tier, custom metrics cost approximately $0.30 per metric for the first 10,000 metrics, with volume discounts applied as usage scales. Dashboards are charged at $3 per dashboard per month.
Log ingestion typically costs $0.50 per GB in US East regions (pricing varies by region) after the free tier. This price applies only to the first 10 TB per month; after that, the rate gradually decreases.
Using Infrequent Access logs reduces ingestion costs by 50% to $0.25 per GB in US East regions. However, one limitation to be aware of is that they do not support using metric filters, which only work with Standard logs. However, Logs-IA does not support features like Metric Filters.
Here's a quick overview of the main pricing components beyond the free tier:
|
Feature |
Pricing (US East) |
|
Custom metrics (first 10,000) |
$0.30 per metric/month |
|
Log ingestion |
$0.50 per GB/ $0.25 per GB (Infrequent Access) |
|
Log storage |
$0.03 per GB/month |
|
Standard dashboards |
$3.00 per dashboard/month |
|
Standard alarms |
$0.10 per alarm/month |
Through my experience optimizing CloudWatch costs, I've identified several effective strategies:
If you want to learn more about using the AWS pricing structure to your advantage and keeping your resources safe, I recommend you take our AWS Security and Cost Management course.
CloudWatch offers a comprehensive suite of monitoring tools that work together to provide complete visibility into your AWS environment. Let's explore the core features you'll use most frequently.
Metrics form the foundation of CloudWatch monitoring. CloudWatch provides up to 1-second visibility into metrics, with 1-day to indefinite data retention, and the ability to perform calculations. This granular visibility enables real-time monitoring and historical analysis for capacity planning.
You can create dashboards tailored to different stakeholder needs. Operations teams need real-time resource utilization, while finance teams benefit from cost tracking. CloudWatch supports cross-account dashboards, enabling centralized monitoring for multi-account architectures.
Alarms provide proactive notification when metrics breach defined thresholds. I configure alarms with Amazon SNS integration to send notifications or trigger automated remediation through Lambda functions. For instance, when CPU utilization exceeds 80% for 5 minutes, an alarm can automatically trigger Auto Scaling.
Next, let's look at how CloudWatch extends beyond basic metrics to provide comprehensive application and container observability.
For modern applications, CloudWatch Application Signals provides out-of-the-box visibility into latency, errors, and performance across AI workloads. It also offers auto-instrumentation, eliminating manual code changes and allowing the creation and monitoring of service-level objectives (SLOs).
When it comes to containerized environments, CloudWatch Container Insights collects compute utilization information from containerized applications. Container Insights supports:
These observability capabilities generate significant data that requires effective management. To compare AWS’s container services, check out our comparison of ECS versus EKS.
Let's examine CloudWatch's log management features next.
For centralized log storage, CloudWatch Logs centralizes log management from AWS services, applications, and on-premises resources. I organize logs into log groups representing different applications, with log streams capturing individual sources. Retention policies balance compliance requirements with storage costs.
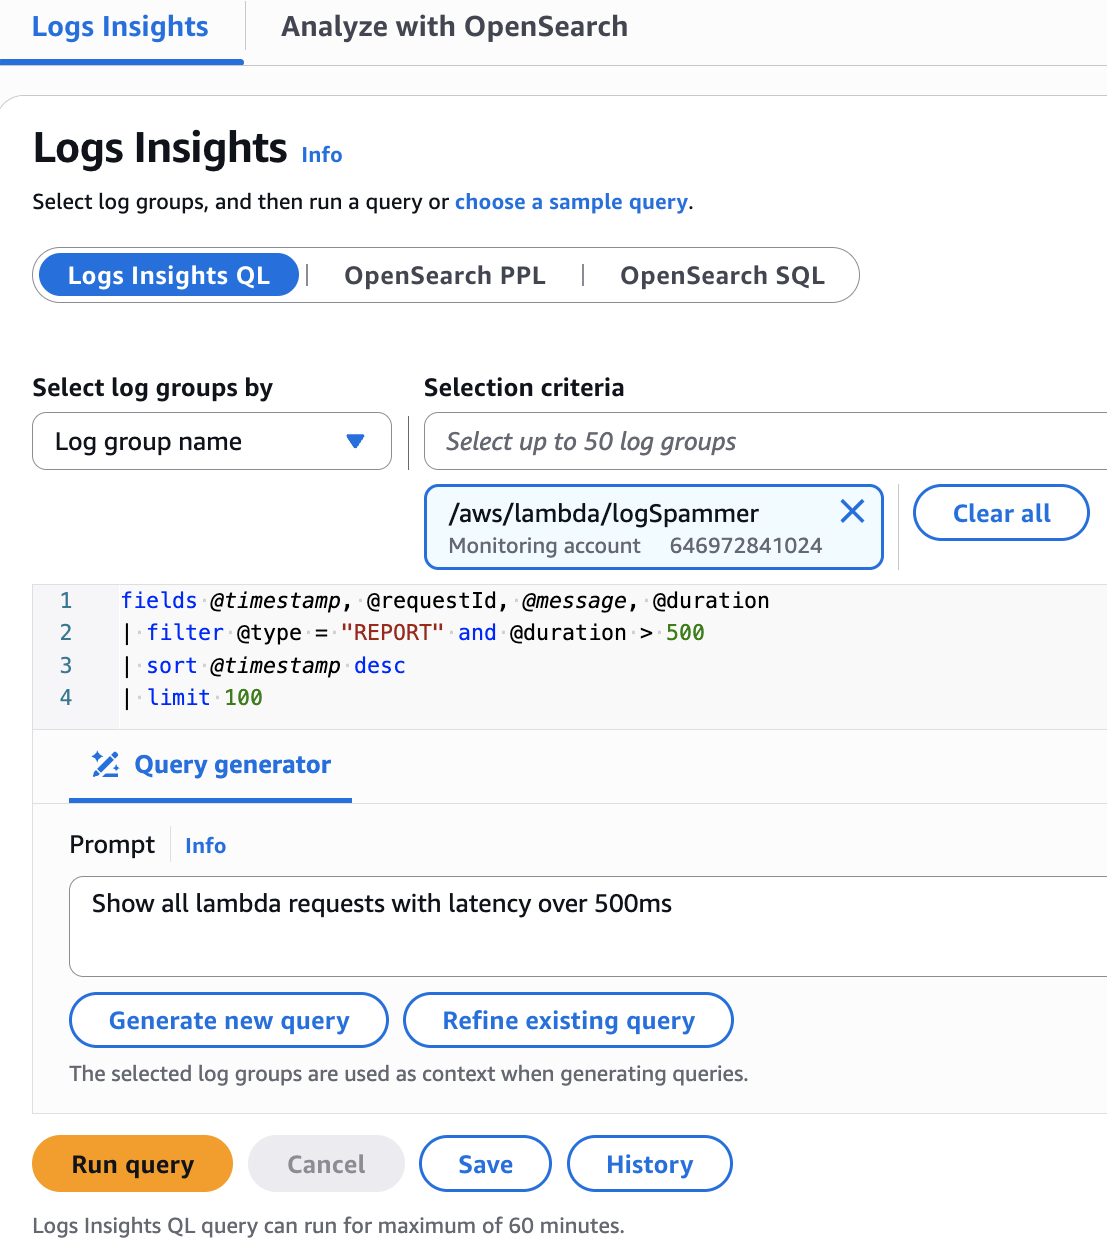
When you need to analyze this log data, CloudWatch Logs Insights provides a powerful query language for analyzing log data. I use its SQL-like syntax to quickly:
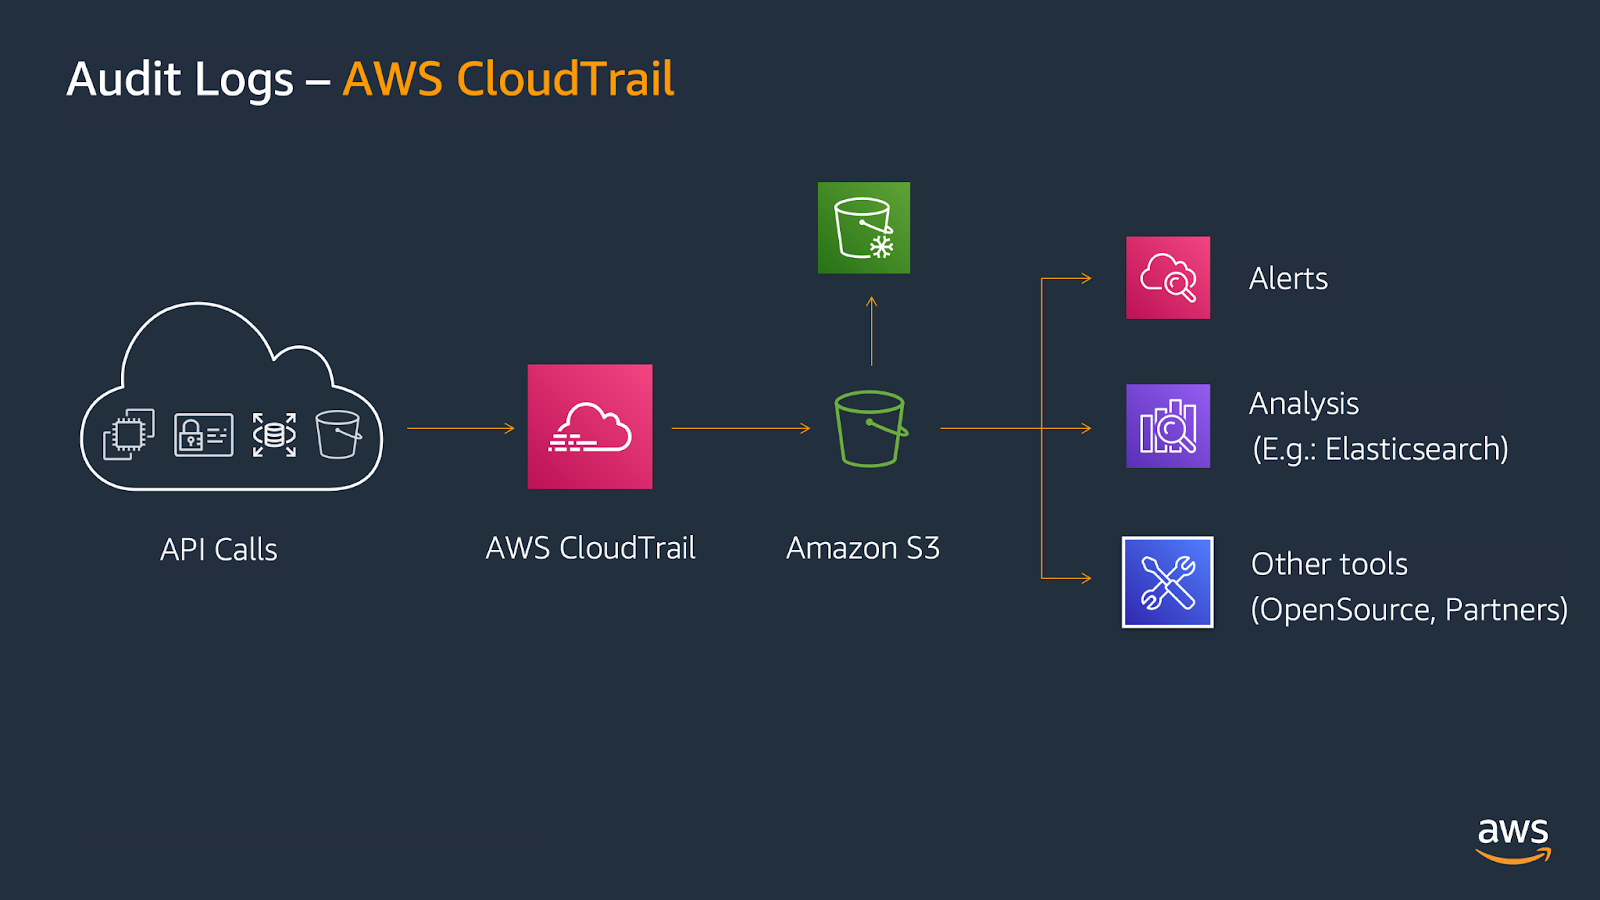
For security auditing, CloudWatch integrates with CloudTrail to capture and analyze all API calls.
Taking log management even further, the recent unified data management capabilities allow collecting and aggregating logs across AWS accounts and regions. It eliminates the need for complex ETL pipelines and multiple data stores, which is a game changer for globally distributed teams.
Beyond backend monitoring, understanding the actual user experience is equally critical. This is where CloudWatch's end-user monitoring capabilities come into play.
To capture how real users experience your applications, CloudWatch RUM (Real User Monitoring) captures actual user experience data from web applications. I implement RUM to understand application performance from the user's perspective, tracking page load times, JavaScript errors, and user behavior.
For proactive testing before users are affected, CloudWatch Synthetics complements RUM by proactively testing application endpoints. You can create canaries (scripts simulating user interactions) to continuously monitor availability. These tests run on schedules, alerting to issues before real users encounter them.
While RUM and Synthetics provide surface-level monitoring, understanding what happens inside your distributed applications requires deeper visibility. That's where distributed tracing becomes essential.
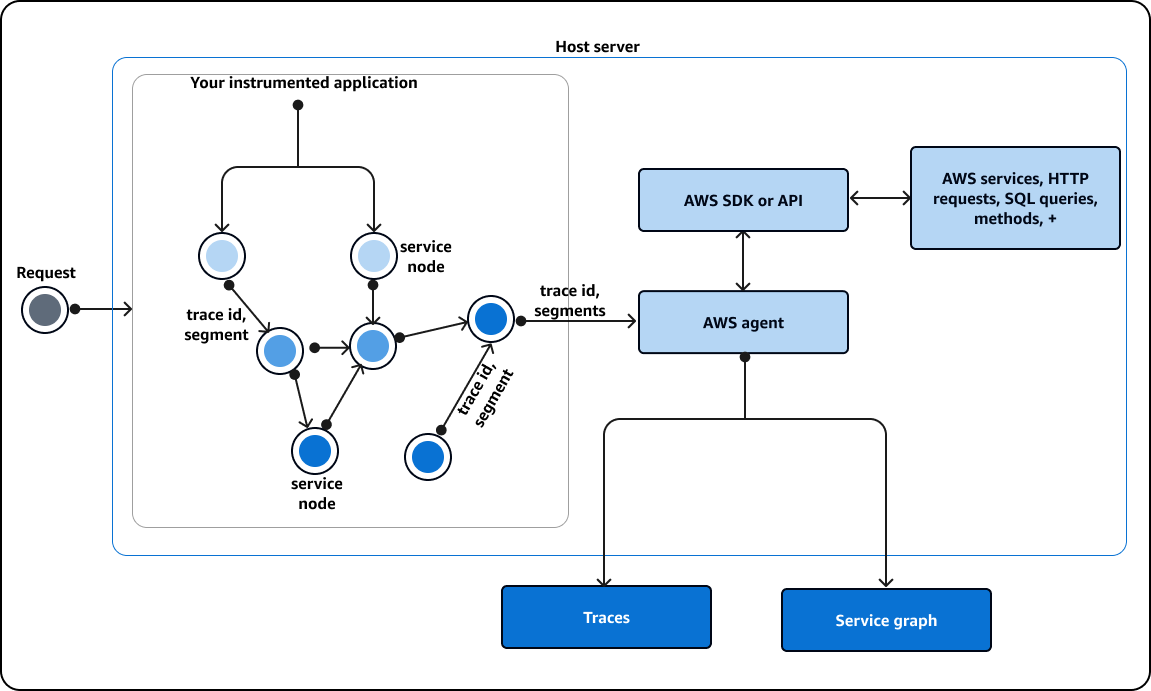
For complete request visibility, AWS X-Ray integration enables distributed tracing, showing request flows through microservice architectures. The trace map visualizes service dependencies and highlights latency sources. I use X-Ray to identify latency bottlenecks and understand service dependencies.
On the other side, to identify performance patterns and bottlenecks, Contributor Insights analyzes high-cardinality data to identify top contributors to system behavior. When investigating errors, it shows which specific endpoints, users, or resources generate the most issues.
These monitoring capabilities become exponentially more powerful when integrated with AWS's automation services. Here's where things get interesting.
CloudWatch's power multiplies through integrations with other AWS services. For event-driven automation, Amazon EventBridge receives CloudWatch alarms and events, orchestrating automated responses. You can build workflows where CloudWatch alarms trigger EventBridge rules invoking Lambda functions for:
For complex operational workflows, integration with Systems Manager enables automated operational actions. CloudWatch alarms can trigger Systems Manager Automation documents executing complex remediation procedures across multiple resources.
Now that we've explored CloudWatch's features, let's discuss why implementing this platform matters for your organization.
Understanding CloudWatch's features is one thing, but seeing how they translate into real business value is what truly matters. Here's why organizations across industries rely on CloudWatch for their operations.
CloudWatch provides centralized visibility into all AWS resources. I highly value the ability to monitor EC2 instances, Lambda functions, database queries, and application-specific metrics from a single interface, which enables rapid correlation between infrastructure behavior and application performance.
The platform reduces mean time to resolution through comprehensive data collection. When investigating incidents, I can view metrics, logs, and traces together, understanding not only that a problem occurred but also why it happened.
Beyond operational visibility, CloudWatch plays a crucial role in maintaining compliance and supporting forensic investigations.
For regulated industries, CloudWatch serves as the centralized repository for audit trails and compliance logs. I configure log retention periods matching regulatory requirements. CloudWatch's integration with CloudTrail captures all API activity, providing complete audit trails for security investigations.
During incident response, logs become the primary source for root cause analysis. CloudWatch Logs Insights enables rapid querying across terabytes of log data, helping identify error patterns and analyze system behavior leading up to incidents.
Compliance and troubleshooting capabilities naturally lead to another critical benefit: cost optimization.
CloudWatch's billing metrics enable proactive cost management. I configure alarms on estimated charges to detect unexpected increases immediately, which helps me to investigate costs quickly and take corrective action.
Performance insights also drive cost optimization. By analyzing resource utilization metrics, I identify over-provisioned resources for right-sizing and understand application bottlenecks that reduce required resources.
CloudWatch extends beyond AWS to monitor hybrid and multi-cloud environments, supporting organizations with diverse infrastructure landscapes. Using the CloudWatch Agent, you can, for instance, collect metrics from on-premises servers, providing unified observability regardless of where workloads run.
In my experience, this proves especially valuable during cloud migrations. I can compare performance between environments using the same tooling, ensuring migrations don't introduce regressions.
For those of you who wonder how those features compare to Amazon’s CloudTrail service, make sure to read our comparison piece on AWS CloudTrail versus AWS CloudWatch.
Ready to get started with CloudWatch? The setup process is straightforward, and I'll walk you through everything you need to begin monitoring your infrastructure.
Before beginning CloudWatch implementation, ensure you have these prerequisites:
For production, I recommend dedicated IAM roles that follow least privilege principles rather than granting long-term full access.
If you already have an account but need help specifically with the terminal commands, our tutorial on How to Use the AWS CLI walks you through the command line aspect itself.
Now that prerequisites are covered, let's move to the initial setup process.
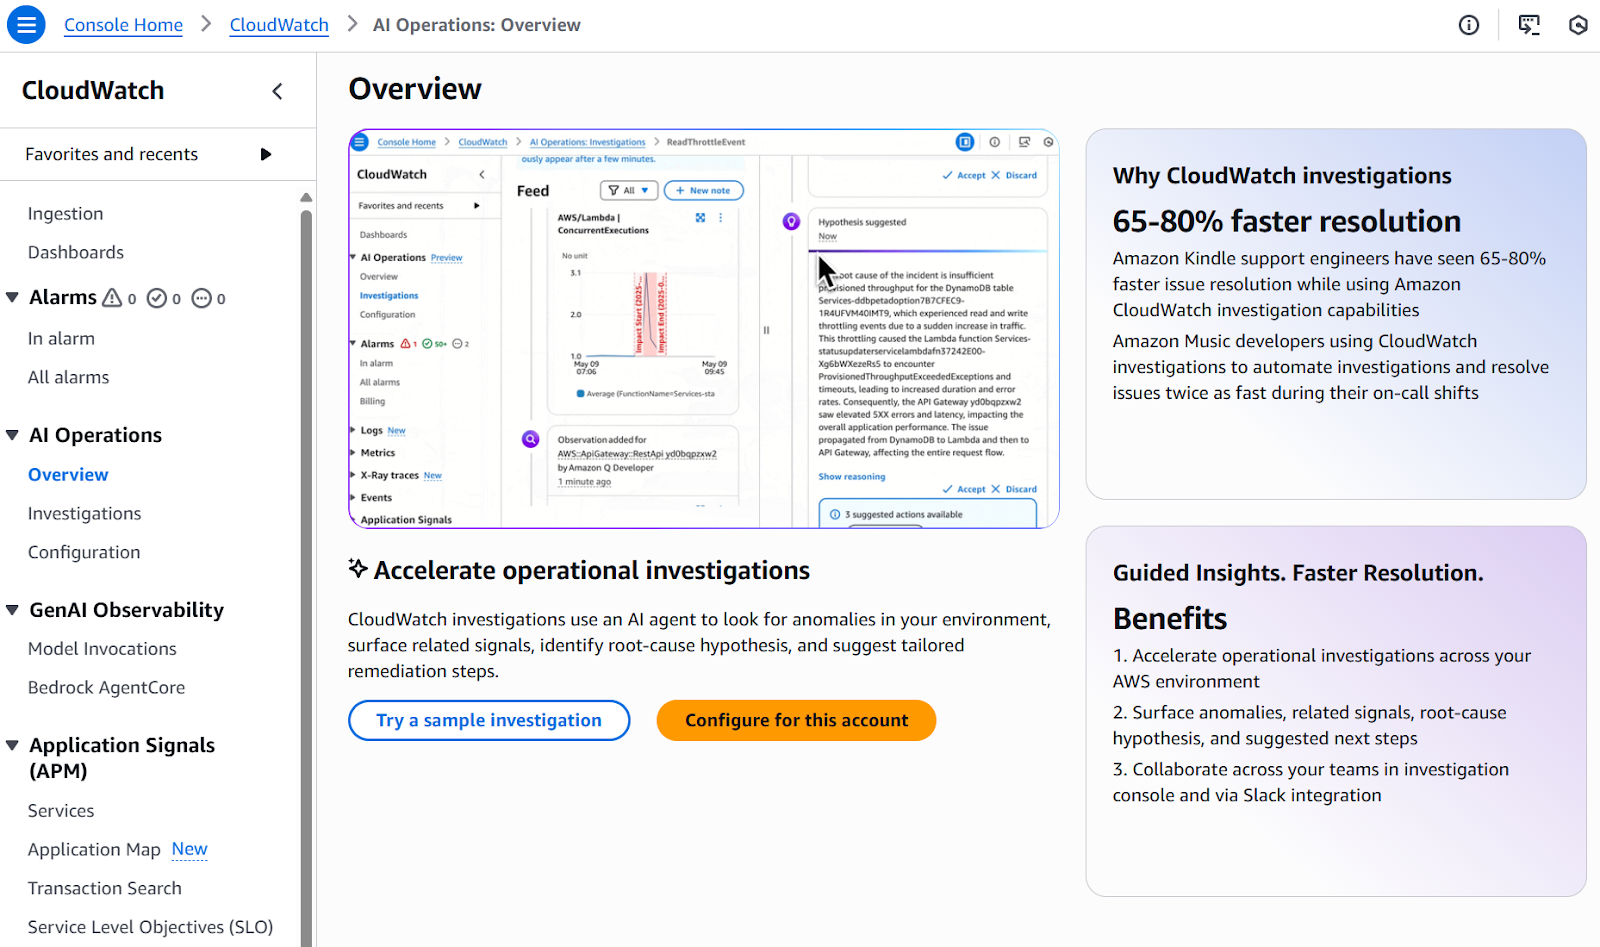
Access CloudWatch through the AWS Management Console by navigating to the CloudWatch service. The main view provides immediate visibility into all commands, options, and integrations.
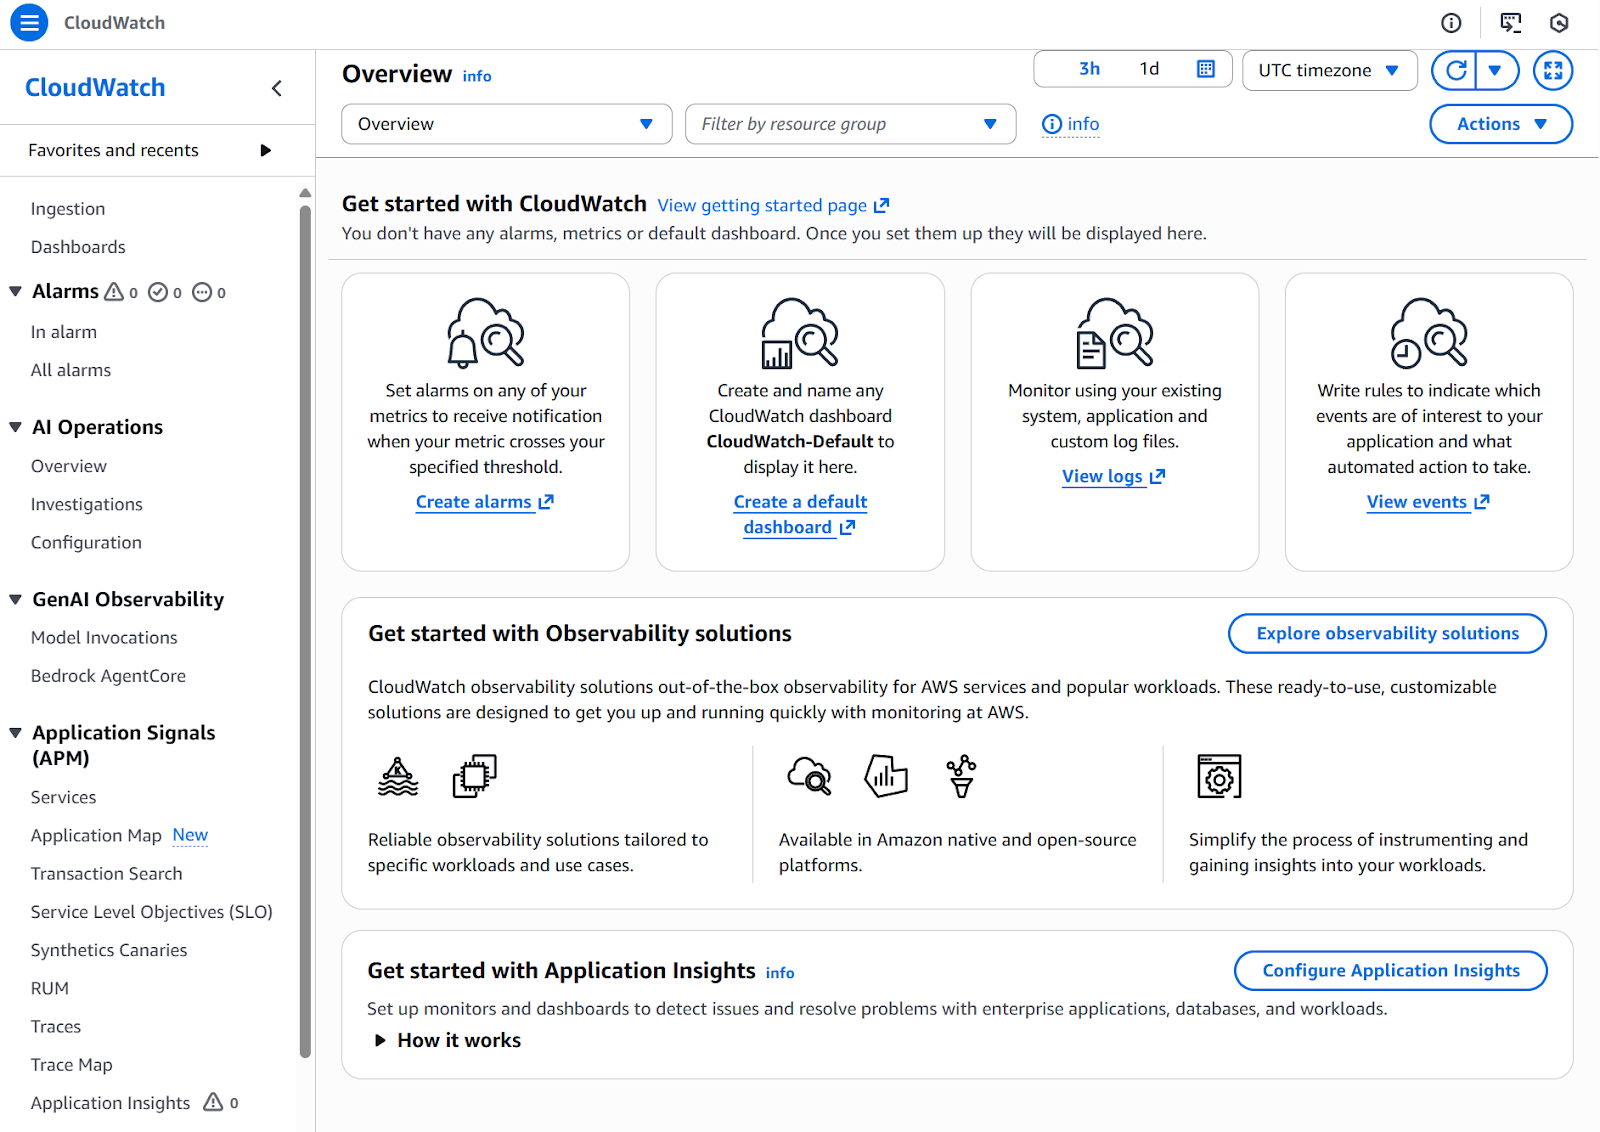
AWS CloudWatch
For instance, you can visualize the logs of your running services under Log Management. This is probably one of the most used visualizations as it allows us to analyze the logs of the applications and perform debugging in case anything is not running as expected.
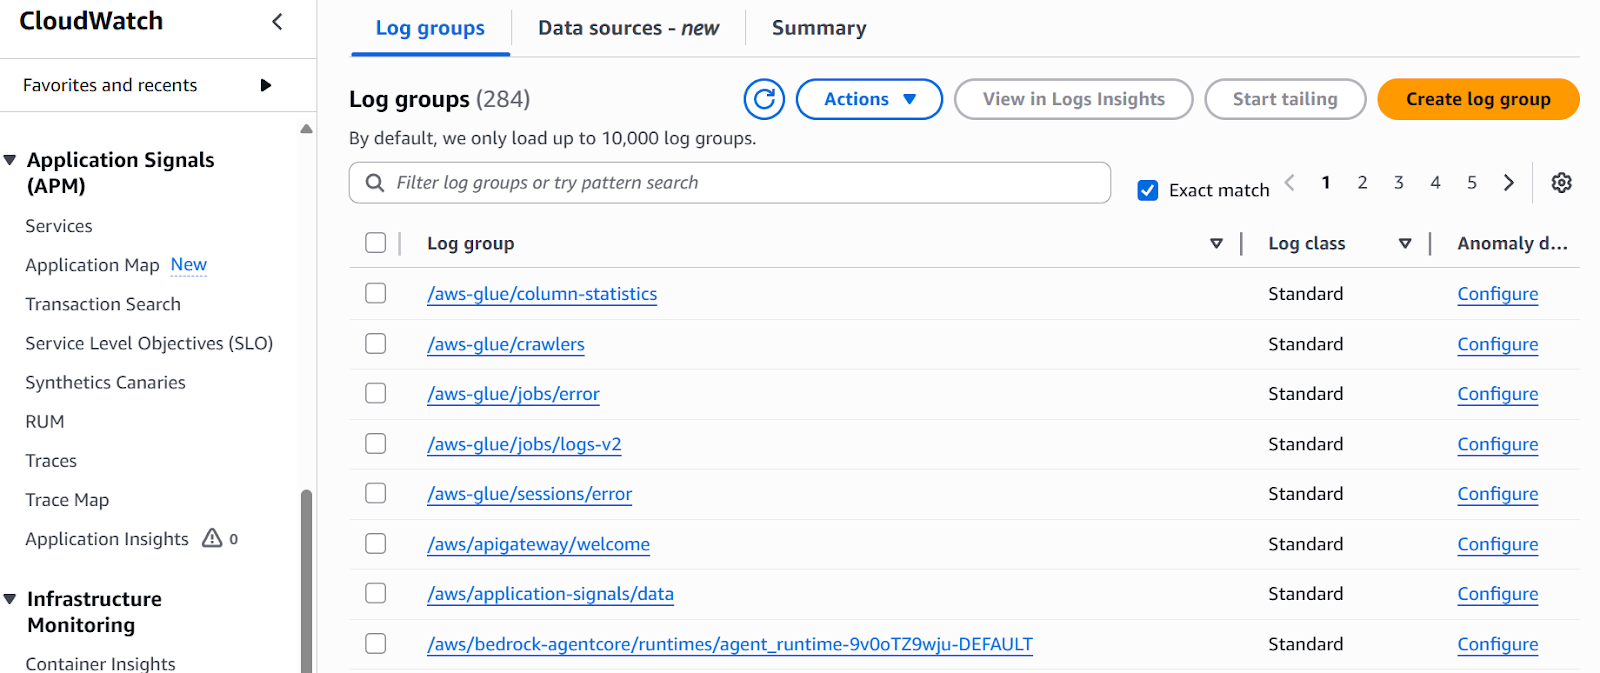
Log management
Now that you know how to access CloudWatch, let's dive into the practical workflows you'll use every day to monitor your resources effectively. I'll show you the essential monitoring techniques that will become second nature.
Viewing metrics begins in the CloudWatch Metrics console. Here's how to get started:
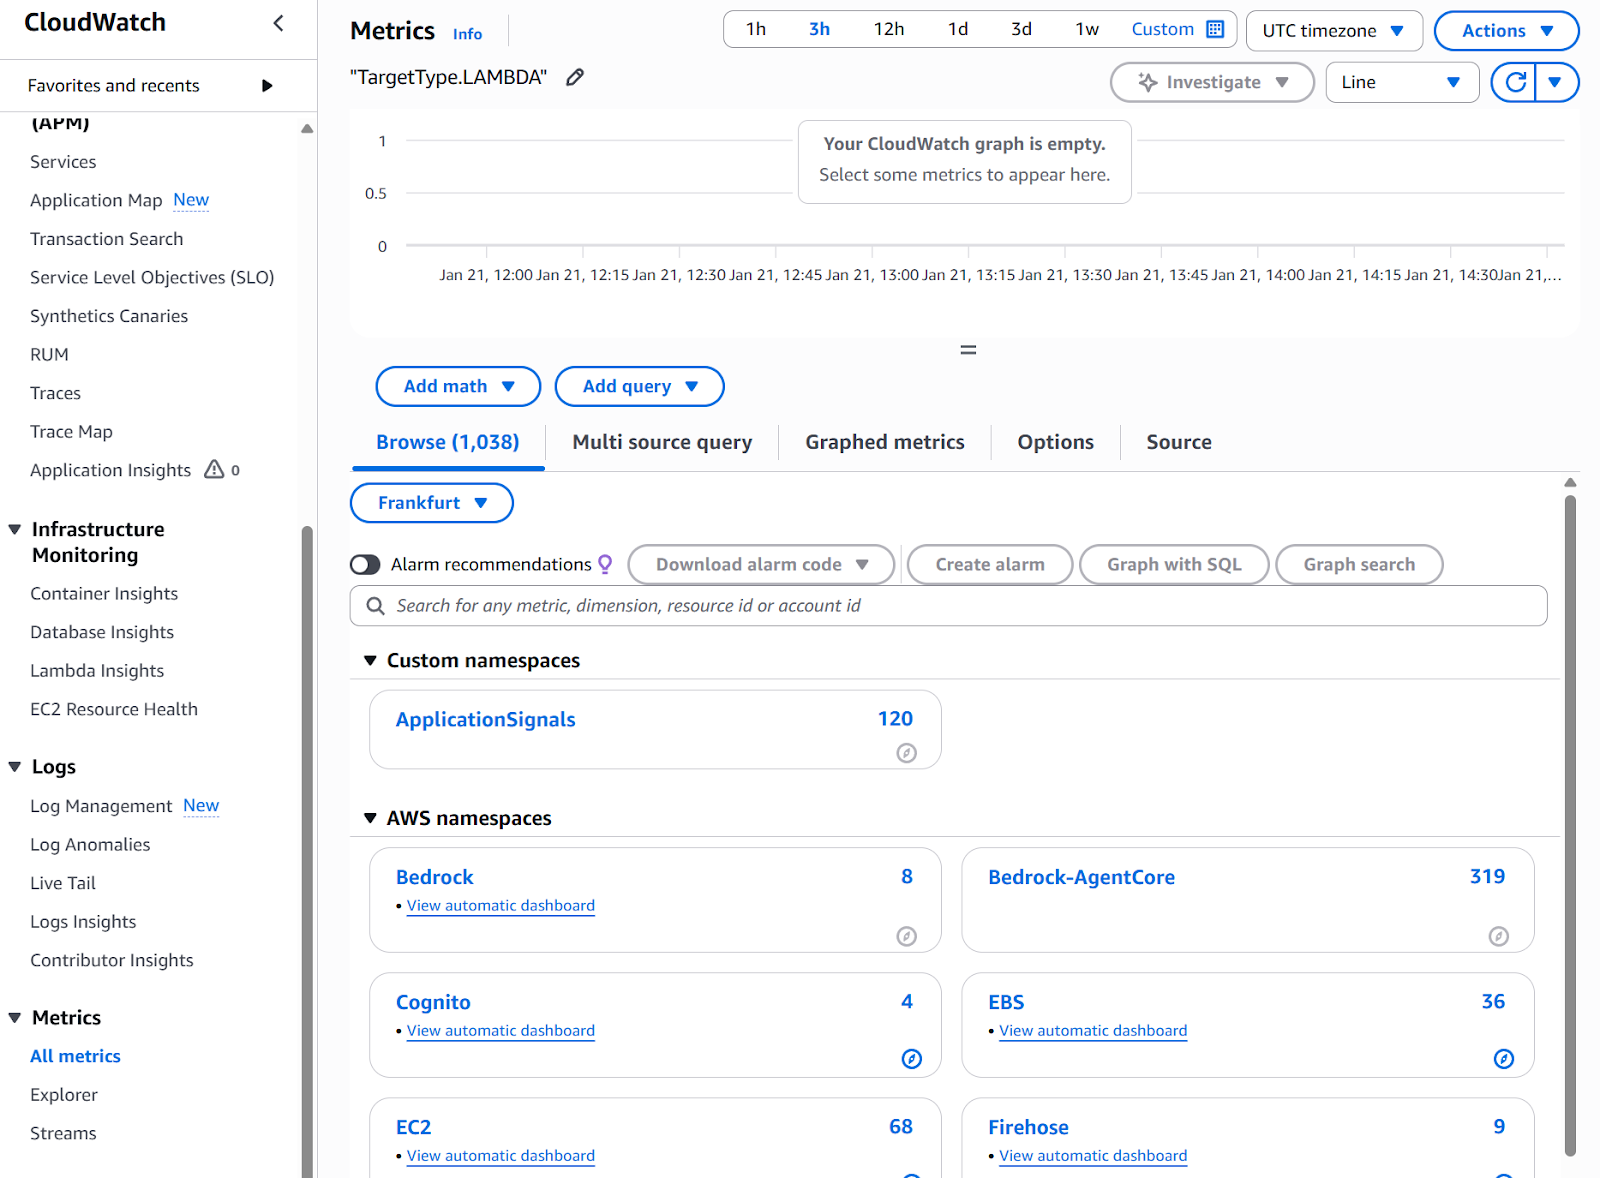
CloudWatch metrics dashboard
As you can see in the image above, under "All metrics," you have access to the different services. To get started, you can click on any service and access the automatic dashboard. For instance, if I click on my Bedrock dashboard, I land in the Bedrock default metrics, where I can visualize different standard measurements such as latency, token counts by model, requests, or error count.
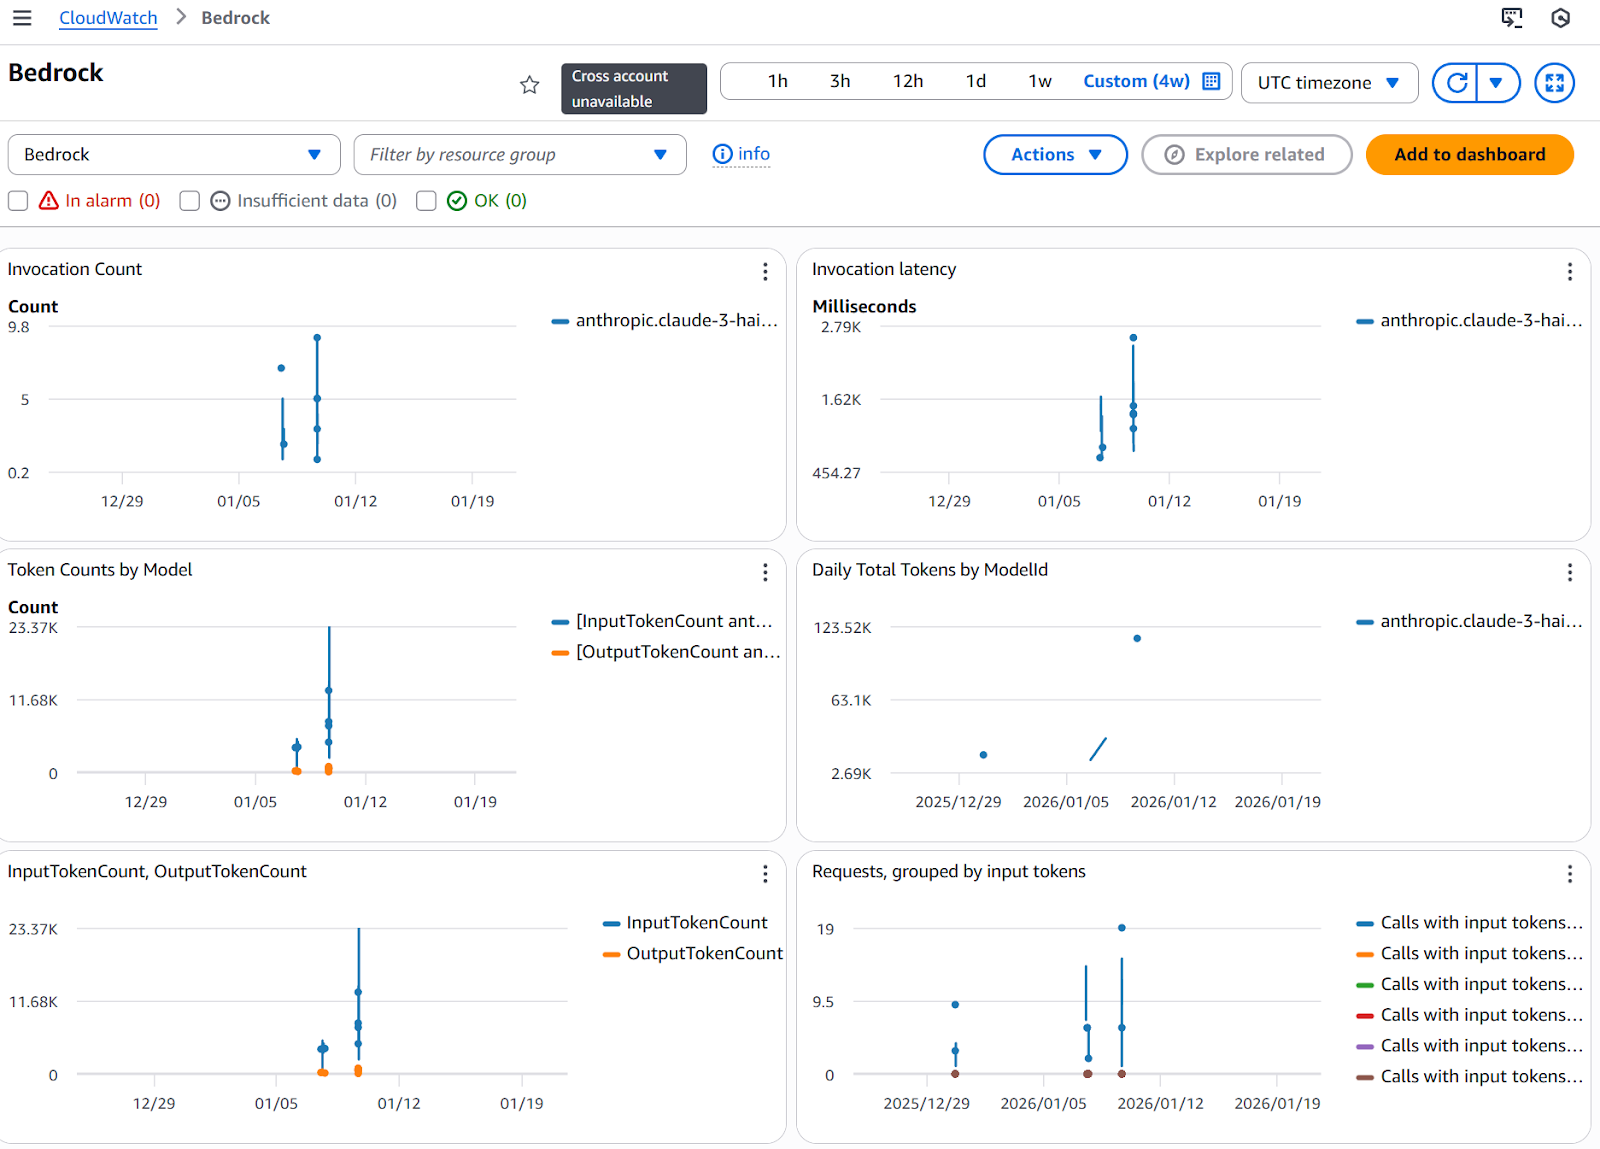
AWS Bedrock metrics
Apart from visualizing the metrics, it’s also possible to extract metrics from log data. This can be done by using filters and establishing a pattern. Follow the next steps to define a filter pattern from a metric:
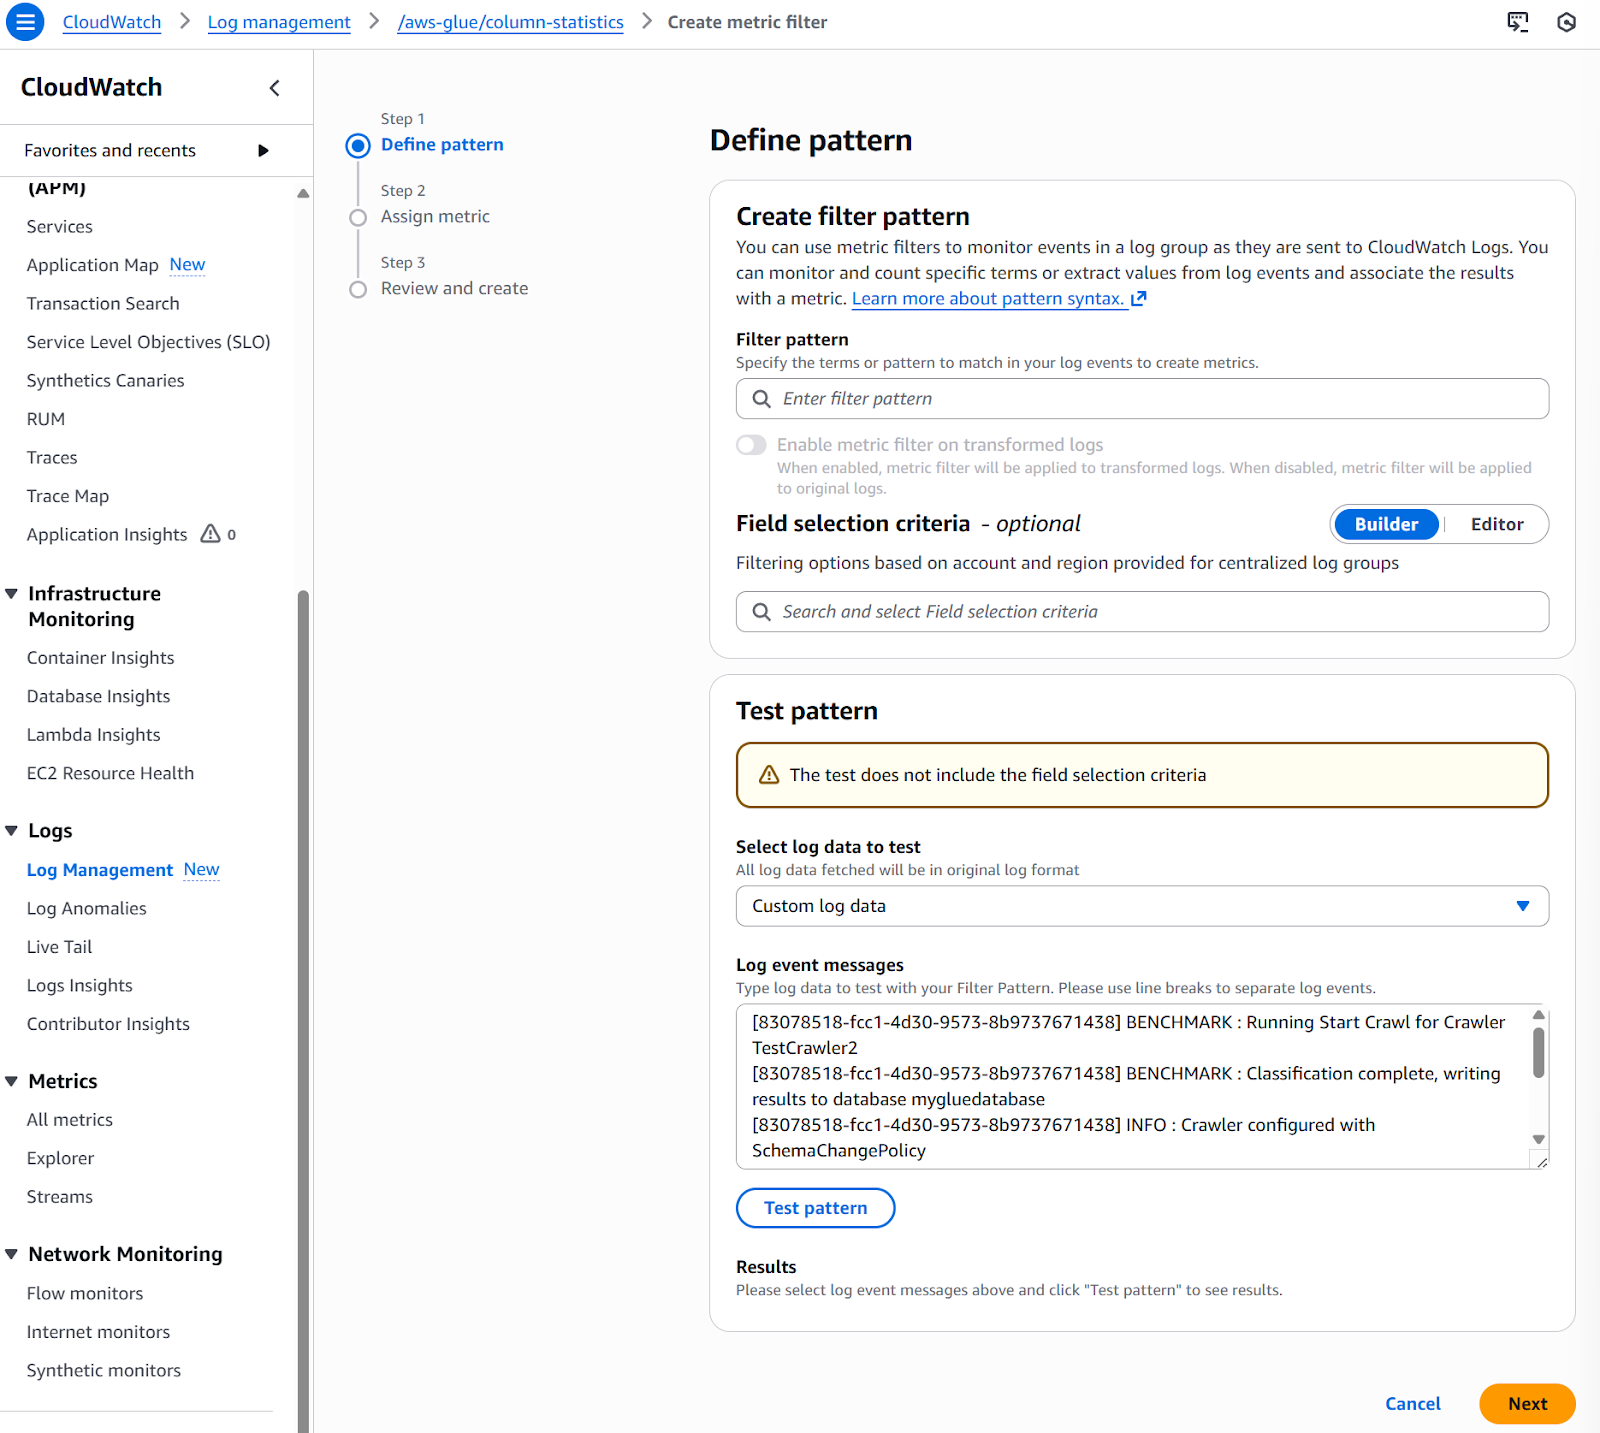
Creating metric filters
This automatically generates metrics from your log data without additional code.
Once you're comfortable with metrics, the next step is creating dashboards to visualize this data effectively.
Dashboards provide a centralized view of your most important metrics. Here's how to create effective dashboards for different teams.
After this, you will be redirected to the “Add widget” page, where you can customize the type of dashboard style.
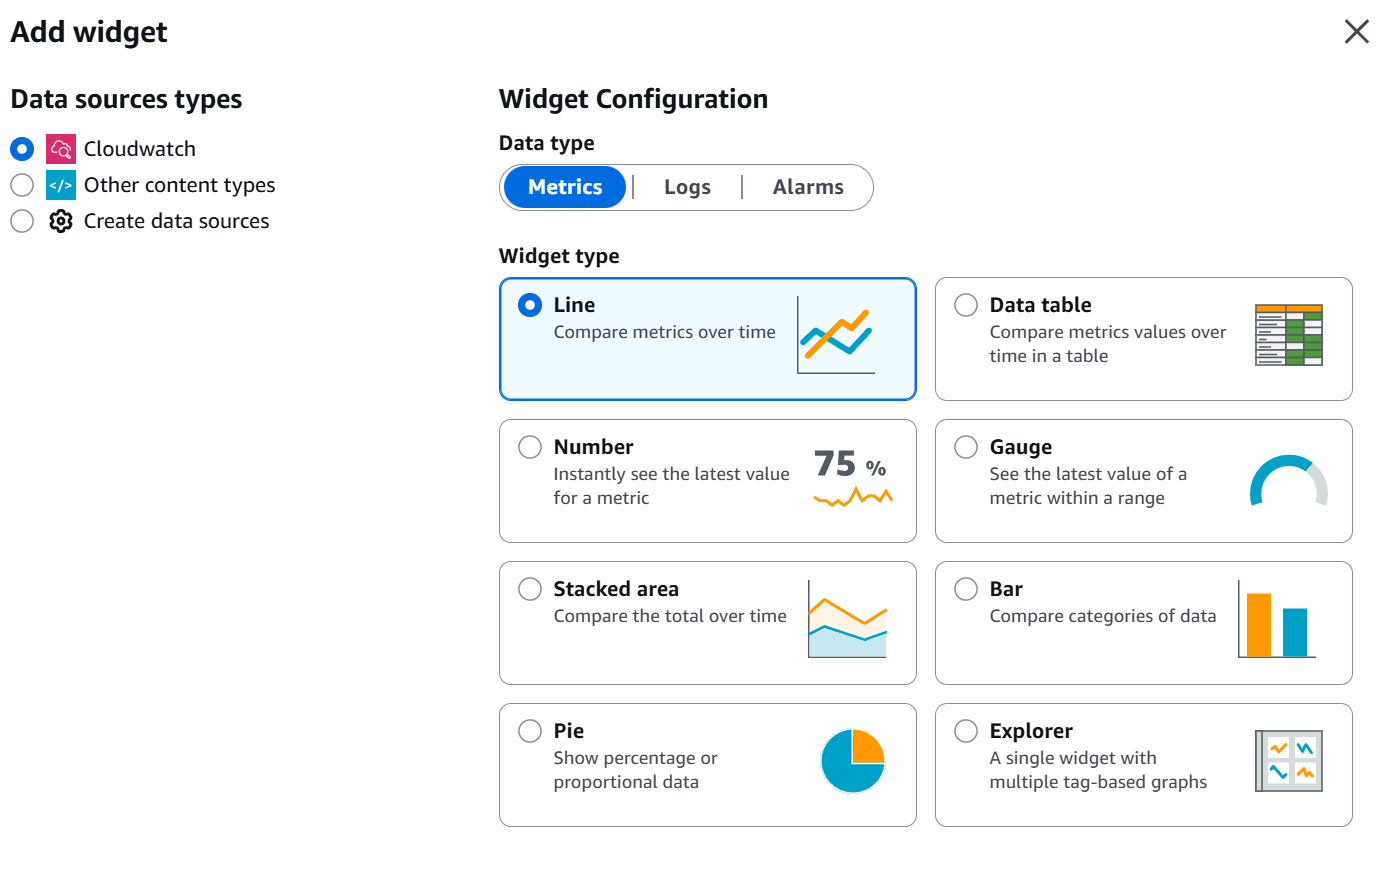
Dashboard widgets
The best approach to designing dashboard widgets is to customize them based on team requirements. This is what I normally recommend for some common teams:
For operations teams:
For finance teams:
For product teams:
With this in mind, you can create them by following these steps on the AWS Console:
Once you follow these steps, you can visualize your custom dashboard with the selected metrics. If required, you can modify it or even share it either privately or publicly.
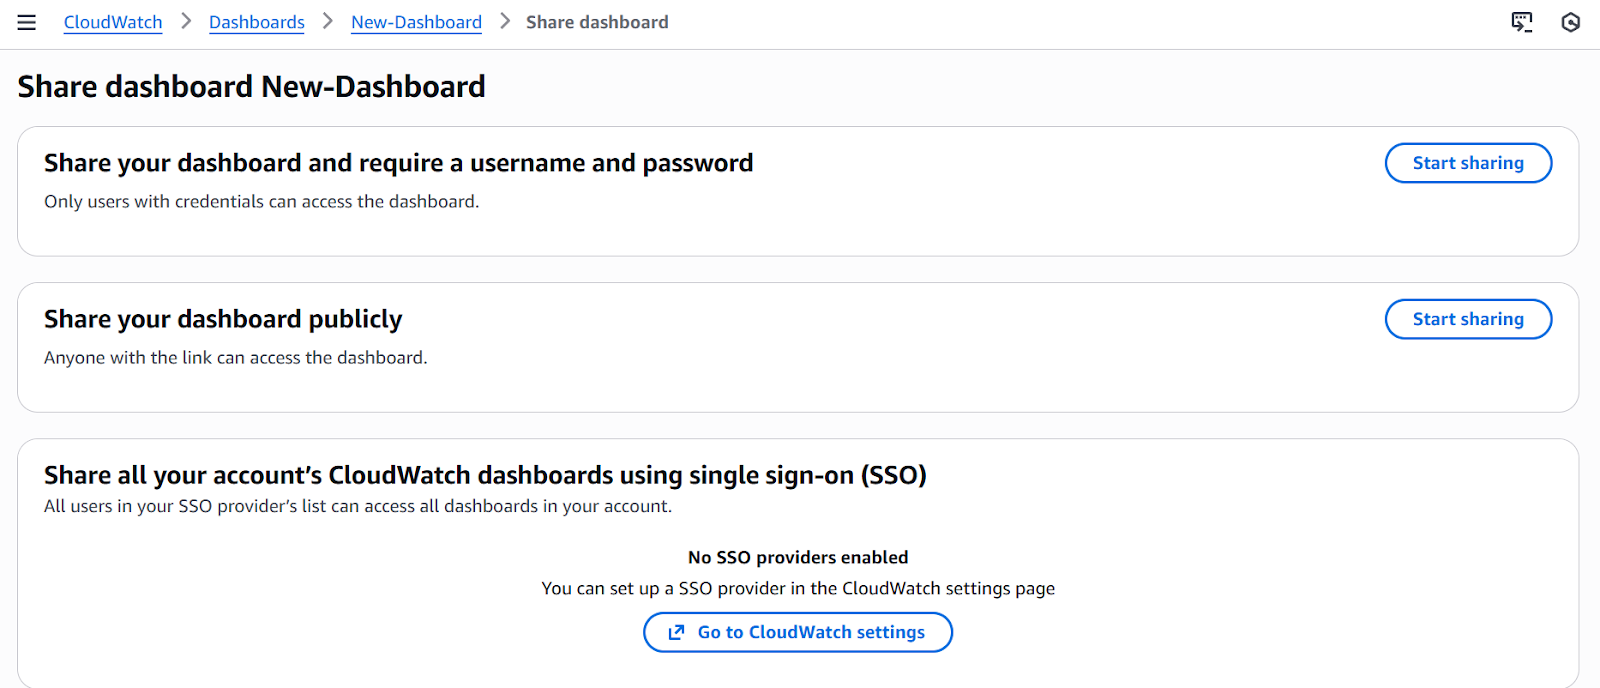
Sharing Custom Dashboards
Apart from application metrics and dashboards, it is also critical to control the costs, to avoid unnecessary charges, and to optimize the whole system. CloudWatch can help you track and control these costs before they explode. Here's how to set up billing monitoring:
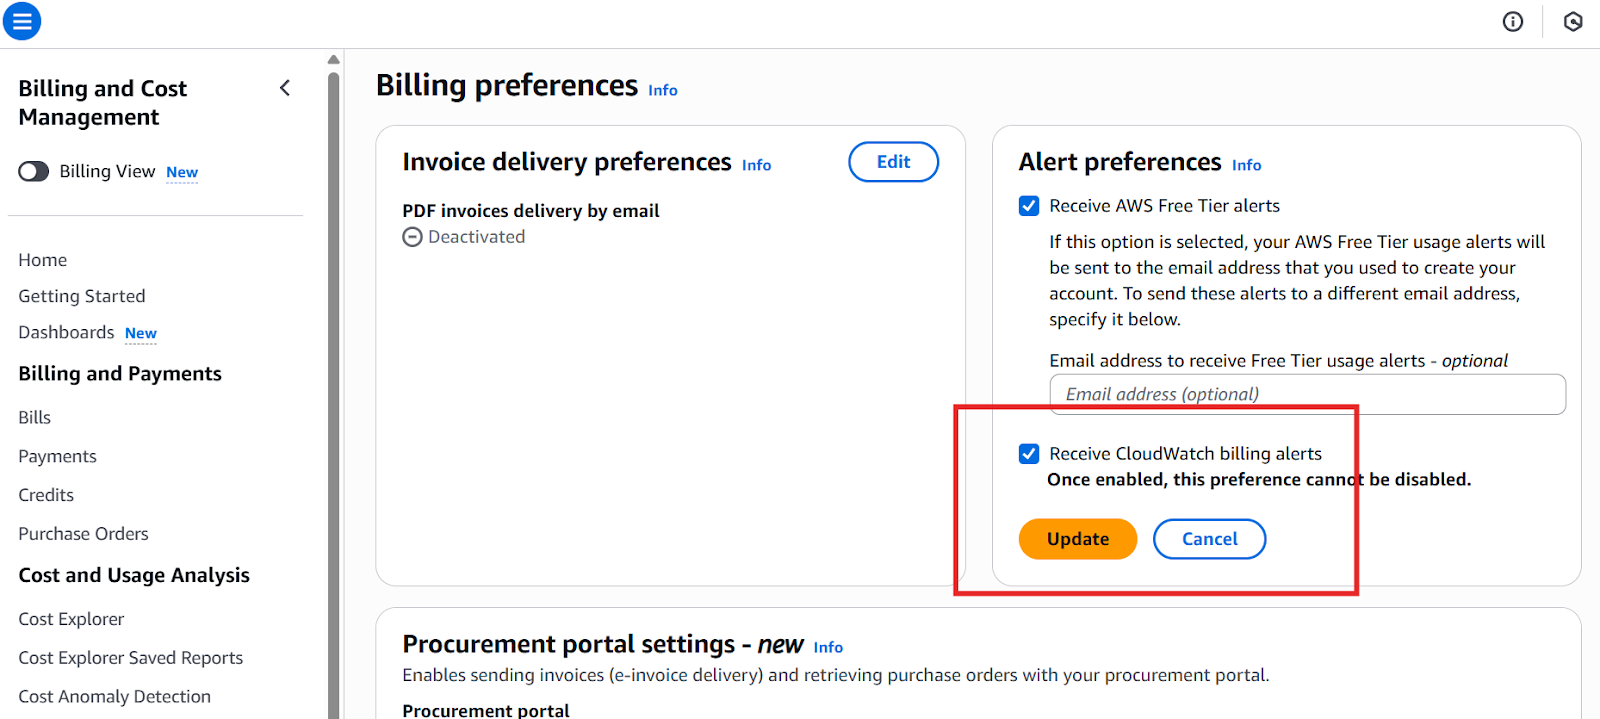
Enabling CloudWatch billing alerts
Note that it may take up to 15 minutes for billing metrics to appear in CloudWatch, so after applying the settings and waiting for this time, move back to the CloudWatch console to create the billing alarm.
Now that we have enabled billing metrics, we can create a CloudWatch billing alarm following these steps:
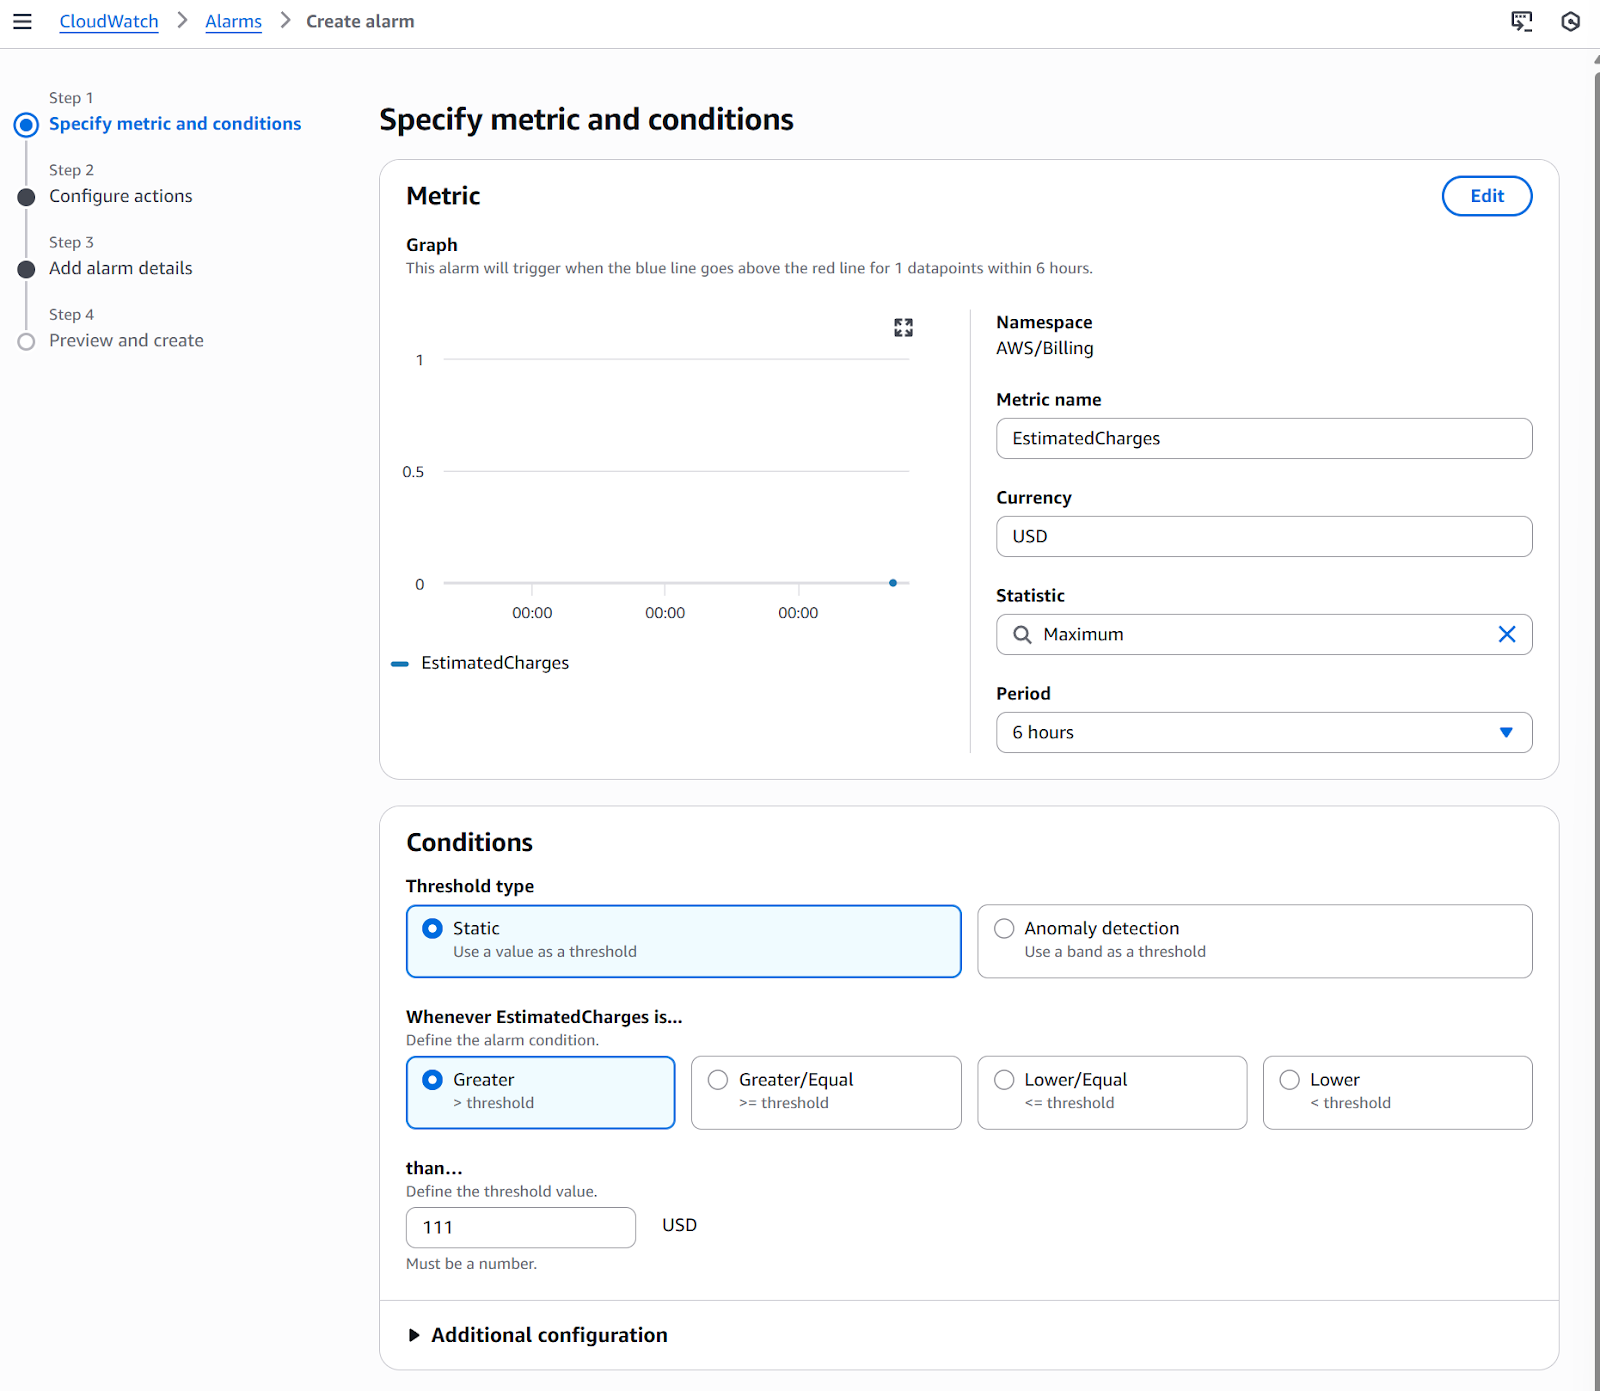
Alarm metrics and conditions
After these steps, your billing alarm will be ready, and your costs or anomalies (depending on your selection) will be triggered, and you will be notified accordingly.
But beyond AWS's built-in metrics, you'll often need to track metrics specific to your business and applications. This would mean creating and publishing custom metrics.
Custom metrics let you monitor application-specific data that AWS doesn't automatically track. You can publish your own custom metrics using the AWS CLI or an API. For a simple example, let me show you how to do it using the AWS CLI.
The following command allows you to publish a basic custom metric:
aws cloudwatch put-metric-data \
  --namespace "MyApplication" \
  --metric-name "PageViews" \
  --value 1452 \
  --unit Count
But you can also define dimensions to help categorize metrics. It is possible to include up to 30 dimensions per metric as key/value pairs.
aws cloudwatch put-metric-data \
  --namespace "MyApplication" \
  --metric-name "ResponseTime" \
  --value 245 \
  --unit Milliseconds \
  --dimensions Environment=Production,Service=API
These custom metrics will appear in the AWS CloudWatch console, and you can add them to a new or existing dashboard.
Some of the most common use cases for custom metrics I have seen are:
With these fundamental monitoring techniques mastered, you're well-equipped to handle day-to-day operations.
Beyond the fundamentals, CloudWatch offers cutting-edge features that set it apart from traditional monitoring tools. These capabilities use AI to address the unique challenges of modern cloud architectures.
CloudWatch Investigations harnesses generative AI to automate root cause analysis and provide guided troubleshooting. When incidents occur, Investigations automatically correlate:
Beyond identifying issues, it generates an incident report that transforms post-incident analysis. A single click activates comprehensive data collection to generate detailed, contextual documentation, eliminating manual evidence gathering.
CloudWatch Investigations
To prevent false alarms from cluttering your operations, anomaly detection with pattern recognition reduces alert fatigue by identifying genuine anomalies versus expected variations. You can configure anomaly detection on key metrics, so CloudWatch learns normal patterns and alerts only on statistically significant deviations.
Generative AI applications introduce new monitoring requirements. CloudWatch enables developers to analyze telemetry across AI application components:
For organizations monitoring AI applications such as Amazon Bedrock AgentCore, CloudWatch provides built-in dashboards specifically designed for GenAI observability, with compatibility extending to open-source frameworks like Strands, CrewAI, and LangGraph.
This allows us to understand the complete user journey, covering related metrics to invocation, memory, gateways, or prompting, which trace how requests flow through AI applications. This visibility optimizes AI application performance and identifies bottlenecks in complex agent workflows.
CloudWatch has developed from a basic metrics service to a comprehensive observability platform essential for modern cloud operations. The platform's strength lies in its deep integration, automated analysis, and ability to scale from simple monitoring to AI-powered operational intelligence.
I encourage you to explore CloudWatch systematically, starting with basic metrics and alarms, then adopting advanced features as your needs grow. The AWS CloudWatch documentation and Well-Architected Framework offer detailed guidance.
Effective monitoring is about deriving information that improves reliability, performance, and user experience. CloudWatch provides all the tools to do that and build better, more resilient systems.
If you want to become AWS-certified, I recommend taking our AWS Cloud Practitioner skill track, which covers everything you need to earn Amazon’s CLF-C02 certification.
AWS Courses
Track
Course
Course
blog
Tim Lu
10 min
blog
Laiba Siddiqui
15 min
Tutorial
Don Kaluarachchi
Tutorial
Joleen Bothma
Tutorial
Moez Ali
Tutorial
Vikash Singh