Course
Distance metrics are essential tools for measuring how far apart objects or points in space are from each other. These metrics play a big role in many fields, including machine learning, robotics, and geographic information systems. By quantifying distances, we can perform tasks such as pattern recognition, data clustering, and spatial analysis, which are important to both for-profit businesses and researchers alike.
Manhattan distance, also known as L1 distance or taxicab distance, stands out as a particularly useful measure for calculating distances in grid-like paths or between points in multidimensional spaces. Here we will look at both the mathematical foundation and also how to implement Manhattan distance in both Python and R.
 "Manhattan distance." Image by Dall-E.
Keep in mind, Manhattan distance is just one part of the broader topic of distance metrics, which appear time and again in all kinds of fields. To become an expert in distance-based learning, consider our Designing Machine Learning Workflows in Python course or our Cluster Analysis in R course, depending on your preferred language.
Defining Manhattan Distance
Manhattan distance is a metric used to determine the distance between two points in a grid-like path. Unlike Euclidean distance, which measures the shortest possible line between two points, Manhattan distance measures the sum of the absolute differences between the coordinates of the points. This method is called "Manhattan distance" because, like a taxi driving through the grid-like streets of Manhattan, it must travel along the grid lines.
Mathematically, the Manhattan distance between two points in an n-dimensional space is the sum of the absolute differences of their Cartesian coordinates.

The Manhattan distance formula incorporates the absolute value function, which simply converts any negative differences into positive values. This is crucial for calculating distance, as it ensures all distance measurements are non-negative, reflecting the true scalar distance irrespective of the direction of travel.
Calculating and Visualizing Manhattan Distance
As we have said, Manhattan distance is calculated by summing the absolute differences between the corresponding coordinates of two points. Let's now explore this with examples in 2D and 3D space.
2D example
Consider two points: A(1, 1) and B(4, 5):
- Calculate |x₁ - x₂| = |1 - 4| = 3
- Calculate |y₁ - y₂| = |1 - 5| = 4
- Sum the results: 3 + 4 = 7
Therefore, the Manhattan distance between A and B is 7 units.
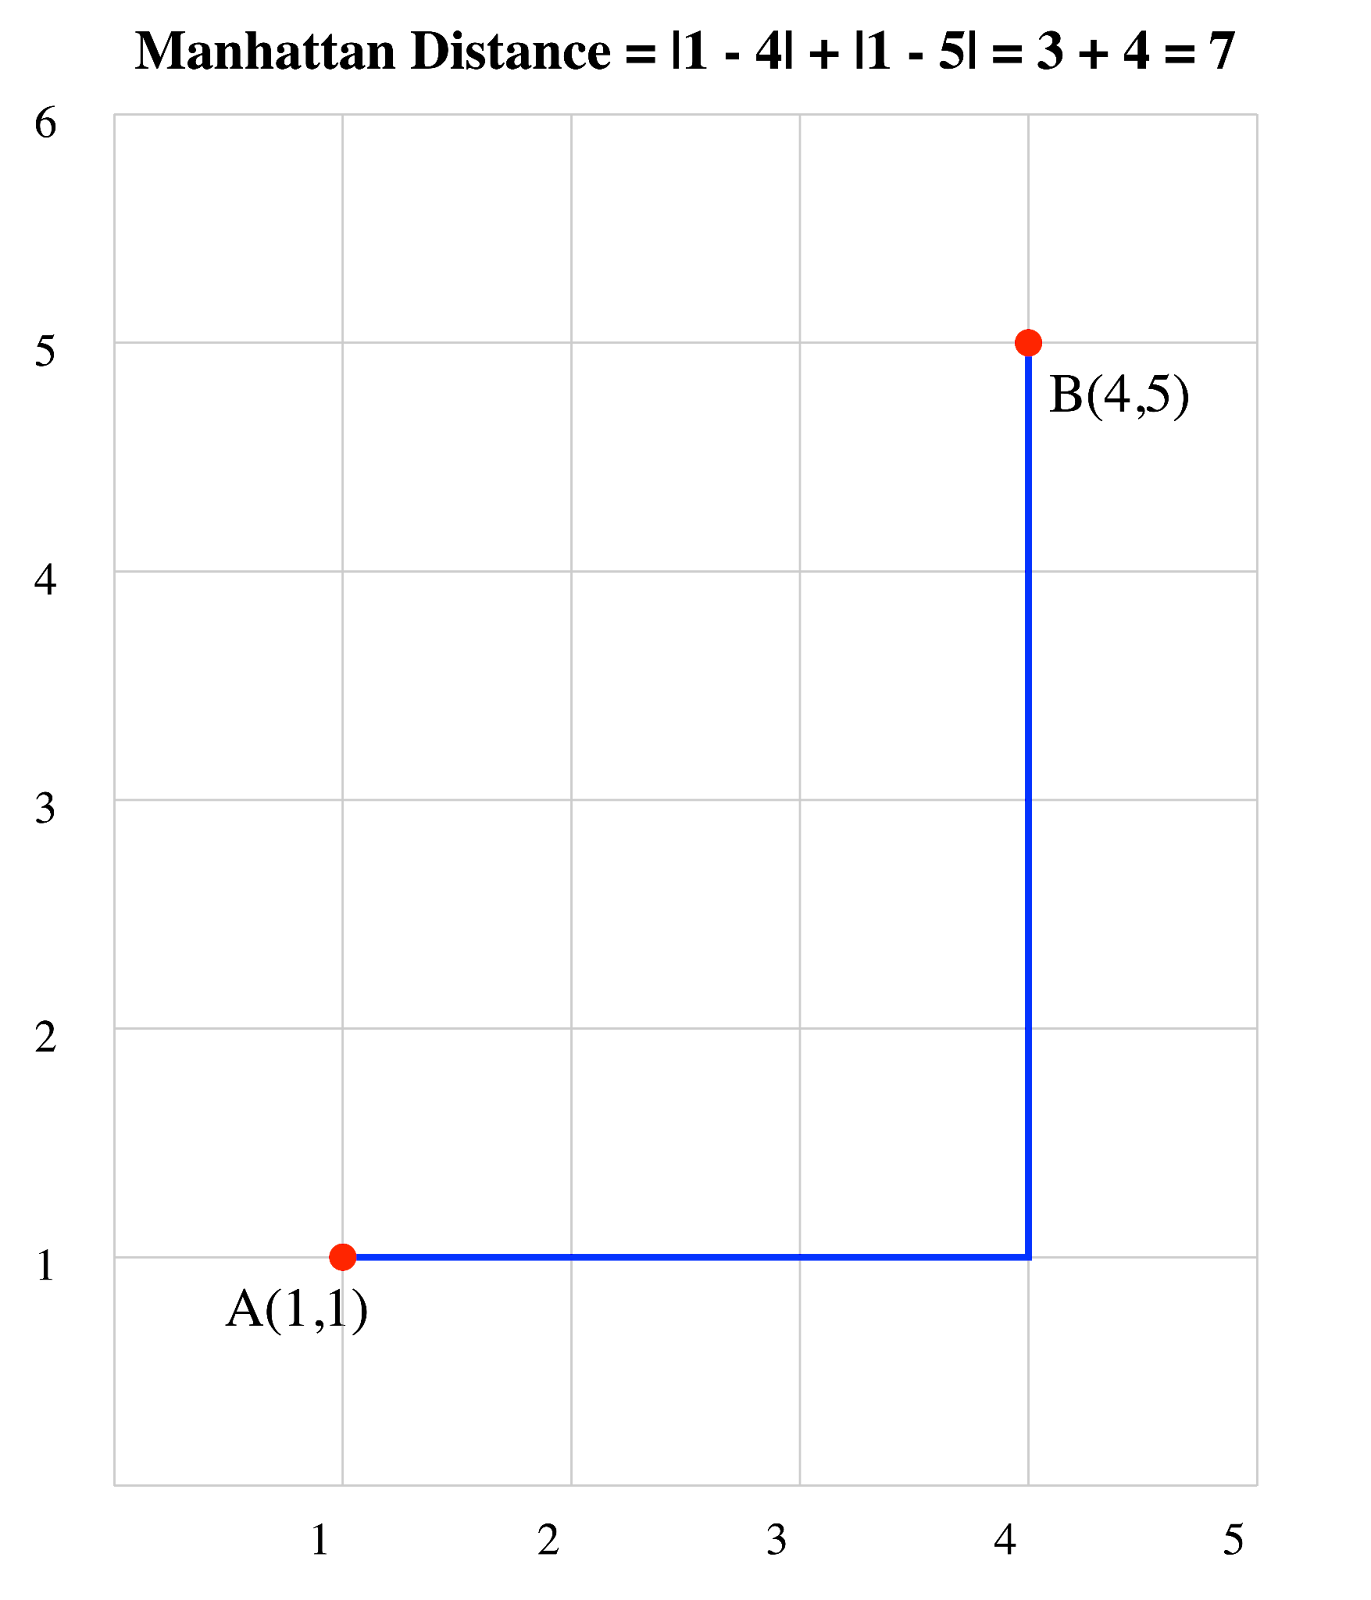 Manhattan distance of two vectors. Image by Author.
In this 2D grid, you can see that the Manhattan distance follows the path a taxi would take, moving only horizontally and vertically to get from point A to point B.
3D example
Now, let's consider two points in 3D space: A(1, 2, 3) and B(4, 5, 6):
- Calculate |x₁ - x₂| = |1 - 4| = 3
- Calculate |y₁ - y₂| = |2 - 5| = 3
- Calculate |z₁ - z₂| = |3 - 6| = 3
- Sum the results: 3 + 3 + 3 = 9
The Manhattan distance between these 3D points is 9 units.
Comparison with Euclidean distance
While Manhattan distance measures the path along grid lines, Euclidean distance measures the straight-line distance between two points or, "as the crow flies," as they say.
For our 2D example:
- Manhattan distance: 7 units
- Euclidean distance: √((1-4)² + (1-5)²) = 5 units
Here is a visual comparison between the Manhattan and Euclidean distances:
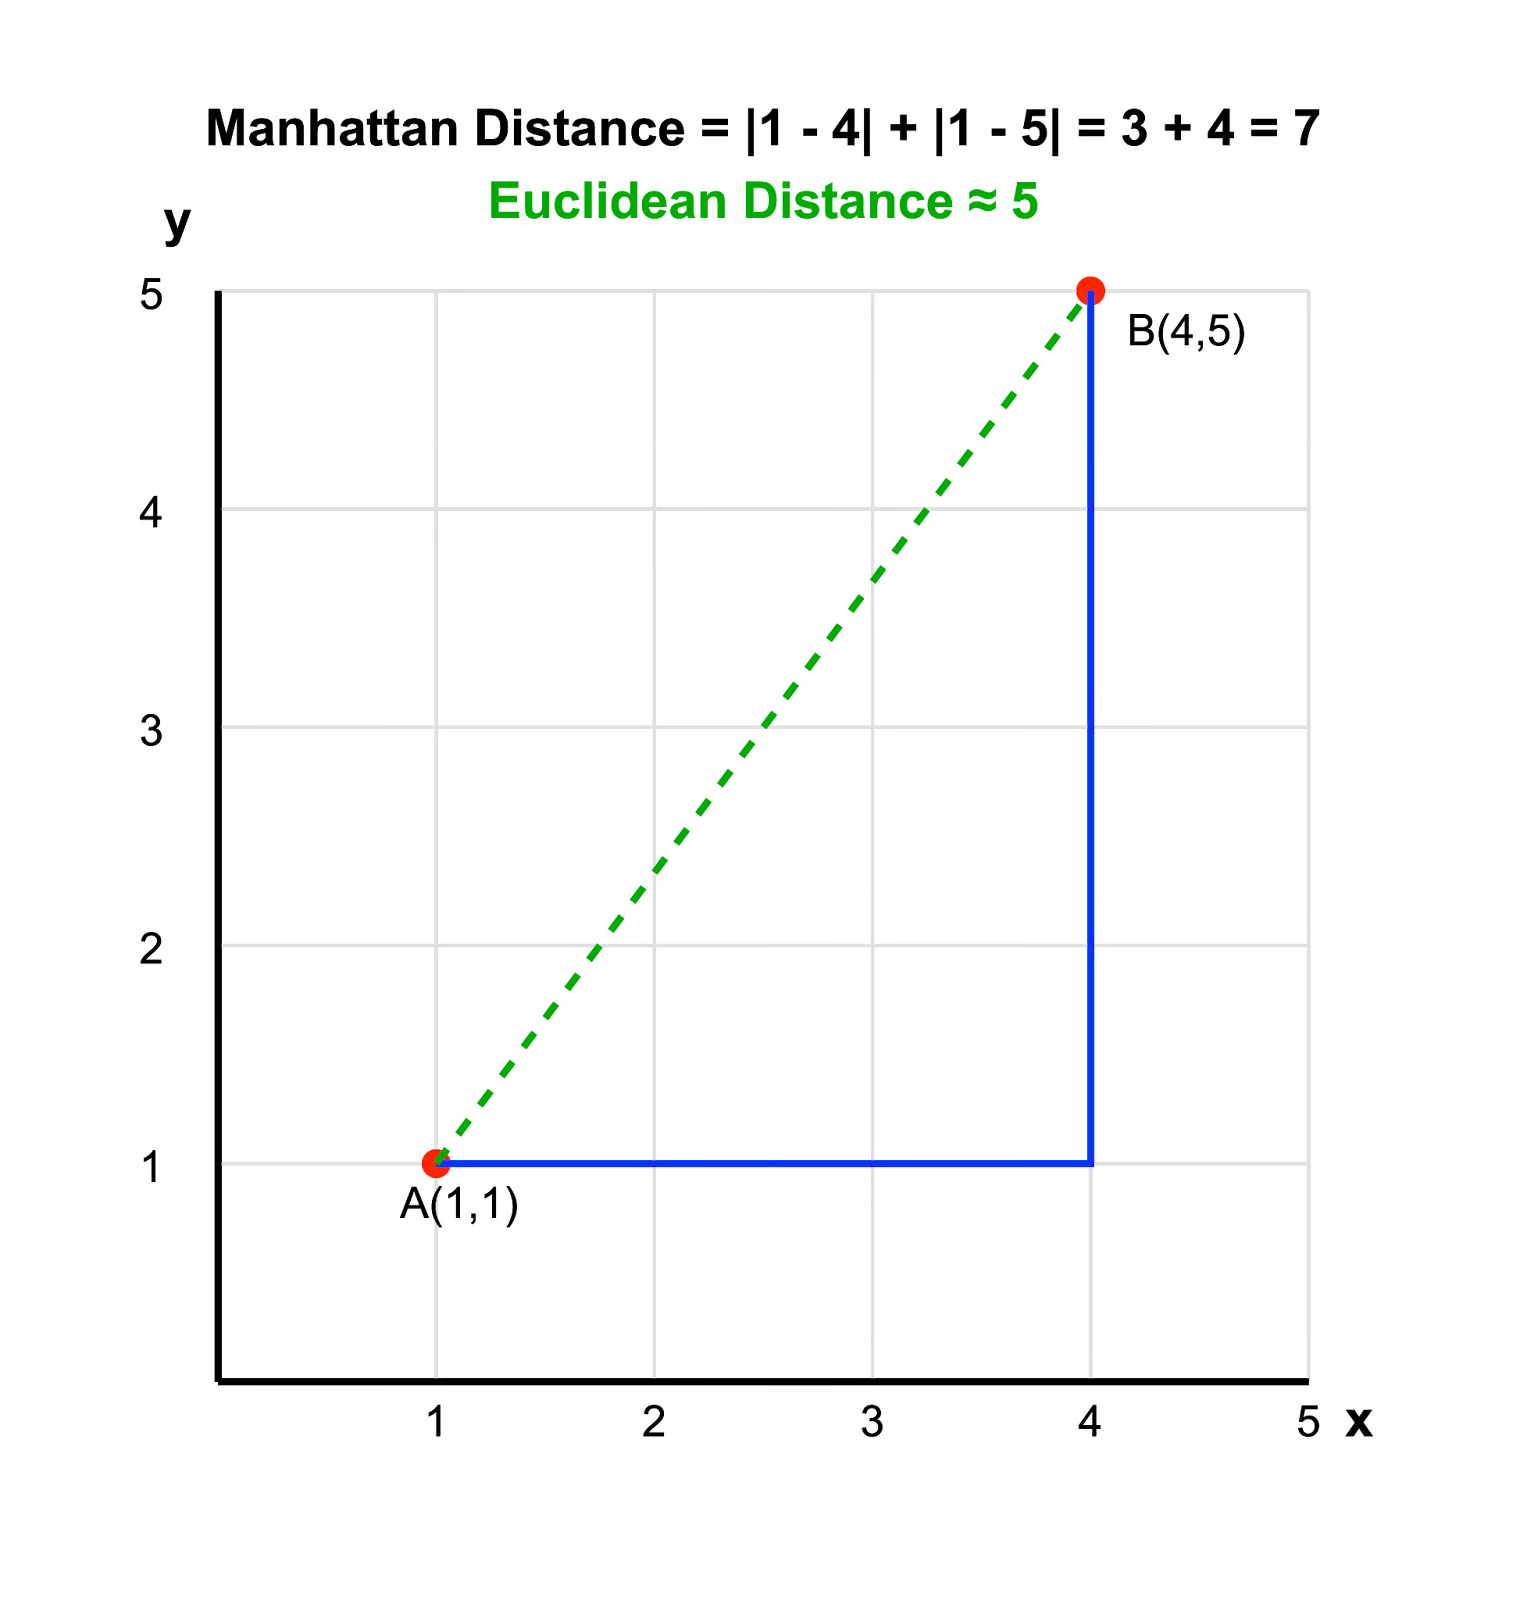 Manhattan distance vs. Euclidean distance. Image by Author.
In Euclidean space, Euclidean distance is always less than or equal to the Manhattan distance.
Choosing between Manhattan distance and Euclidean distance
Manhattan distance is particularly useful in scenarios where:
- Movement is restricted to grid-like paths (e.g., city blocks, circuit board layouts).
- Diagonal movement is not allowed or is more costly.
- You are working with high-dimensional data in machine learning, where it can be computationally more efficient than Euclidean distance.
- You are analyzing differences in discrete or ordinal data.
In contrast, Euclidean distance is more appropriate when:
- You are measuring physical distances in open spaces.
- You are working with continuous data where diagonal movements are equally valid.
Applications of Manhattan Distance
Manhattan distance finds applications in various fields of computer science, data analysis, and geospatial technology. Here are some key areas where Manhattan distance is particularly useful.
Pathfinding algorithms (e.g., A* algorithm)
In grid-based environments, Manhattan distance provides a quick and effective heuristic for estimating the distance between two points. It's particularly useful in the A* algorithm, where it can help guide the search towards the goal more efficiently in scenarios where movement is restricted to horizontal and vertical directions. Think about routing in city streets, maze-solving algorithms, and certain types of video game AI pathfinding.
Clustering techniques (e.g., K-Means clustering)
Manhattan distance can be used as a distance metric in clustering algorithms, particularly when dealing with high-dimensional data. In K-Means clustering, using Manhattan distance instead of Euclidean distance can produce better results, especially when dealing with sparse high-dimensional data or when outliers are present. Also, it's often preferred in text classification and document clustering due to its effectiveness with sparse vector spaces. The Manhattan distance's lower sensitivity to extreme values in individual dimensions can lead to more balanced clustering results in certain datasets.
Image recognition
Manhattan distance can be used to compare pixel values or feature vectors. It's particularly useful in template matching, where you're trying to find occurrences of a small image within a larger one. It is also valuable in facial recognition systems, object detection in video streams, or pattern matching in large image databases, where speed is crucial, and the slight loss in precision compared to Euclidean distance is often negligible.
Outlier detection
Manhattan distance can be used to identify data points that are significantly different from others in a dataset because it’s less sensitive to extreme values in individual dimensions compared to Euclidean distance. This property makes it useful in anomaly detection systems, such as those used in fraud detection or network security. In financial systems, for instance, Manhattan distance can help identify unusual transaction patterns without being overly influenced by extreme values in a single attribute, potentially leading to fewer mistakes.
Geographic Information Systems (GIS)
In GIS applications, Manhattan distance can model movement along a grid-like street network, making it useful for urban planning and logistics. It's used in location-allocation problems, such as determining optimal locations for facilities based on minimizing total travel distance in a city. Manhattan distance can also be applied in spatial analysis tasks, such as buffer zone creation around linear features like roads or rivers. Urban planners might use Manhattan distance to analyze the accessibility of public services, while logistics companies could employ it to optimize delivery routes in cities.
Mathematical Properties of Manhattan Distance
Manhattan distance possesses several important mathematical properties that make it particularly useful. Let's explore two key aspects: its metric space properties and its robustness to outliers.
Metric space properties
Manhattan distance is a true metric, which means it satisfies all four conditions required for a distance function in a metric space:
- Non-negativity: The distance between any two points is always non-negative. d(x, y) ≥ 0 for all x and y.
- Identity of indiscernibles: The distance between a point and itself is zero, and if the distance between two points is zero, they are the same point. d(x, y) = 0 if and only if x = y.
- Symmetry: The distance from point A to point B is the same as the distance from B to A. d(x, y) = d(y, x) for all x and y.
- Triangle inequality: The distance between two points is always less than or equal to the sum of the distances between those points and a third point. d(x, z) ≤ d(x, y) + d(y, z) for all x, y, and z.
Unlike cosine distance, which doesn't satisfy the triangle inequality, Manhattan distance's adherence to all these properties makes it useful in various mathematical and computational applications. For example:
- In optimization algorithms, the triangle inequality can be used to prune search spaces efficiently.
- In data structures like metric trees, these properties allow for faster nearest-neighbor searches.
- In machine learning, algorithms that rely on distance metrics (like k-nearest neighbors) can leverage these properties for theoretical guarantees and efficient implementations.
Enhanced outlier discrimination
Manhattan distance, with its linear summation approach, often provides enhanced discrimination of outliers compared to Euclidean distance, which squares the differences. This distinction arises because Manhattan distance accumulates the absolute differences in each dimension independently, reducing the overwhelming influence of large discrepancies in any single dimension.
Consider two points in a 2D space: A(0, 0) and B(10, 0). Now let's introduce an outlier point C with coordinates (0, 100):
- Manhattan distance between A and C: |0 - 0| + |0 - 100| = 100
- Euclidean distance between A and C: √((0 - 0)² + (0 - 100)²) = 100
- Manhattan distance between B and C: |10 - 0| + |0 - 100| = 110
- Euclidean distance between B and C: √((10 - 0)² + (0 - 100)²) ≈ 100.5
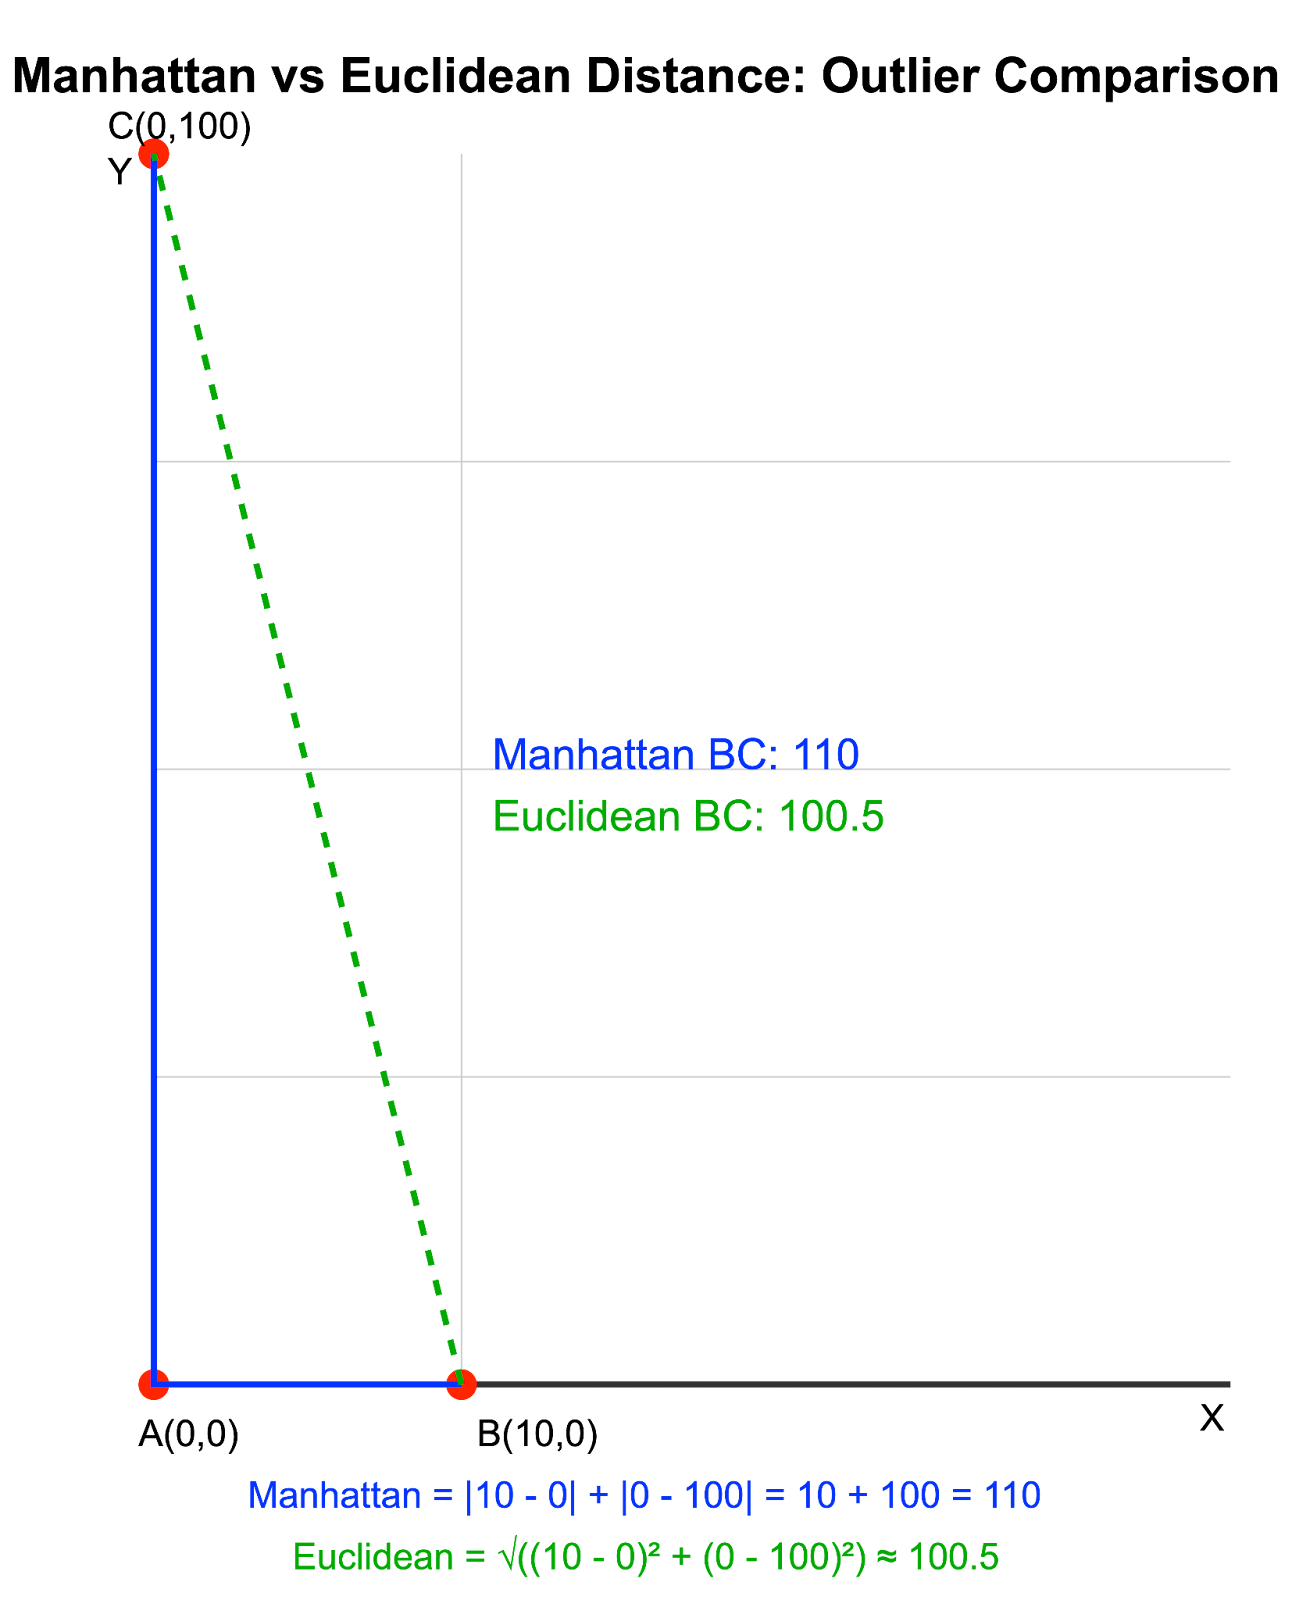 Manhattan vs Euclidean distance with outliers. Image by Author
In this example, the Manhattan distance clearly distinguishes between the distances AC and BC, while the Euclidean distance shows them as almost the same due to the dominant effect of the outlier in the y-coordinate.
This property makes Manhattan distance particularly useful in:
- High-dimensional spaces where outliers are common, such as in image processing or text analysis.
- Clustering algorithms where you want to reduce the impact of outliers on cluster centroids.
- Anomaly detection systems where you want to identify outliers without overly inflating their significance.
By being less sensitive to extreme values in individual dimensions, Manhattan distance can provide a more balanced measure of dissimilarity in many real-world datasets, especially those with noisy or imperfect data.
Manhattan Distance in Python and R
Here, we'll explore how to calculate Manhattan distance using Python and R. Each example will demonstrate different approaches, from custom functions to library methods.
Python examples
Python offers several ways to calculate Manhattan distance. Let's explore two different methods.
1. Calculation using NumPy arrays:
import numpy as np
point_a_np = np.array([1, 1, 1])
point_b_np = np.array([4, 5, 6])
distance_numpy = np.sum(np.abs(point_a_np - point_b_np))
print(f"Manhattan distance (NumPy): {distance_numpy}")
Output:
Manhattan distance (NumPy): 12This method uses NumPy arrays directly, which can be very efficient, especially when dealing with large datasets or when you're already working with NumPy arrays in your analysis.
2. Calculation using SciPy’s cityblock() function:
from scipy.spatial.distance import cityblock
point_a = (1, 1, 1)
point_b = (4, 5, 6)
distance_scipy = cityblock(point_a, point_b)
print(f"Manhattan distance (SciPy): {distance_scipy}")
Output:
Manhattan distance (SciPy): 12SciPy provides the cityblock() function, which calculates the Manhattan distance. This method is straightforward and efficient, especially when working with SciPy in your project.
R examples
R also provides multiple ways to calculate Manhattan distance. Let's examine two different approaches.
1. Creating a custom function
manhattan_distance <- function(x1, y1, x2, y2) {
  abs(x1 - x2) + abs(y1 - y2)
}
# Example points
point1 <- c(3, 5) # (x1, y1)
point2 <- c(1, 9) # (x2, y2)
# Calculate Manhattan distance between point1 and point2
distance <- manhattan_distance(point1[1], point1[2], point2[1], point2[2])
print(paste("Manhattan distance (custom function):", distance))
Output:
"Manhattan distance (custom function): 6"In this example, we create a custom function named manhattan_distance. This function takes the coordinates of two points as inputs and finds the Manhattan distance by adding the absolute differences of their respective coordinates.
2. Using the stats library
point_a <- c(1, 1, 1)
point_b <- c(4, 5, 6)
distance_builtin <- stats::dist(rbind(point_a, point_b), method = "manhattan")
print(paste("Manhattan distance:", distance_builtin))
Output:
"Manhattan distance: 12"In the second example, we utilize the dist() function from the stats package to calculate the Manhattan distance. This approach is useful when dealing with matrices or multiple points, as it simplifies the process significantly.
Conclusion
The importance of Manhattan distance lies in its simplicity, computational efficiency, and robustness to outliers in certain scenarios. Unlike Euclidean distance, Manhattan distance often provides more intuitive results in grid-based systems and can be more efficient to compute, especially in high-dimensional spaces.
What is more, Manhattan distance and other distance metrics appear in a wide variety of places. In addition to our Designing Machine Learning Workflows in Python course, which features a chapter on distance-based learning, and the Cluster Analysis in R course, which uses distance-based metrics for classification and dimensionality reduction, you can also check out our Anomaly Detection in Python course, which uses distance metrics for outlier detection and feature scaling.
Remember, the choice of distance metric can significantly impact the performance and results of your algorithms. By understanding when and how to use Manhattan distance, you're adding a powerful tool to your data science toolkit. Keep experimenting, learning, and pushing the boundaries of what's possible with distance-based algorithms!
As an adept professional in Data Science, Machine Learning, and Generative AI, Vinod dedicates himself to sharing knowledge and empowering aspiring data scientists to succeed in this dynamic field.
Frequently Asked Questions
How does Manhattan distance compare to Euclidean distance?
While Manhattan distance measures the path along grid lines (like city blocks), Euclidean distance measures the straight-line distance between two points. Manhattan distance is often more suitable for grid-based systems or high-dimensional data, while Euclidean distance is better for open spaces or continuous data.
Why is Manhattan distance called "taxicab distance"?
It's called taxicab distance because it represents the distance a taxi would drive in a city laid out in a grid-like pattern (like Manhattan), where the route consists of horizontal and vertical segments only.
What are the advantages of using Manhattan distance over other distance metrics?
Manhattan distance is computationally efficient, less sensitive to outliers in high-dimensional spaces, and often provides more intuitive results in grid-based systems. It's also a true metric, satisfying all four conditions required for a distance function in a metric space.
Can Manhattan distance be used for clustering in machine learning?
Yes, Manhattan distance can be used in clustering algorithms like K-means, especially when dealing with high-dimensional or sparse data. It can sometimes produce more robust results compared to Euclidean distance in these scenarios.
Can Manhattan distance be used with negative coordinate values?
Yes, Manhattan distance can be used with negative coordinates. The formula uses absolute values, so it works with any real numbers, positive or negative.

