Course
Introduction to Tableau
6 hr
319.5K
Nowadays, companies use data from different sources to solve their business problems. Efficiently collecting and combining data has become an essential skill for all Data Scientists and Data Engineers to assist organizations with smart decision-making.
This Tableau data blending tutorial will first build your understanding of the powerful data combination approach before exploring the benefits. Then we will explore some of its drawbacks and finally cover some of the top questions related to data blending using Tableau.
In real life, you will be dealing with information from multiple sources such as Excel Spreadsheet, SQL, CSV, etc. As a data scientist, you will often need to interconnect them to generate global business insights.
Tableau can help tackle this issue using different approaches: joining, blending, and relationships.
In this section, we will focus on understanding the difference between the first two approaches.
If you have been working with SQL before, you might be familiar with the main joins concepts: left, right, inner, cross, and full outer joins. The same applies when using Tableau.
These joins aim to combine different tables from the same source based on some logical column relationships between those tables. For instance, trying to combine an Excel file and a SQL table will break because they do not come from the same source.
Also, when joining tables, the columns used in the two tables must be the same and changing these data types lead the join to break.
Finally, it is not possible to remove duplicate columns from the joins in Tableau.
If you are not familiar with SQL, you can learn SQL with various courses that can help you acquire the fundamental skills to query your data in SQL.
Unlike joins and relationships, data blending aggregates data from multiple sources such as databases, business intelligence systems, cloud systems, flat files, web services, etc., to create a single data for better visualizations.
Tableau is a no-code Business Intelligence tool that provides an intuitive drag-and-drop interface for analytics and visualization. The non-technical aspect makes it stand out in the industry.
In addition, it is fast and provides the capability to interconnect data from multiple sources such as spreadsheets, SQL databases, web services, etc., whether from the cloud or on-premise.
Data blending with Tableau provides the same flexibility and makes it easier to combine data from multiple sources without any programming skills.
If this is your first time using Tableau, our Introduction to Tableau course can help you upskill and confidently explore Tableau to build impactful dashboards.
For a better understanding of the data blending concept, this section walks you through a step-by-step process to perform data blending with Tableau.
The case below is about analyzing the 2020 and 2021 revenues of two departments from Zoom.AI, an AI company that operates in different African capitals. The data is available at the following link.
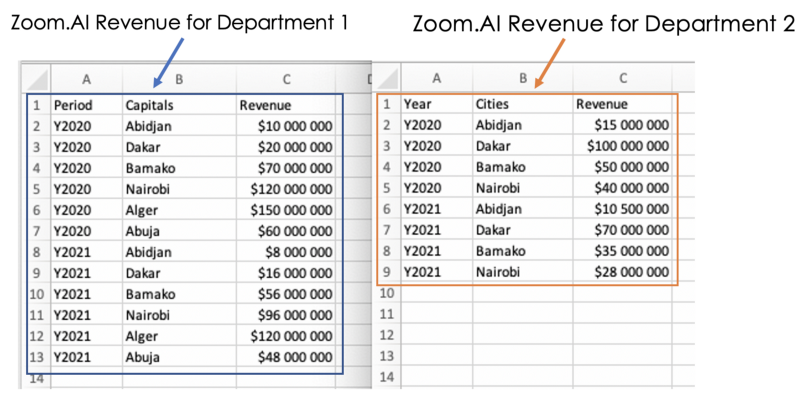
We notice that both data have the same format and convey the same message. However, the first two columns' names are different (Period, Capitals for Department 1, and Year, Cities for Department 2).
Trying to apply joins to the current format of the Data will fail because the columns involved in the join need to be the same. We will see how data blending can smartly combine those data without any prior column normalization.
Knowing that our data is stored in different files, we need to create a space in Tableau, where they can be regrouped, and that is done by creating Data Connections in Tableau as shown below:
Our departments' data appear in the Data tab, in the left-top corner, meaning they have been successfully uploaded.
Let’s start by visualizing how the Revenue varies per Capitals for the first department. This can be done with the following two steps:
The goal is to use data blending to compare the departments’ revenue. For this purpose, we need to perform the same drag and drop process for the second department’s data, which has the Cities column instead, as shown below.
The result for department 2 has been associated with orange color for clarification purposes.
The reason for that is that we haven’t specified to Tableau that the Capitals column has the same level of information as the Cities column, which leads to having the star signs for the Cities column in the visualization.
This is where data blending comes in handy by fixing such an issue, which can be done by specifying that the Cities and Capitals columns mean the same thing. Below is the illustration.
After we solved the issue, we can see an orange chain⛓ sign on the Cities column on the left. This means that the Cities column has been used as the linking field.
Now that you understand how to properly blend data, let’s perform the same analysis at the year/period level. To do so, we just need to create a link between the Period and Year columns; otherwise, we will face the same issue as the one before.
This covers the basics of data blending. Now that you know how to perform data blending, you can learn how to create advanced visualizations using Tableau with our course.
As you can observe from the previous tutorial, using data blending provides a lot of benefits compared to joins. Some of them are shown below:
We don’t need to perform any costly preprocessing of columns to be able to combine different data with data blending, because a simple specification of the columns of interest is enough for the data blending algorithm to understand how to efficiently combine the data.
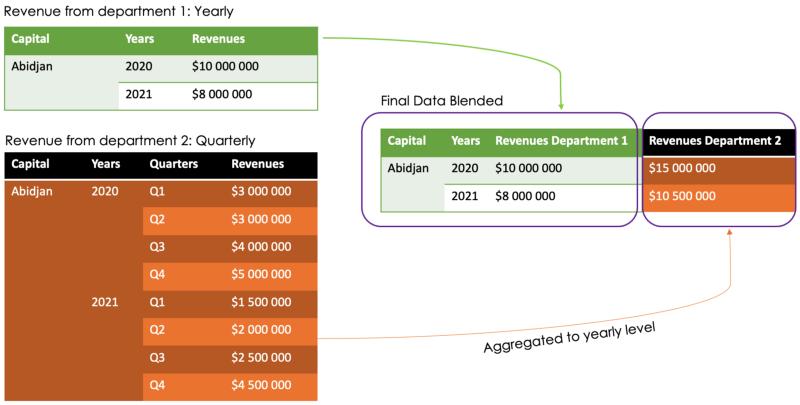
Data blending provides better flexibility when it comes to combining data with different levels of granularity. Let’s imagine that our departments' revenue data were organized at a monthly level instead of yearly.
Using simple joins will lead to an inaccurate result because the yearly rows will be duplicated for each monthly row, as illustrated below. data blending can solve this issue by aggregating the months' information to the yearly level.
Let’s consider the previous granularity case. Without data blending, we would have to perform some data preprocessing, such as aggregations and duplicate removal. When dealing with huge data sets, this kind of preprocessing can quickly become time-consuming.
Accurate decision-making relies on having a better overview of the data. It took a few clicks and drag and drop to capture the essence of the two departments. Using Joins could lead to inaccurate results, thus inaccurate decision-making.
Despite the advantages of data blending, it also has some downsides, as shown below:
This tutorial has covered the main aspects related to the motivations behind using data blending, some of its benefits for data scientists compared to joins, and also a hands-on practice to better understand how it works.
We hope this tutorial provides you with the relevant skills to get more insights into your business problem using multiple data sources. To find out more about connecting data in Tableau, check out our course.
Courses for Tableau
Course
Course
Course
blog
Wendy Gittleson
15 min
Tutorial
Eugenia Anello
Tutorial
Parul Pandey
Tutorial
Parul Pandey
Tutorial
Chloe Lubin
Tutorial
Parul Pandey