Track
Data is everywhere, but let's face it—spreadsheets and charts can make most people's eyes glaze over. This is where data storytelling becomes important in today's information-rich world. However, transforming complex data into clear, compelling narratives is often challenging.
Many struggle with time-consuming analysis, creating engaging visualizations, and crafting narratives that resonate with diverse audiences. These hurdles can often lead to missed insights and ineffective communication of data's value.
Generative AI offers promising solutions to these data storytelling challenges. By automating certain aspects and augmenting human creativity, it can streamline the process and enhance the quality of data narratives.
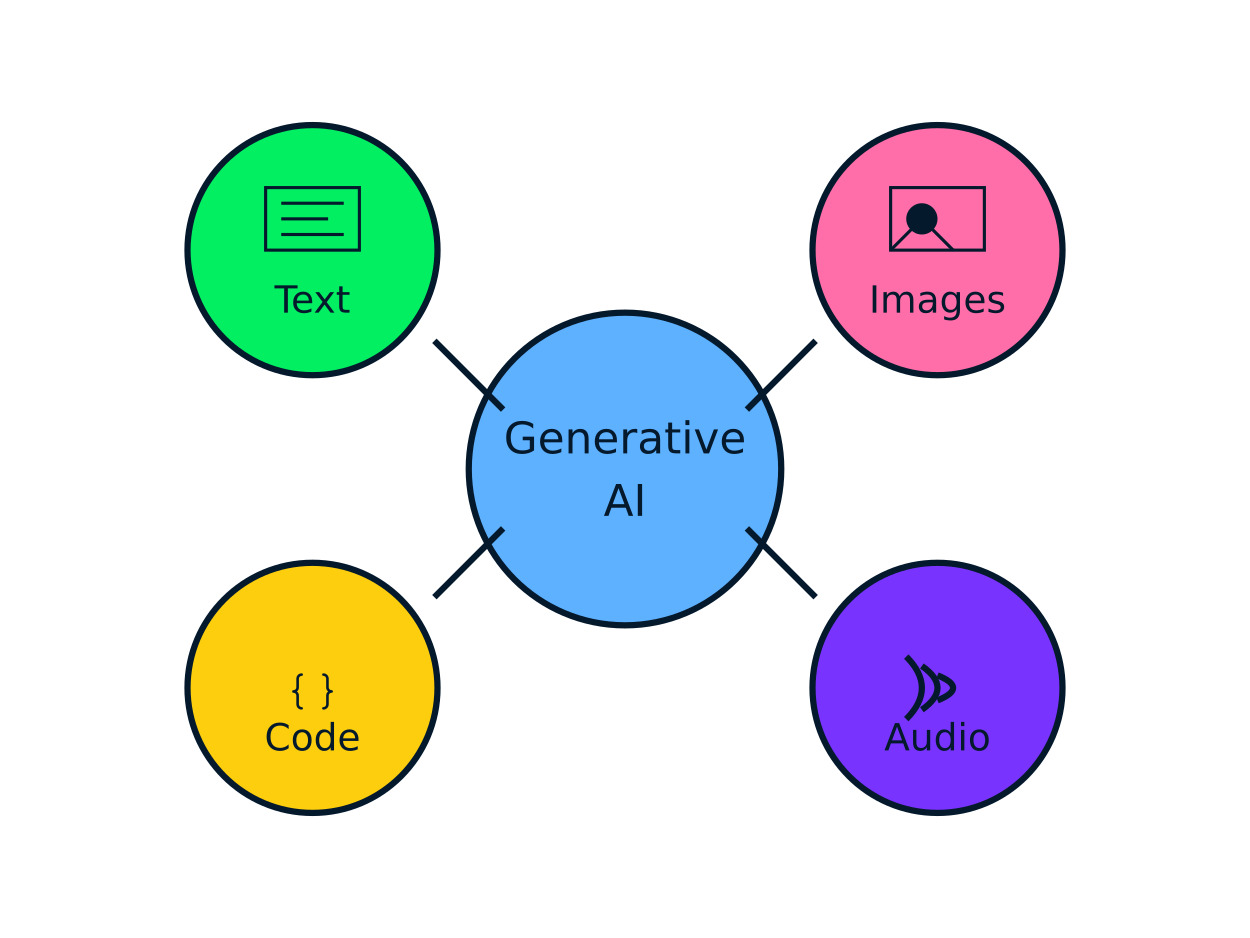
Use cases of Generative AI.
In this article, we will see some ways generative AI is changing data storytelling, making it more efficient, engaging, and impactful.
What is Data Storytelling?
Before we see how generative AI is changing data storytelling, let's understand what data storytelling is and why it's important in today's data-driven world. If you want to go into more detail, DataCamp’s Data Storytelling skill track is the ideal resource.
Data storytelling is the art of translating complex data into compelling narratives. It goes beyond a mere presentation of numbers and charts. It's about weaving data, visuals, and narrative into a cohesive story that resonates with your audience. Effective data storytelling makes information more accessible, memorable, and actionable.

Data Storytelling
Consider a company analyzing its customer churn rate. Instead of presenting a dry spreadsheet of figures, we might create a narrative that explores the reasons behind customer departures, visualizes trends over time, and suggests strategies for improvement. This approach makes the data more digestible and more impactful for decision-makers.
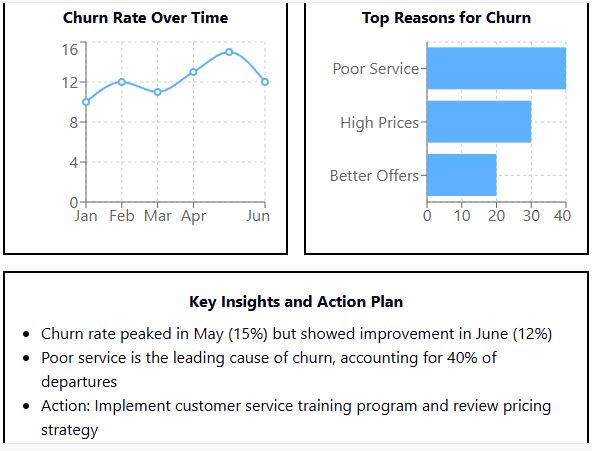
Data Storytelling: Customer Churn Analysis
This visualization demonstrates how data storytelling transforms raw churn data into a compelling narrative. It combines a trend graph, a reasons breakdown, and key insights with an action plan.
By presenting the data this way, the story of customer churn becomes clear and actionable. Decision-makers can quickly grasp the trends, primary issues, and potential solutions.
However, creating such insightful data stories can be challenging and time-consuming, especially when dealing with large and complex datasets. This is where generative AI comes into play, offering new ways to enhance and streamline the data storytelling process. You can learn more with our helpful Data Storytelling cheat sheet.
In the following sections, we'll see how Generative AI is changing data storytelling, making it more efficient, engaging, and impactful.
Generative AI for Data Storytelling
Data storytelling can help bridge the gap between complex analytics and human understanding. Generative AI is changing this field, offering new ways to interpret, visualize, and communicate data insights.

Data Storytelling with Generative AI
This diagram illustrates how generative AI enhances various stages of the data storytelling process, from insight discovery to visualization and narrative creation, all while keeping the human storyteller at the center of the process.
Generative AI is not replacing human creativity in data storytelling but rather augmenting it. It provides tools that allow data professionals to focus more on strategy and interpretation while automating many of the time-consuming aspects of data analysis and presentation.
In the following sections, we'll take a look at the specific ways to use generative AI for enhancing various aspects of data storytelling, from data preparation to creating personalized narratives.
1. Enhancing data visualization
As we've briefly seen how generative AI is changing data storytelling, let's see one of its most impactful applications in enhancing data visualization.
Generative AI acts as a co-pilot in the visualization process, augmenting human abilities with machine intelligence. By analyzing vast amounts of data and understanding context, AI can suggest ways to represent information that humans might not have considered. This synergy between human intuition and AI capabilities leads to more dynamic, interactive, and insightful visualizations.

Enhancing Data Visualization with Generative AI
AI analyzes your data and suggests the most appropriate chart type. For instance, Tableau's Ask Data feature might recommend a line chart for time-series data, a scatter plot for correlation analysis, or a bar chart.
Users can type queries like "Show me sales by region over time," and the AI will generate an appropriate visualization, such as a geographic map with time-series data. An example of one such query in Tableau is shown below.
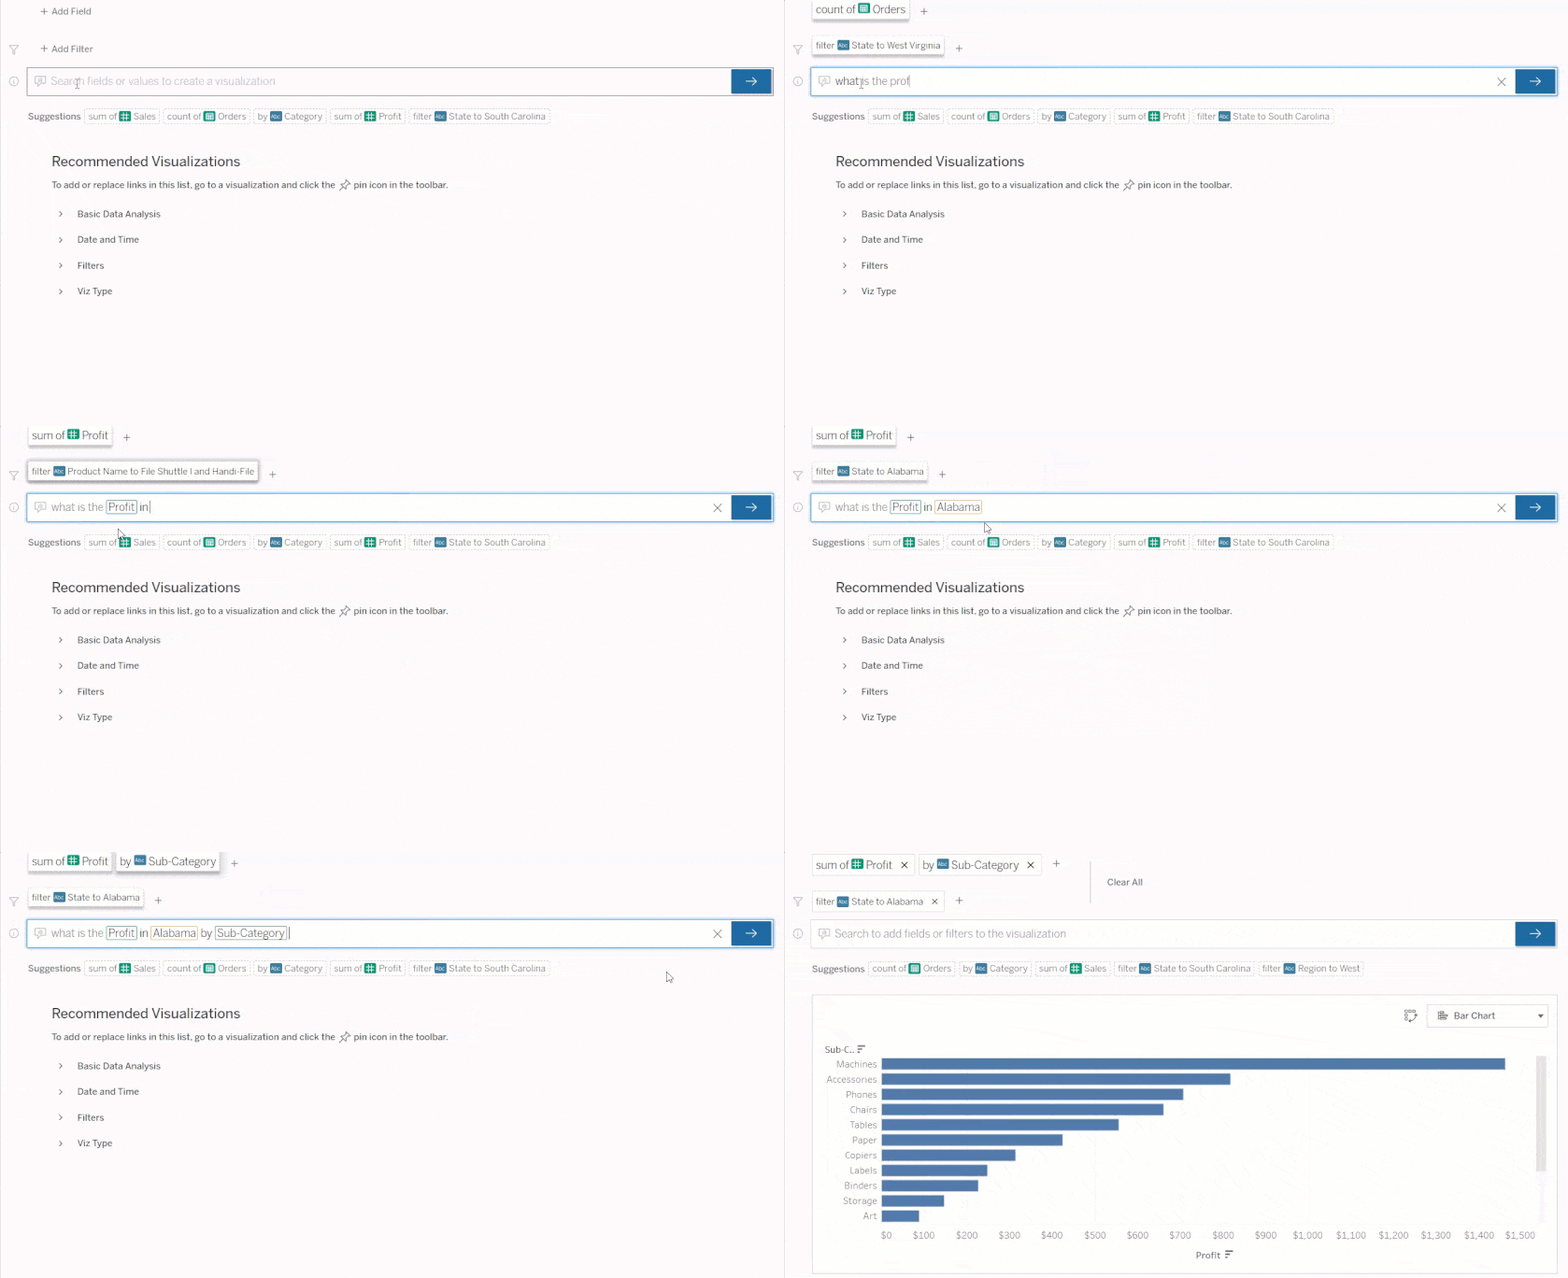
Data Visualization in Tableau from Natural Queries - Source
Power BI also has a similar feature known as ‘QnA’. This feature allows us to query our data through natural language sentences.
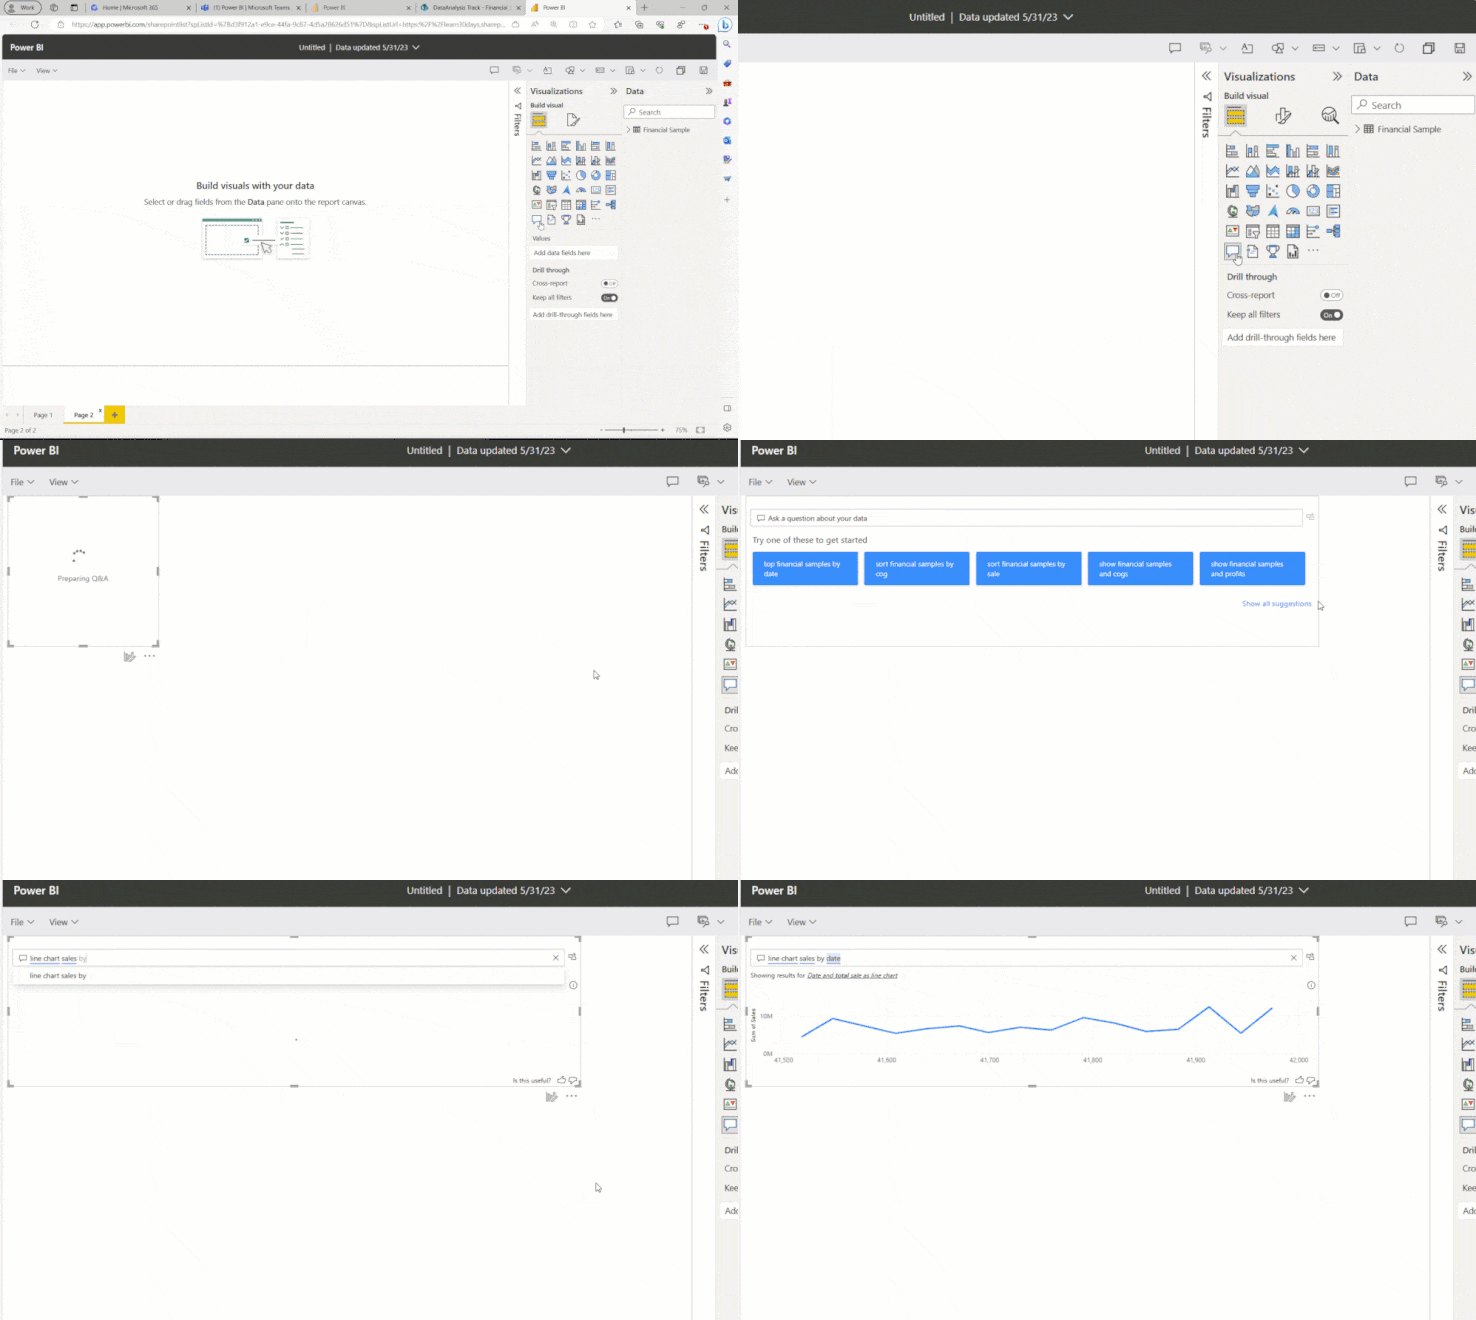
Data Visualization in PowerBI from Natural Queries - Source
Under the hood, Tableau and PowerBI utilize Generative AI to generate visualizations from the given dataset using natural language queries. Features like these help us to get quick insights into the data without much playing around with the tool.
Power BI has another feature called Co-pilot that takes data visualization to the next level. We can create complex visualizations using queries without much wrangling with the dataset. For example, if you have a sales dataset of your product, then you can find out the performance of the product sales with a query as shown below -
"Create a page to analyze the sales amount, revenue, and profit margin of different products, categories, and subcategories over time and across regions."
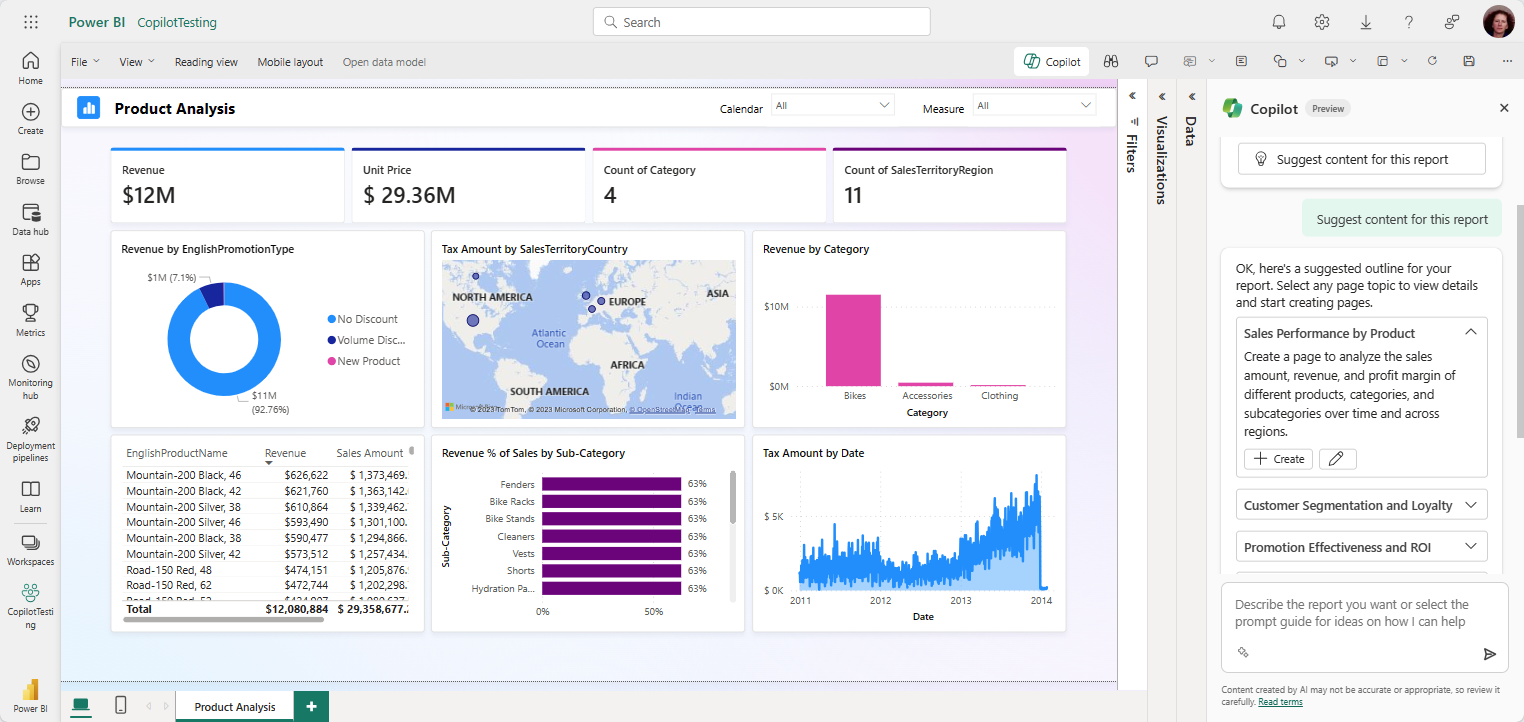
Dashboard generated from Query - Source
All these operations utilize Generative AI to calculate the values and create the required visualizations. By automatically highlighting trends and correlations, generative AI helps storytellers focus on the most impactful aspects of their data.
As we've seen, generative AI significantly enhances our ability to create compelling data visualizations. But the power of AI in data storytelling continues beyond there. In the next section, we'll look at how generative AI is changing another important aspect of data analysis: Data Preparation. This step is often the most time-consuming part of the data storytelling process, and AI is making it faster and more efficient than ever before.
2. Automating data preparation
Generative AI significantly enhances data visualization, making complex information more accessible and insightful. However, before any visualization can take place, data must be properly prepared - a process that is often time-consuming and tedious. This is where AI truly shines, changing the way we approach data preparation.
Data Preparation with Generative AI
Data preparation typically involves cleaning, transforming, and structuring raw data into a format suitable for analysis and visualization. Traditionally, this process could consume up to 80% of a data analyst's time. By using AI-powered tools, this balance is shifting dramatically, allowing analysts to focus more on deriving insights and crafting compelling narratives.
For example, DataRobot's autopilot mode uses AI to automatically detect and handle missing values, outliers, and inconsistencies in the data. It can also create new feature transformations based on the given data.
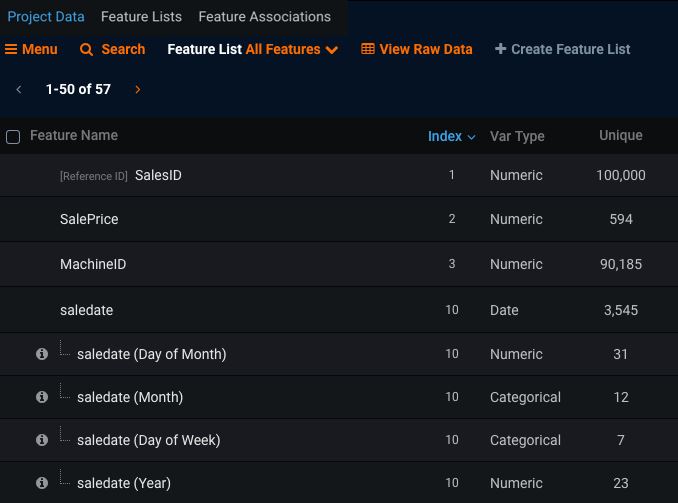
Data Preparation with AI - Source
In the above example, DataRobot's AI automatically handles data preparation as part of its modeling process, applying appropriate transformations based on the data's characteristics and creating new feature columns for all the date columns.
Feature engineering is also possible with AI. We can analyze relationships within the data and automatically create new features that might be relevant for analysis. For example, DataRobot's ‘Feature Discovery’ feature allows to do feature engineering to discover new features.

Feature Discovery with AI - Source
As we've seen, generative AI has transformed data preparation from a tedious chore into an intelligent, automated process. In the next section, we'll take a look at how generative AI takes this prepared data and weaves it into compelling narratives through automated language summaries.
3. Generating natural language summaries
Generative AI can significantly streamline the data preparation process. But what happens after the data is clean and ready for analysis? This is where another powerful application of Generative AI comes into play: Generating natural language summaries from complex datasets.
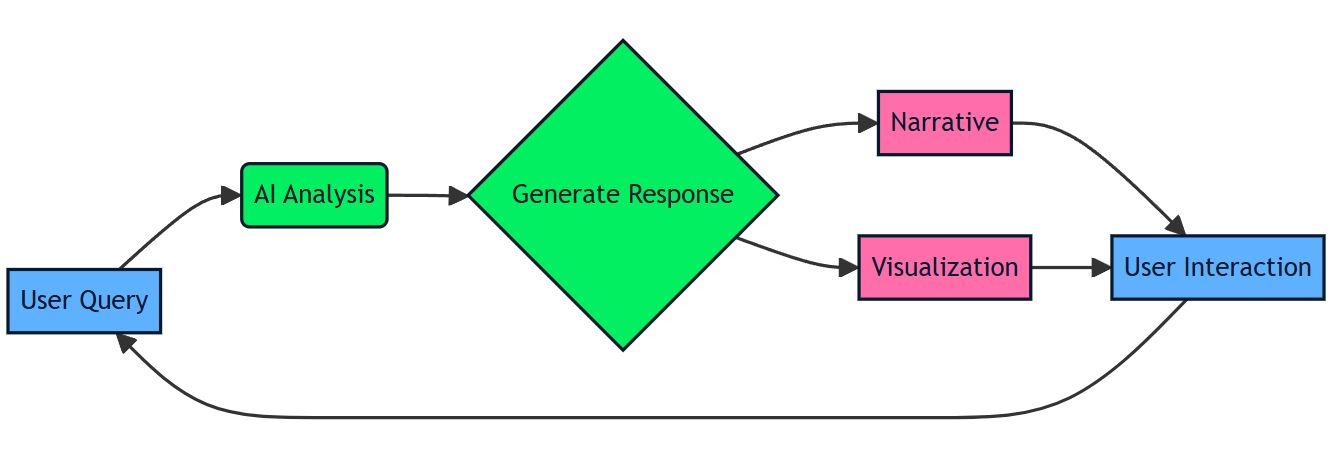
Generating Natural language Summaries with Generative AI
While clean, well-structured data is crucial for analysis, more is needed on its own to drive decision-making. Many stakeholders lack the technical expertise to interpret raw data or complex visualizations. This is where AI-powered natural language generation (NLG) becomes invaluable.
Generative AI can transform raw data into clear, concise narratives that highlight key insights, trends, and anomalies. These summaries serve as a bridge between complex datasets and human understanding, making data accessible to a wider audience within an organization.
For example, Arria NLG specializes in financial reporting, producing detailed summaries of complex financial data. It can generate detailed summaries of the insights from the dataset along with their visualizations. It can even generate personalized narratives based on the audience.
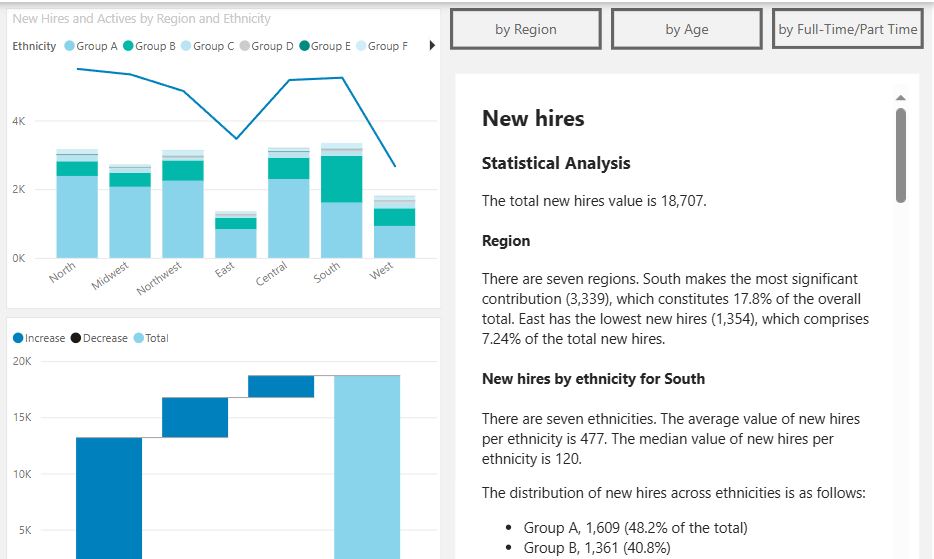
Natural Language Summary with Arria NLG - Source
Another tool that can generate summaries from the given datasets is Phrazor. It can generate visualizations along with insights from just a query.
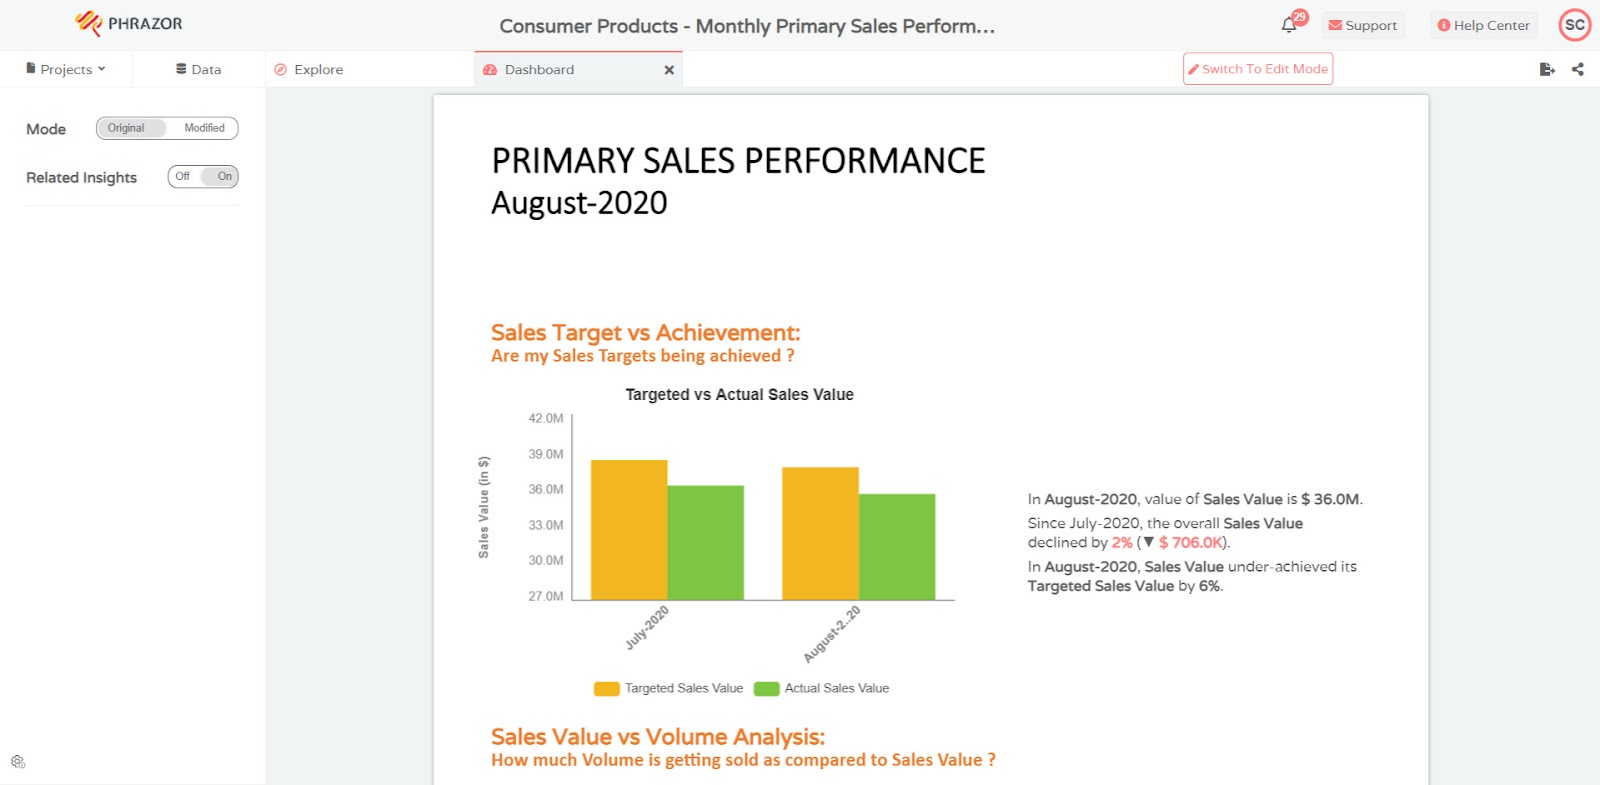
Natural language Summary with Phrazor - Source
By automating the creation of these summaries, data scientists and analysts can focus on more complex tasks that require human insight and creativity. Meanwhile, decision-makers receive clear, actionable insights without needing to dive into the raw data themselves.
In the next section, we'll see how generative AI is taking data storytelling a step further by creating interactive data dashboards that adapt to user needs and preferences.
4. Creating interactive dashboards
Interactive dashboards are powerful tools for data exploration and communication. They allow users to engage with data dynamically, uncovering insights that might not be apparent in static visualizations. Generative AI is changing this space by creating more intuitive, responsive, and personalized dashboard experiences.

Creating Interactive Dashboards with Generative AI
One of the key ways AI enhances dashboards is through intelligent data exploration. For instance, Luzmo's AI-powered dashboard generation can identify key questions to answer and create dashboards automatically, with no manual setup required. This approach saves time and uncovers insights that might have been overlooked in manual analysis. For those looking to quickly prototype dashboards, tools like Instachart come in handy. Created by Luzmo, Instachart is a free AI-powered tool that allows users to upload a dashboard screenshot, Figma mockup, or even a hand-drawn sketch and turns it into a working dashboard in seconds.
This AI-powered approach can significantly speed up the dashboard design process, allowing teams to iterate quickly on their data visualization ideas.
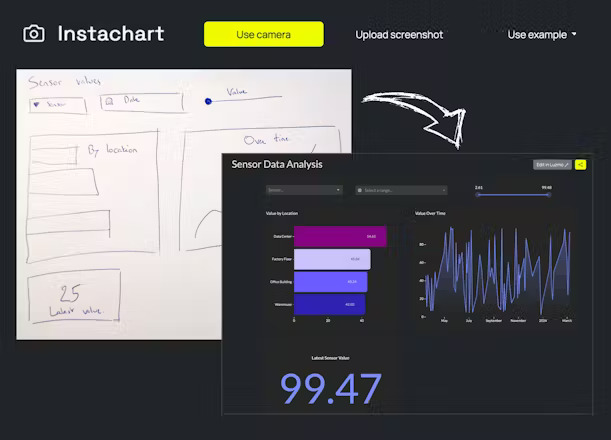
Creating Dashboard from a hand-drawn sketch with Instachart - Source
One of Instachart's key features is its ability to automatically generate dummy data for the dashboard, providing a realistic preview of how the final product might look. Users can easily replace this dummy data with their metrics when ready.
Instachart eliminates the need for coding in the initial stages. It helps product builders rapidly move from concept to prototype, making data visualization more accessible and efficient.
5. AI storytelling assistants
Generative AI can act as a collaborative partner for data analysts and storytellers, helping to brainstorm narrative angles, suggest compelling hooks, and even draft sections of the story based on the data provided.
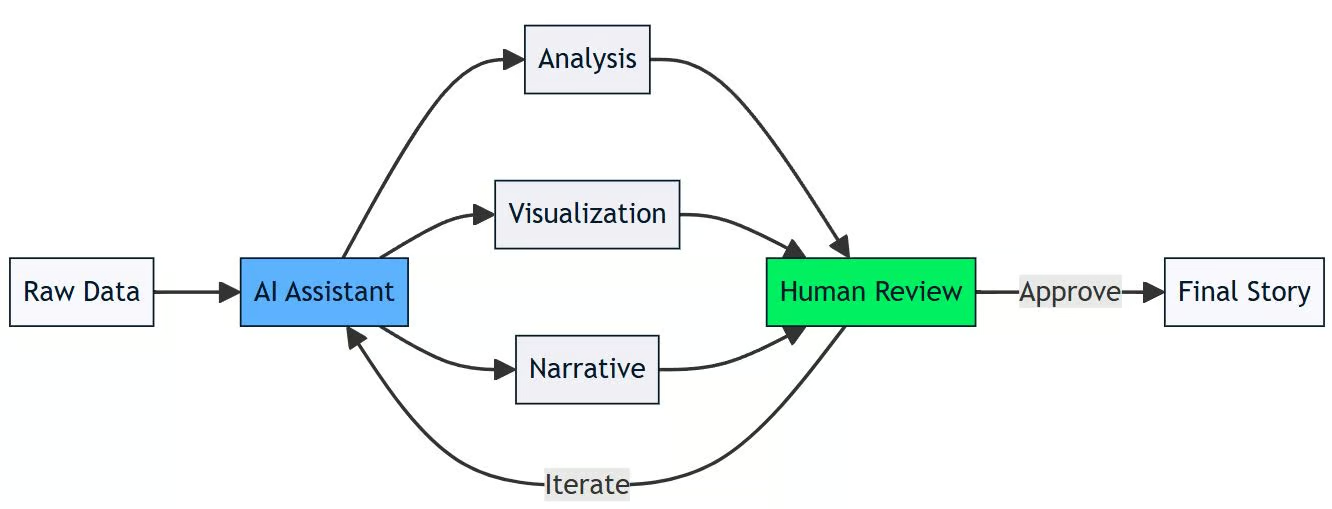
AI Data Storytelling assistant
This concept of a data storytelling assistant demonstrates how generative AI can be integrated into the data analysis and storytelling process. We explore the concept more in our webinar on data storytelling.
The diagram above illustrates the key components and workflow:
These tools significantly speed up the process of turning raw data into compelling narratives. It allows data analysts and journalists to focus on refining the story, adding human insight, and ensuring the final product meets their standards through the iterative review process.
For example, Data Analyst by ChatGPT is one such assistant that can analyze our dataset and give key insights from the dataset. It can perform several other operations, such as creating charts, giving recommendations for making business decisions, etc.
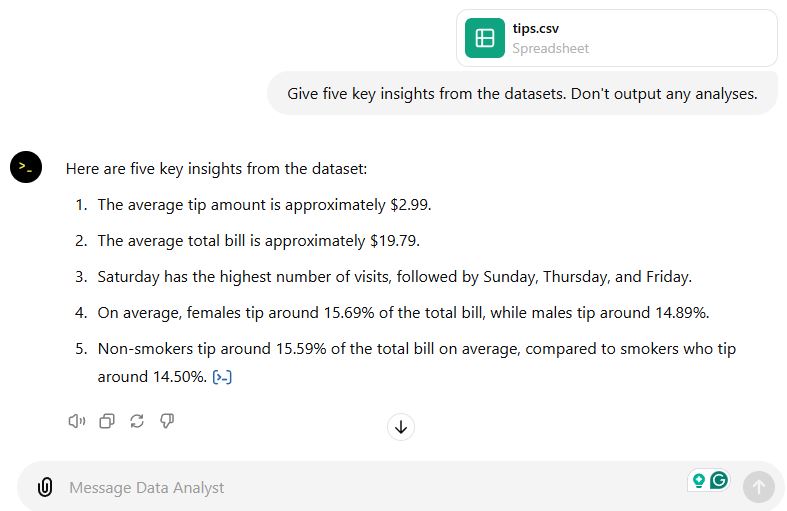
Data Analyst chat assistant by ChatGPT
6. Enhancing AR/VR data visualizations
Generative AI can enhance AR/VR data visualizations by crafting narratives around the data, guiding users through the information with contextual explanations, and highlighting key insights.
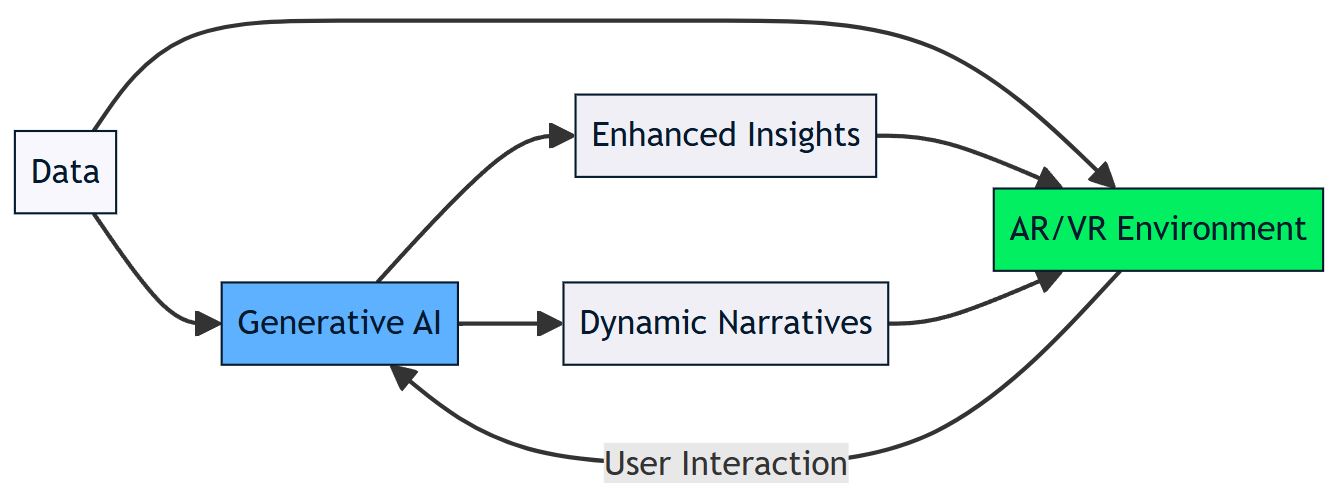
Generative AI enhanced AR/VR data visualization
This technology also enables natural language interactions, allowing users to query and manipulate data using voice commands within the AR/VR environment.
For instance, Flowimmersive creates interactive data visualizations using Augmented Reality(AR). It uses Generative AI tech like LLMs to derive insights from the dataset and present it in the AR.
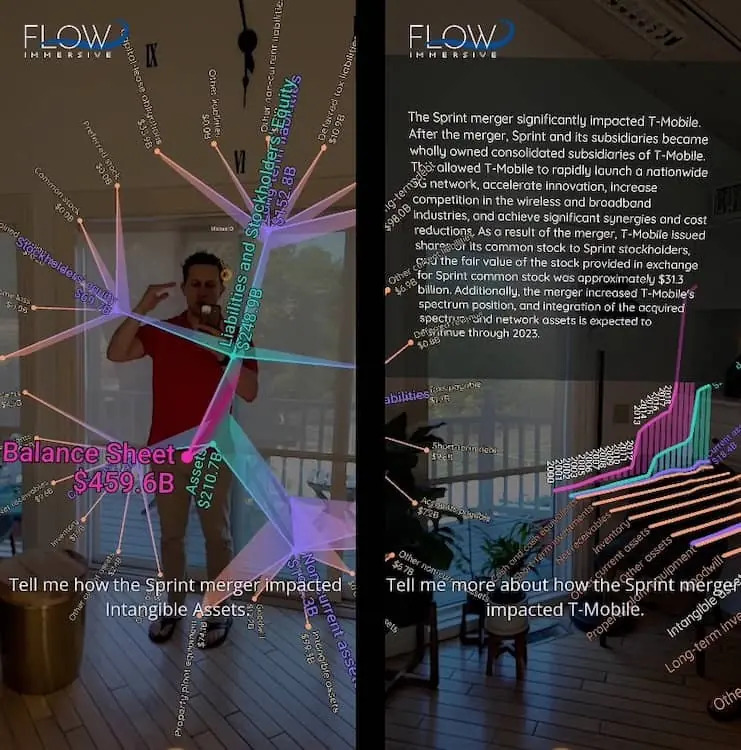
Generative AI enhanced AR data visualization - Source
Conclusion
Generative AI is transforming data storytelling, offering powerful tools to enhance how we interpret, visualize, and communicate insights. From automating preparation to creating personalized narratives, AI empowers analysts to unlock deeper value from data.
The six approaches we've explored in this article demonstrate the potential of human-AI collaboration in crafting more compelling and impactful data stories. While AI serves as a powerful ally, human oversight remains crucial.
As organizations navigate an increasingly data-driven world, mastering AI-enhanced data storytelling will provide a significant advantage, enabling the communication of complex insights with unprecedented clarity and persuasion. The future of data storytelling lies in this balanced partnership between human expertise and AI capabilities.
You can learn more about the various technologies and methods we’ve covered in this post on DataCamp with the following resources:
AI Data Storytelling FAQs
What is AI data storytelling?
AI data storytelling uses artificial intelligence to analyze, interpret, and present data insights in narrative form.
How does AI improve data visualization?
AI enhances data visualization by automatically generating relevant, interactive, and personalized charts and graphs.
Can AI replace human analysts in data storytelling?
No, AI augments human expertise rather than replacing it, enhancing efficiency and uncovering deeper insights.
What's the biggest advantage of using AI in data storytelling?
The biggest advantage is the ability to quickly process vast amounts of data and identify meaningful patterns and trends.
How does AI personalize data narratives?
AI tailors data stories to different audiences by adjusting language, detail level, and focus based on the recipient's role and preferences.
I am a data science content writer. I love creating content around AI/ML/DS topics. I also explore new AI tools and write about them.


