Course
If you are an aspiring data analyst, data scientist, economist, quantitative analyst, or machine learning engineer, R is for you. For me, R opened up a whole world of possibilities in the area of statistical programming. I learned that there are many forms of analysis and statistics that can practically only be done in a programming environment, and for that, R is, in my opinion, the best.
Here, I will share everything you need to know to learn R, including a step-by-step guide and learning plan. I will also include some of the most useful resources to help you succeed.
You will notice, throughout the article, that I link our DataCamp resources for how to get started, like our comprehensive and popular Introduction to R course as a great, general option. The reason is simple: DataCamp is the best platform out there for learning R. As you get better, you can transition to harder material, like our Intermediate R course, which is a perfect transition after our introductory version. Stick with us, and in no time, you will be an expert.
Your Path to Mastering R
What is R?
R is a high-level, interpreted programming language created by Ross Ihaka and Robert Gentleman. It was first released in 1993 as a successor to the S programming language. It is designed with an emphasis on statistical computing and graphics, making it a popular choice for data analysis, statistical modeling, and visualization. R is widely used in academic and research environments, though its applications extend beyond these fields.
R supports multiple programming paradigms, including procedural, object-oriented, and functional programming. In simpler terms, this means it’s flexible and allows you to write code in different ways, whether that's like giving the computer a to-do list, creating digital models of things or concepts, or treating your code like a math problem.
Why is R Popular?
Over the years, R has gained a strong following in the data science and research communities due to its extensive libraries, simplicity, versatility, and powerful data visualization capabilities. These reasons also mean it is a highly favored language for data science as it allows data scientists to focus more on data interpretation rather than language complexities.
Let’s have a close look at some of the R features that make it such a versatile and widely-used programming language:
-
Readability: R is known for its clear and readable syntax.
-
Easy to Learn: R’s readability and comprehensive documentation make it relatively easy for beginners to pick up.
-
Versatility: R is not limited to one type of task. Whether you're interested in statistical modeling, data visualization, bioinformatics, or machine learning, R has the tools to help you get there.
-
Rich Library Support: R comes with a large standard library that includes pre-written code for various tasks, saving you time and effort. Also, R's community has developed thousands of third-party packages, which extend R's functionality even further.
-
Platform Independence: One of the great things about the language is that you can write your code once and run it on any operating system, which is great for teamwork and reproducibility.
-
Interpreted Language: R is an interpreted language, which means the code is executed line by line. This can make debugging easier because you can test small pieces of code without having to compile the whole program.
-
Open Source and Free: R's source code is freely available and can be distributed and modified. This has led to a large community of developers contributing to its development and creating a vast ecosystem of R packages.
- Dynamically Typed: R is dynamically typed, meaning you don't have to declare the data type of a variable when you create it. The R interpreter infers the type, which makes the code more flexible and easy to work with.
Personally, I also like that R is built on top of the linear algebra libraries of Fortran, so you can do things like simple linear regression without having to install any packages.
Why You Should Learn R
Learn R for Machine Learning
There is a demand for R skills
Companies of every size in every industry recognize more and more the value of data analytics and statistical modeling for making informed decisions and gaining advantages. Because R is a leading language for this purpose, it is showing up in more and more places.
Organizations use R to extract insights from large datasets, build predictive models, and create visualizations that drive strategic decisions. There is a surge in job opportunities for professionals proficient in R, particularly in sectors like finance, healthcare, and marketing. Universities and research institutions also use R extensively for teaching and conducting advanced research, fueling the demand for educators and researchers with R skills.
Basically, there's a feedback loop happening where R's versatility and flexibility contribute to its demand. Developers write code and create packages, and the vast ecosystem of new R packages extends its functionality even further. R now covers pretty much every application, everything from machine learning and data mining to spatial analysis and time series forecasting.
R has a variety of applications
Here are some key areas where R is extensively used. This, of course, is not an exhaustive list.
- Scientific Research: R is widely used in scientific studies for data analysis and statistical modeling. Researchers use R to analyze experimental data, perform simulations, and publish reproducible research.
- Healthcare and Bioinformatics: In healthcare, R is used to analyze clinical trial data, patient records, and genomic data. Bioinformaticians use R for sequence analysis, gene expression studies, and computational biology.
- Finance and Economics: Financial analysts and econometricians use R for quantitative analysis, risk management, and economic forecasting.
- Marketing and Customer Analytics: R helps marketing analysts understand customer behavior, segment markets, and optimize marketing campaigns.
- Environmental Science: Environmental scientists use R to analyze ecological data, model climate change, and study biodiversity.
- Social Sciences: In the social sciences, R is used for survey analysis, psychometrics, and social network analysis.
- Engineering: Engineers use R for quality control, process optimization, and predictive maintenance.
Many popular jobs require R
Now, let's link the applications of R to jobs more specifically:
Job Role | Key Skills Summary |
---|---|
Data Scientist | Machine learning, statistical analysis, data visualization, communication |
Data Analyst | Statistical analysis, data visualization tools, data cleaning |
R Developer | Shiny, data manipulation, data visualization, version control |
Machine Learning Engineer | Machine learning algorithms, machine learning frameworks, data preprocessing |
Statistician | Statistical analysis, experimental design, survey methodology, data visualization |
Bioinformatician | Sequence analysis, data visualization, statistical modeling, computational biology |
Econometrician | Econometrics, statistical analysis, forecasting, data modeling |
Research Scientist | Experimental data analysis, statistical modeling, scientific simulations |
Clinical Data Analyst | Clinical trial analysis, patient data management, statistical modeling |
Financial Analyst | Quantitative analysis, risk management, financial modeling |
Marketing Analyst | Customer behavior analysis, market segmentation, campaign optimization |
Sociologist | Survey analysis, social network analysis, psychometrics |
Academic Researcher | Experimental design, statistical analysis, data visualization, reproducible research |
How Long Does it Take to Learn R?
The time it takes to learn R depends on your goals and dedication. For basic proficiency, such as understanding R syntax and using fundamental packages, you can expect to invest around 1–2 months of consistent study. If your goal is to apply R to specific domains like data analysis, visualization, or machine learning, plan for 3–6 months of focused practice. Mastery of advanced techniques, such as statistical modeling or creating R packages, may take a year or more, depending on the complexity of the projects you tackle. Regular practice and application in real-world scenarios can significantly shorten your learning curve.
Learning Goal | Timeframe | Key Focus Areas |
---|---|---|
Basic Proficiency | 1–2 months | Understanding syntax, data structures, and essential packages like tidyverse . |
Intermediate Skills | 3–6 months | Data visualization, statistical modeling, and creating reproducible reports. |
Advanced Applications | 6–12 months or more | Specialized fields like machine learning, bioinformatics, or creating R packages. |
Expert Mastery | 1 year or more | Tackling complex projects, optimizing code, and contributing to the R ecosystem. |
A Sample One-Year R Learning Plan
Learning R can will be easier with a structured plan. Here, I'll break it down into manageable pieces.
Month 1: Laying the foundation
-
Core Basics: Install R and RStudio and explore their interfaces. Learn basic R syntax, arithmetic operations, and how to write simple scripts.
-
Learn R Data Structures: Understand vectors, matrices, lists, and data frames. Practice creating, accessing, and manipulating these structures.
-
Essential Functions: Learn to use built-in functions for basic tasks like sorting, filtering, and aggregating data.
Month 2: Building core skills
-
Data Manipulation: Master the
dplyr
package for filtering, summarizing, and transforming data. Usetidyr
to reshape and clean data. -
Data Visualization: Start creating visualizations with the
ggplot2
package, including bar plots, line charts, and scatterplots. -
Control Flow and Functions: Understand loops (
for
,while
) and conditional statements (if
,else
). Begin writing custom functions to automate tasks.
Months 3–4: Gaining intermediate proficiency
-
Statistical Analysis: Perform descriptive statistics and hypothesis testing (e.g., t-tests, ANOVA). Learn simple regression analysis.
-
Real-World Data Handling: Import and export data in formats like CSV, Excel, and SQL. Handle missing data and perform data cleaning.
-
Reproducible Reporting: Create R Markdown documents for polished, integrated reports.
Months 5–6: Exploring advanced topics
-
Machine Learning Foundations: Experiment with libraries like
caret
ortidymodels
for basic predictive modeling. -
Time Series and Spatial Data: Learn to analyze time-series data using
forecast
ortsibble
. Explore spatial analysis withsf
andraster
. -
Debugging and Optimization: Use RStudio tools to debug code and optimize it with vectorized operations.
Months 7–12: Achieving expertise
-
Domain-Specific Applications: Focus on applying R to specific fields like finance, bioinformatics, epidemiology, or marketing. Build custom R packages to extend functionality and share your work.
-
Collaboration and Contributions: Learn Git and GitHub for version control in collaborative projects. Contribute to open-source R packages or datasets.
-
Advanced Topics: Explore advanced statistical modeling and simulations. Work on large-scale projects to deepen your expertise.
How to Find a Job That Uses R
Landing a job in the above list of jobs looks very enticing. With dedication, consistent learning, and a proactive approach, you can land your dream job that uses R. Here are some guidelines that I hope will help:
Keep learning about the field
Stay updated with the latest developments in R specifically and data science and AI more generally. One great resource is DataCamp's own DataFramed podcast, which has great episodes like Election Forecasting and Polling featuring Professor Andrew Gelman at Columbia, a well-known avid R user, or this other episide on Data Science, Epidemiology and Public Health, which is another great fit for R users because R is the leading programming language choice in epidemiology and public health. Another interesting recent episode I recommend: Increasing Diverse Representation in Data Science with Nikisha Alcindor, the President and Founder of the STEM Educational Institute (SEI).
Subscribe to DataFramed
Subscribe to DataFramed wherever you get your podcasts.

Get a certification to showcase your skills
One effective way to demonstrate your expertise in R is by obtaining a certification from DataCamp, which are highly regarded in the industry. These certifications not only validate your skills but also show your commitment to continuous learning and professional development. Check out our Data Analyst Certification and Data Scientist Certification.
Get certified in your dream Data Analyst role
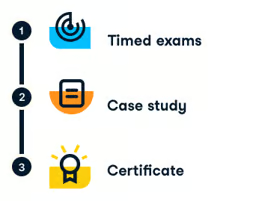
Our certification programs help you stand out and prove your skills are job-ready to potential employers.

Develop a portfolio
Building a strong portfolio that demonstrates your skills and completed projects is one way to differentiate yourself from other candidates. Importantly, showcasing projects where you've applied R to address real-world challenges can leave a lasting impression on hiring managers. Your portfolio should be a diverse showcase of projects that reflect your R expertise and its various applications. For this purpose, you should use DataLab, which is an online IDE that allows you to write code, analyze data collaboratively, and share your insights.
DataLab
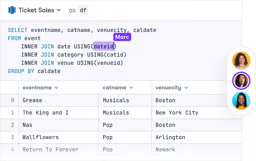
Skip the installation process and experiment with data science code in your browser with DataLab, DataCamp's AI-powered notebook.

Develop an effective resume
Having a great resume always helps. Luckily, we have a great resource to help: How to Create a Data Analyst Resume (with Templates and Examples). Have a read because there are a lot of subtleties involved. Top of my mind is the consideration that, these days, your resume needs to impress not just human recruiters but also Applicant Tracking Systems (ATS), which are automated software systems used by many companies to sift through resumes and eliminate those that don't meet specific criteria.
Don't get discouraged
Remember, forging a career in a field that uses R requires persistence, ongoing learning, and patience. But by following these steps, you're well on your way to success.
Top Tips for Learning R
By now you are probably ready to get started learning R. First, let me give you some tips that can jumpstart your learning.
1. Embrace the tidyverse
The tidyverse is a collection of R packages designed for data science. It includes ggplot2
for visualization, dplyr
for data manipulation, and tidyr
for tidying data, among others. Start by learning the core tidyverse packages. Their consistent syntax will make your learning even easier. Take our Introduction to the Tidyverse course and you will see what I mean.
2. Master R Markdown for reports
R Markdown lets you integrate R code, output, and narrative text into a single, polished document. It supports various outputs like HTML, PDF, and Word. You can use R Markdown for reports, presentations, and documentation. Bosses love R Markdown, so remember to take our Reporting with R Markdown course.
3. Use DataLab
DataLab provides an interactive platform to practice R coding and data science skills. It offers guided projects and exercises to enhance your learning experience in a structured environment. The hands-on approach and real-time feedback will help solidify your understanding of R.
4. Take advantage of online resources and communities
The R community is active and supportive, and they are happy to share resources for learners at all levels. Join forums like Stack Overflow, RStudio Community, and Reddit’s r/rstats. Follow blogs, YouTube channels, and social media accounts dedicated to R programming.
5. Stay updated with R's ecosystem
R is constantly evolving, with new packages and updates being released regularly. Keep an eye on the latest developments in the R ecosystem. Follow package release notes, attend webinars, and read R-related blogs to stay current with new features and best practices.
6. Watch R code-alongs
DataCamp has great teachers. Learn A/B Testing in R with Arne Warnke, how ggplot2 works by watching Visualizing Video Game Sales Data with ggplot2 in R with Richie Cotton, Exploratory Data Analysis in R for Absolute Beginners with Ishmael Rico, and Analyzing Credit Scores with tidymodels in R with Matt Pickard.
7. Keep an R cheat-sheet handy
Download our Getting Started with R Cheat Sheet and save it to your desktop. This way, you have a helpful reference to syntax, and all the most common functions are handy.
R for Business Users
Many professionals first learn R on the job. This makes smart sense for companies because upskilling workforces is a great way to increase retention DataCamp not only offers many resources for individual learners, it can also upskill entire teams at once, so DataCamp for Business offers a comprehensive solution that scales as your organization scales.
Here are just a couple of the many benefits:
- Custom Tracks: We can create customized learning paths that cater to specific company needs.
- Hands-on Practice: We provide interactive exercises and real-world projects because we care about understanding.
- Scalability and Flexibility: Our solutions fit the needs of both small and large teams, and we keep that in mind as we build a project.
- Expert Instructors: Courses are designed by industry experts. Our technologies are the most current ones, and the exercises are grounded in real business cases.
Empower Your Team with Data Analysis Expertise
Enable data-driven decision-making with DataCamp for Business. Comprehensive courses, assignments, and performance tracking tailored for your team of 2 or more.

Final Thoughts
Learning R is a rewarding journey that can open up many career opportunities. I hope you not only have a new appreciation for the R programming language, but also confidence that you are on the road to mastery.
Remember, the key to learning R is consistency and practice. Don't rush through the concepts. Take time to understand each one and apply it in practical projects. Enroll in whichever DataCamp R course is most on your level. Join R communities, participate in coding challenges, and never stop learning.
Your Path to Mastering R

I'm a data science writer and editor with contributions to research articles in scientific journals. I'm especially interested in linear algebra, statistics, R, and the like. I also play a fair amount of chess!