Course
You've likely heard the saying, "Data is the new oil." What is less often mentioned is that similar to how crude oil is useless unless refined, raw data is often also useless until business intelligence and other analytics tools can find patterns and derive insights.
This tutorial will guide you through comparing two very important tools used for strategic insights: Power BI and Alteryx. We will compare both across different metrics and help you understand their individual capabilities and limitations to ultimately assist you in choosing the right tool for your needs.
Why is Business Intelligence/Analytics Tooling Important?

Source of the image: Author
Business Intelligence and analytics tools are crucial for businesses, enabling data-driven decision-making and operational efficiency. These tools integrate data from various sources, ensuring accuracy and automating reporting aspects. They provide real-time and historical analysis, helping businesses respond to market changes, anticipate trends, and plan strategically.
Tools like Power BI and Alteryx also offer competitive advantages by benchmarking performance and identifying new opportunities. They aid in compliance and risk management through accurate reporting. Their user-friendly interfaces and collaborative features make data analysis accessible to non-technical users, boosting productivity. Businesses that use these or similar tools are more likely to stay competitive and proactive.
What is Power BI?
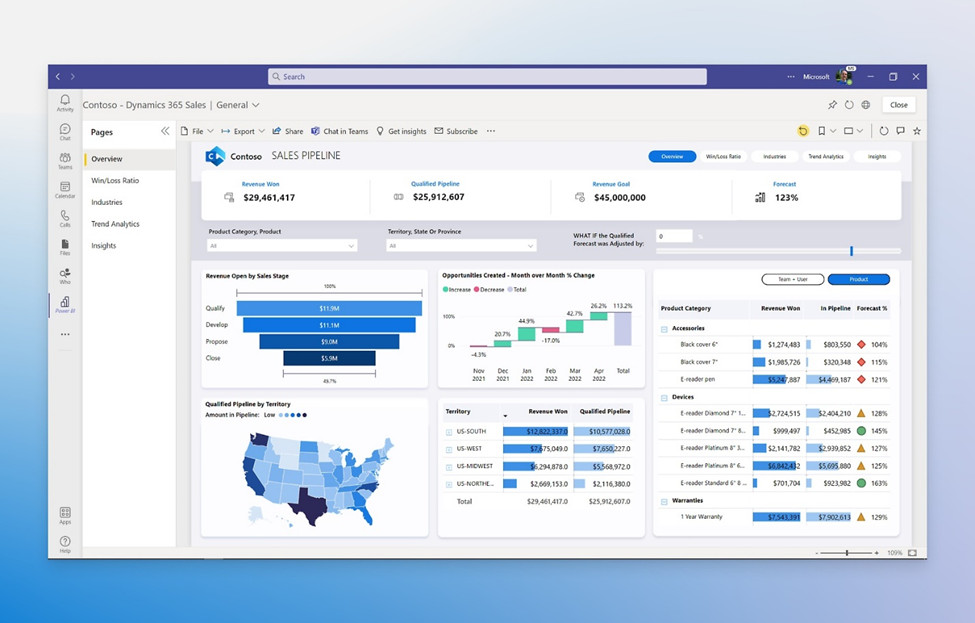
According to Microsoft, “Power BI is a unified, scalable platform for self-service and enterprise business intelligence." At its core, Microsoft's Power BI empowers organizations to extract raw data from various cloud-based systems and convert it into actionable insights through a user-friendly interface. Moreover, the platform filters and highlights the critical information needed to deliver insights into the metrics that are most relevant to the businesses using it.
 Source of the image: Microsoft
DataCamp offers many great resources for those who want to learn Power BI, such as our What is Power BI? blog post which is geared toward beginners. DataCamp also offers courses for those just starting out, such as Introduction to Power BI.
What is Alteryx?
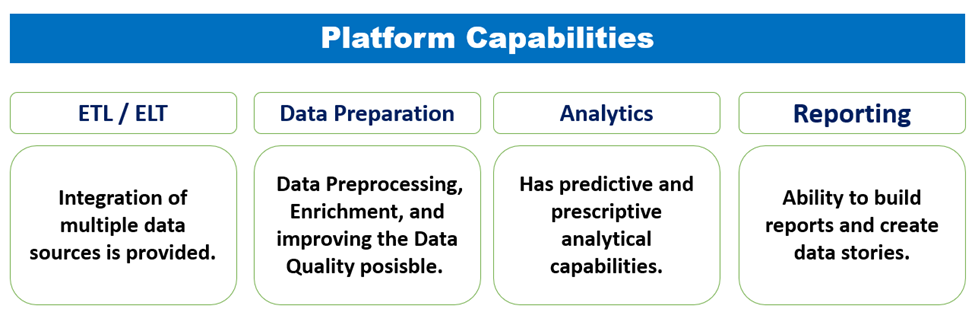
While Power BI is a self-service platform for business intelligence, Alteryx claims to be the “AI Platform for Enterprise Analytics,” and provides unified end-to-end cloud analytics. It provides an easy-to-use graphical interface that lets users build data pipelines using drag-and-drop options. The major platform capabilities are shown below.
 Alteryx platform capabilities
DataCamp offers many excellent resources for those who want to learn Alteryx. For beginners, there are comprehensive blog posts, such as What is Alteryx: An Introductory Guide which is designed to introduce the platform's fundamentals. Additionally, DataCamp provides courses, such as Introduction to Alteryx, which teaches data preparation and blending, before moving on to more advanced analytics.
Similarities Between Power BI and Alteryx
Let's explore the shared characteristics between Power BI and Alteryx. Both platforms feature user-friendly interfaces that make data analysis accessible to users of all levels. They integrate seamlessly with various data sources and automate tasks to keep data current and reduce manual effort. Additionally, both tools support collaboration, enabling users to share insights and work together effectively. Let's take a closer look.
- User interface: Both Power BI and Alteryx have easy-to-use interfaces, allowing users to interact by dragging and dropping.
- Integration capabilities: These tools help integrate other databases, cloud services, or third-party applications as data sources.
- Automation: Automation is a feature provided by both platforms/tools. For instance, Power BI automatically refreshes and schedules data, and Alteryx lets users create automatic data workflows.
- Collaboration: Both tools facilitate collaboration and teamwork.
Differences Between Power BI and Alteryx
While Power BI and Alteryx have similarities, they also have distinctions that set them apart. Let's compare the key differences.
- Primary Focus: Power BI primarily focuses on data visualization and reporting. It excels at creating interactive and visually appealing dashboards and reports. Alteryx primarily focuses on data preparation, blending, and advanced analytics. It is known for its robust data processing and transformation capabilities.
- User Base: Power BI is geared towards business users and analysts who need to create reports and dashboards with minimal technical expertise. Alteryx targets data analysts and scientists requiring more advanced data manipulation.
- Data Processing: Power BI offers basic data transformation features but relies on prepared data sources. Alteryx excels in data preparation and transformation, allowing users to clean, blend, and enrich data from multiple sources before analysis.
- Analytics Capabilities: Power BI focuses on descriptive and diagnostic analytics. Alteryx provides more extensive capabilities for predictive and prescriptive analytics, including machine learning and statistics.
- Deployment: Power BI is available as a cloud service and as a desktop application. Alteryx is primarily a desktop application, although there are server and cloud options.
- Cost Structure: Power BI is generally more cost-effective for organizations looking for robust reporting and dashboard capabilities with a lower entry cost. Alteryx is often more expensive and more suitable for organizations with complex needs.
Power BI vs. Alteryx: A Detailed Comparison
Organizations may not always have the option to include both Power BI and Alteryx in their tool stack. So, which one is the better choice? To answer this, we will conduct a side-by-side comparison and pick a winner for each category, and summarize our results in a table.
Data visualization
Power BI excels in data visualization with extensive features for customizing dashboards and creating interactive reports. It integrates well with PowerPoint and Excel. In contrast, Alteryx focuses on data preparation and analytics. It has limited visualization capabilities, and often requires export to tools like Tableau or Power BI.
Winner: Power BI, for its extensive visualization tools and seamless integration with other Microsoft products.
Data preparation and blending
Power BI, primarily a data analytics tool, offers fewer data preparation and data blending functions. It is good for basic data transformation and connection, whereas Alteryx excels in data preparation and blending with a full suite of tools for cleaning, transforming, and joining files.
Winner: Alteryx, because it excels in data preparation and blending.
Advanced analytics
While Power BI offers some advanced capabilities and even integrates with Azure ML for machine learning, it's most useful for users at foundational levels. Advanced analytics is Alteryx's wheelhouse. Alteryx has predictive and spatial analytics, and much more.
Winner: Alteryx, because it excels in advanced analytics and caters to users with refined analytics needs.
Compatibility
Power BI works best on Windows computers, whereas Alteryx can work equally well on both Mac and Windows, which is a definite advantage.
Winner: Alteryx, because it is more compatible with the major operating systems.
User interface
Both Power BI and Alteryx offer intuitive drag-and-drop interfaces, accessible to all technical levels. Power BI gets bonus points because it integrates with Microsoft products and provides desktop and mobile apps. Alteryx, on the other hand, offers a unique workflow-based approach suitable for complex data tasks, with desktop, server, and cloud versions for workflow sharing and execution. This one's a toss-up.
Winner: Tie, as both have user-friendly interfaces.
Integration capabilities
Power BI integrates with Excel, SQL Server, Azure, and supports Python and R scripting for advanced analysis. Alteryx connects to various data sources, works with Tableau and Power BI for visualization, and also supports Python and R scripting.
Winner: Tie, as both offer strong integration capabilities and Python/R support.
Learning curve
Power BI has a relatively easier learning curve and, with credit to Microsott, has extensive online resources and community support. Added together, Power BI makes it easy for beginners to become proficient. Alteryx has a steeper learning curve due to its advanced features and workflow-based approach. Because Alteryx is newer and not as well-known, obtaining an Alteryx certification is highly valued in the job market.
Winner: Power BI, for its ease of learning and strong community support.
Cost
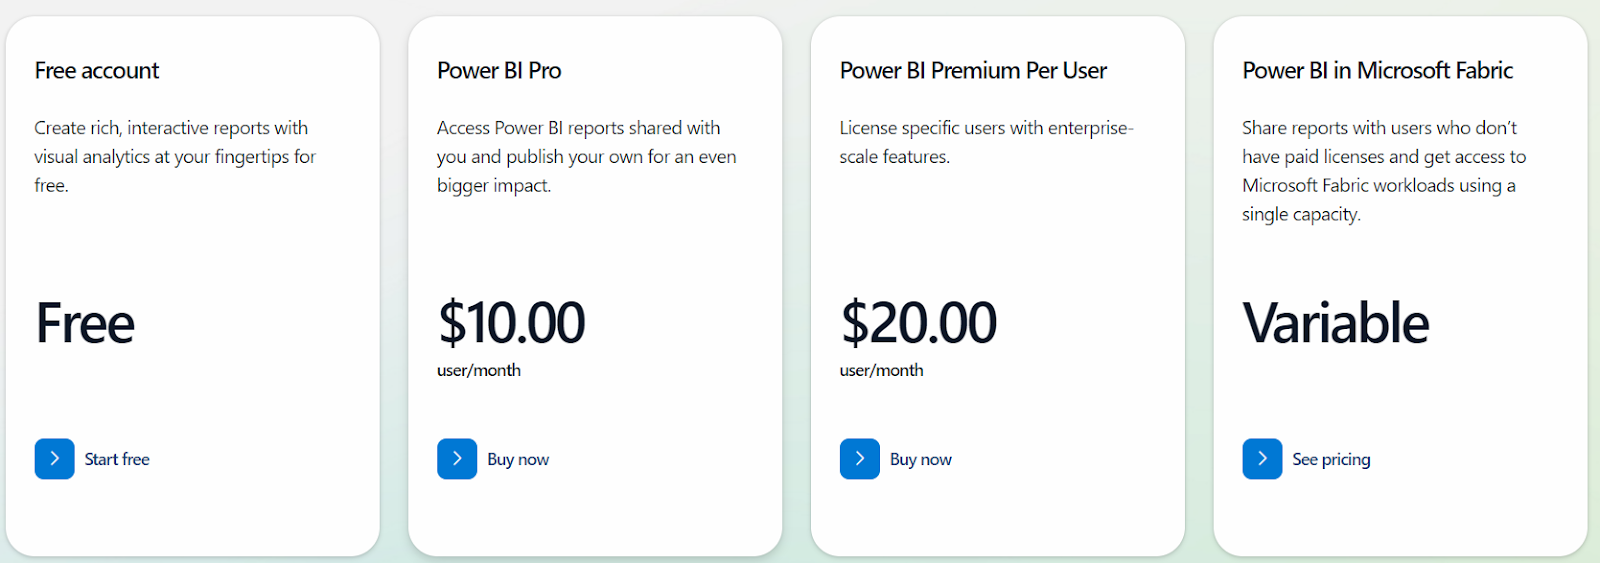
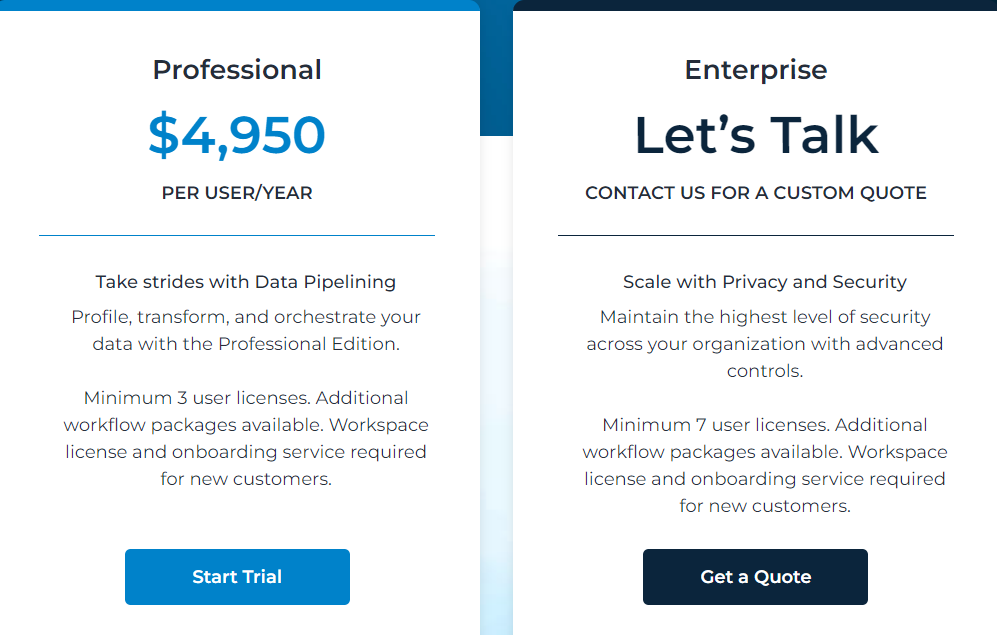
Power BI is more affordable, offering various plans, including a free tier, making it attractive for individual users and small businesses. Alteryx is more expensive, with pricing based on users and features, although its advanced capabilities may justify the price.
Winner: Power BI, for its affordability and flexible pricing plans, including a free tier.
 Source of the image: Microsoft

Source of the image: Alteryx
Power BI vs. Alteryx: A Summary
Let's put our research into a table for easy reference.
| Category | Power BI | Alteryx | Winner |
|---|---|---|---|
| User Interface | Easy to use, drag and drop | Easy to use, drag and drop, workflow-based approach | Tie |
| Integration | Many data integration opportunties | Many data integration opportunties | Tie |
| Data Visualization | Extensive visualizations, customizable dashboards | Limited visualization, often requires export | Power BI |
| Data Preparation | Basic capabilities | Advanced tools for data cleaning and combining | Alteryx |
| Advanced Analytics | Generally, basic to intermediate | Strong capabilities | Alteryx |
| Cost | More affordable, including a free tier | More expensive, but with a free trial | Power BI |
| Learning Curve | Quick and easy, extensive online resources | Steep learning curve | Power BI |
Final Thoughts
Both Power BI and Alteryx are powerful tools for business intelligence and analytics, each with unique strengths. If your organization values data visualization and integration with Microsoft products, Power BI is the clear choice. Its extensive visualization features and compatibility with Microsoft Office tools make it ideal for creating interactive reports and presentations. Additionally, Power BI's affordability and user-friendly interface are supported by resources like DataCamp's Data Analyst in Power BI career track.
Conversely, if advanced data preparation and sophisticated analytics are your focus, Alteryx is superior. It excels in data preparation and blending, with advanced analytics capabilities including predictive and spatial analytics. Despite its higher cost and steeper learning curve, Alteryx's robust functionality is justified for in-depth analytical insights. To start with Alteryx, consider the Alteryx Fundamentals course.

Seasoned professional in data science, artificial intelligence, analytics, and data strategy.
Frequently Asked Questions
What are the main differences between Power BI and Alteryx?
Power BI is an interactive dashboard and reporting visualization application, while Alteryx has immense strength in data preparation, blending, and advanced analytics.
Can Power BI and Alteryx be used together?
Yes, Power BI is compatible with Alteryx and can be used in combination. Alteryx can process and blend data, and the processed data can be exported to Power BI for reporting and visualization. This workflow combines the strengths of both tools.
Is Power BI more cost-effective than Alteryx?
Generally, Power BI is more cost-effective than Alteryx. Power BI offers a free tier and various pricing plans, making it more accessible for small businesses and individual users. In contrast, Alteryx is typically more expensive, with costs varying based on the number of users and required features.
Does Power BI and Alteryx require coding knowledge?
No, they do not necessarily require coding knowledge for basic use. However, both tools support scripting languages such as Python and R for advanced functionalities, which can benefit users with coding knowledge.
Which of the two has a steeper learning curve?
Alteryx has a steeper learning curve than Power BI. Although Alteryx has training resources, its advanced features and workflow-based nature mean it takes longer to master. On the other hand, Power BI has a relatively more straightforward path to mastery, which is supported by numerous online resources and a community of users.


