Course
Reporting and business intelligence are essential for making informed decisions. Many companies rely on tools that provide these capabilities, and several providers have stepped up to meet this need. One prominent example is Microsoft.
Microsoft offers two leading solutions: Power BI and SQL Server Reporting Services (SSRS). While both tools provide robust data visualization and reporting features, they are designed for different purposes.
In this article, I will explain the similarities and differences between Power BI and SSRS, helping you understand which tool best suits your specific needs. Let’s get started!
What is Power BI?
Power BI is a business analytics service developed by Microsoft that allows users to connect, visualize, and analyze data from multiple sources. It comprises a suite of tools, including Power BI Desktop (for local report creation) and Power BI Service (a cloud-based platform for sharing and collaboration).
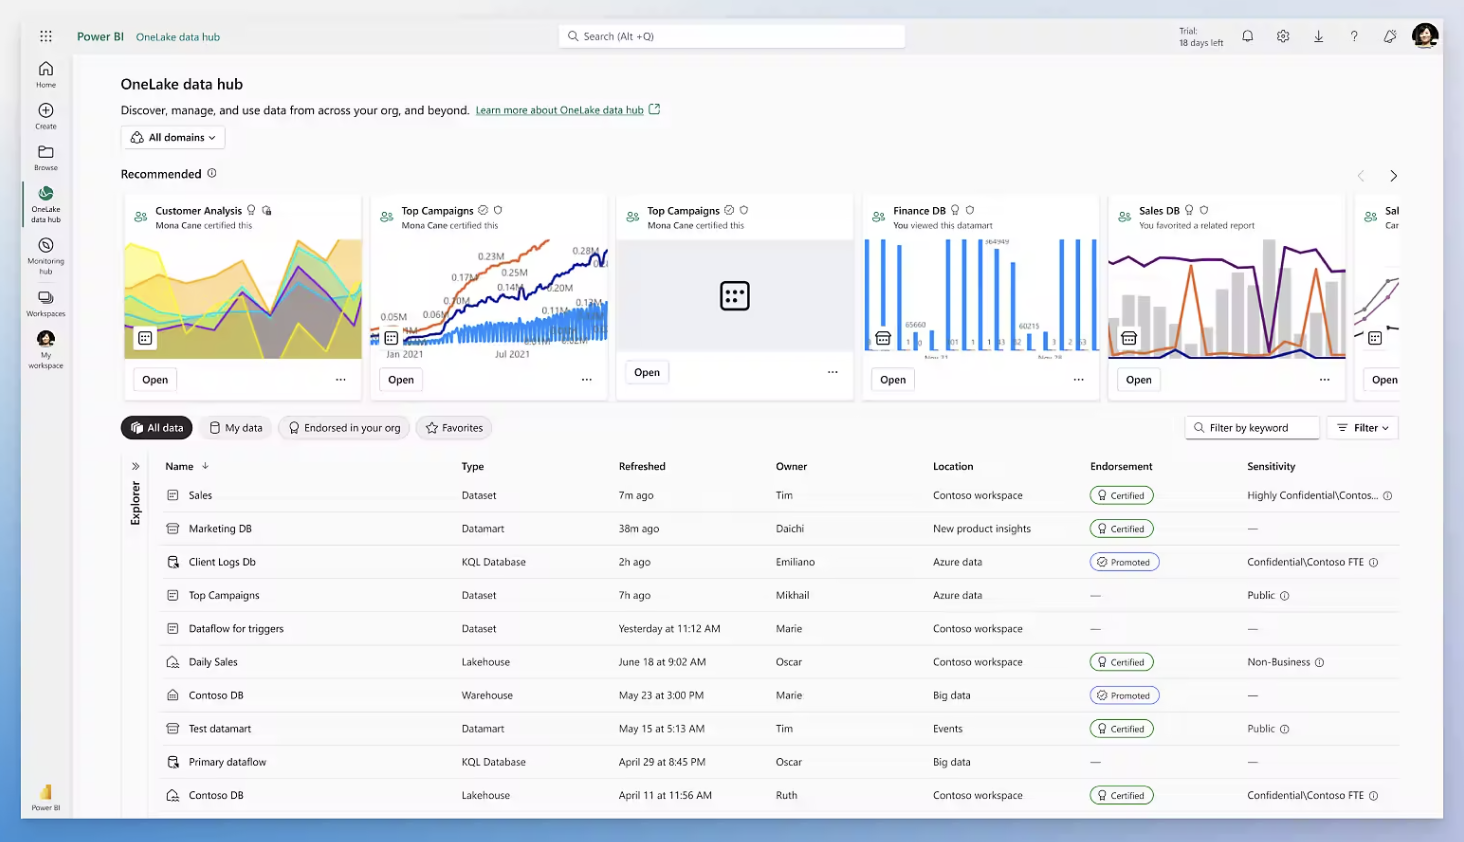
The platform lets users transform raw data from various sources into coherent, interactive reports and dashboards, and it is renowned for its intuitive interface. Many applaud the platform for making it easy for non-technical users to create visual reports and share insights across teams. Its AI-driven capabilities also enable businesses to gain deeper insights from their data.
Furthermore, Power BI integrates with other Microsoft tools like Azure, Excel, and SQL Server, making it a flexible and powerful solution for organizations of any size.

The Power BI interface. Image source: Microsoft
Getting started with Power BI is easy if you follow a course like the Power BI Fundamentals by DataCamp!
What is SSRS?
SQL Server Reporting Services (SSRS) is a robust, server-based reporting platform, also developed by Microsoft. The tool enables users to create, deploy, and manage various reports.
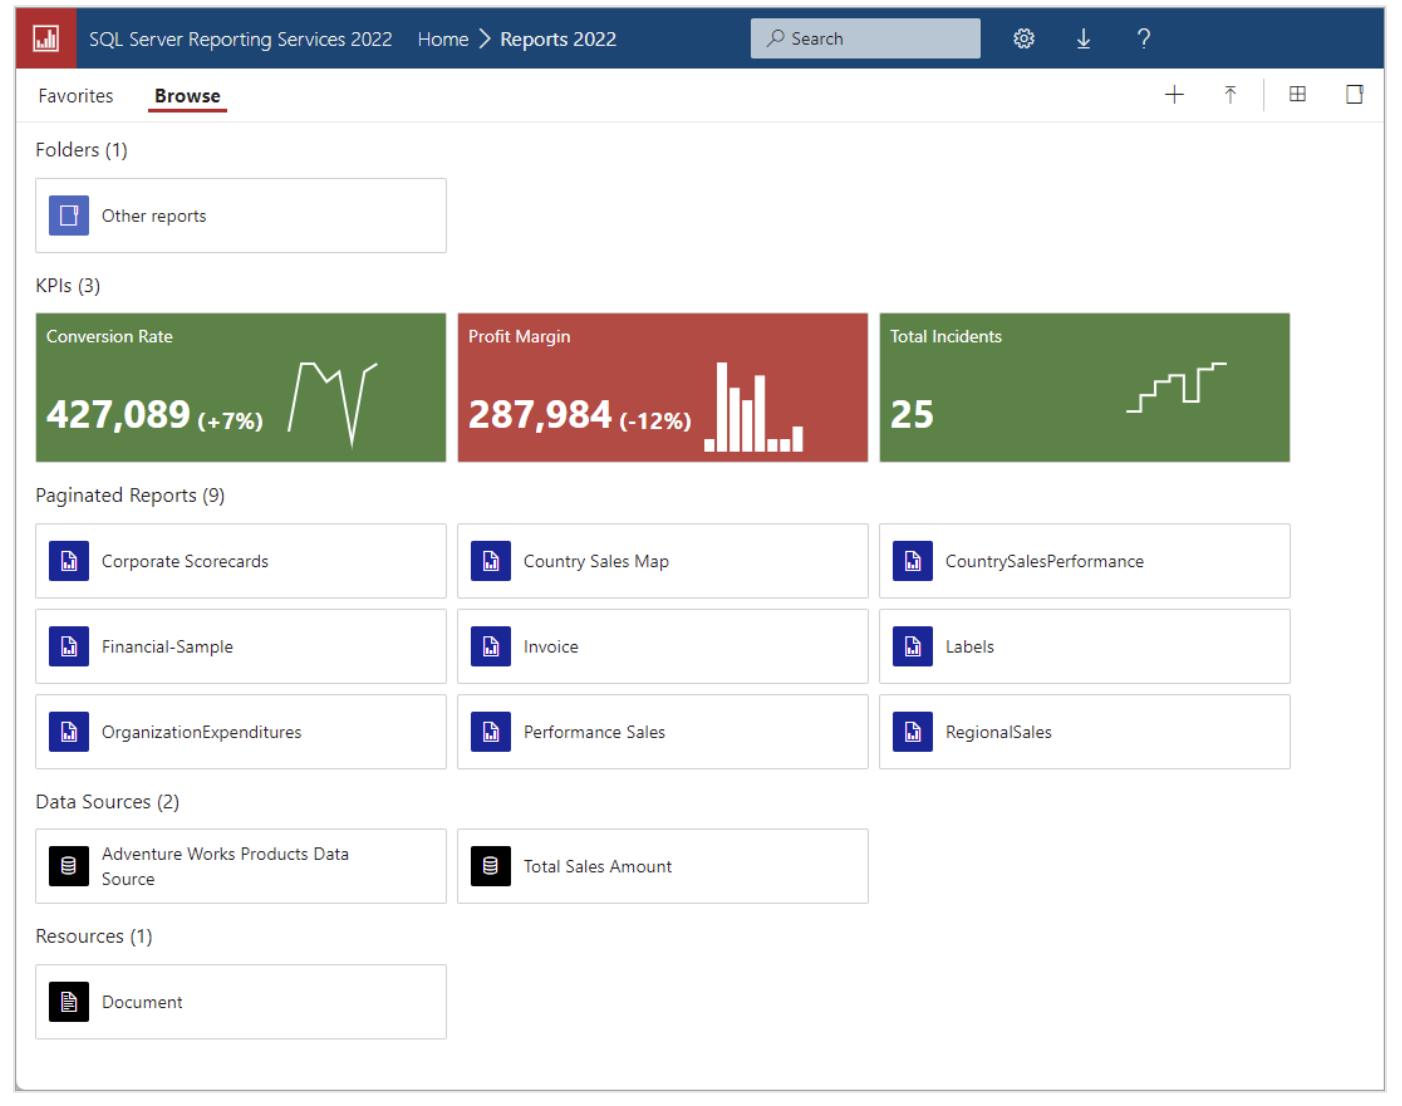
SSRS is available at no additional cost as part of SQL Server, making it an attractive option for organizations looking for powerful reporting capabilities. It allows users to generate paginated reports in various formats catering to detailed operational reporting needs where precise layouts and print-ready formats are required.
Unlike Power BI, which emphasizes interactive visualizations, SSRS excels in delivering structured reports tailored to specific requirements. It offers extensive customization options, enabling users to create complex reports with parameters, custom coding, and integrations with SQL Server databases.
While primarily an on-premises solution, SSRS can also be extended to the cloud using services like Azure SSRS, providing organizations with flexibility in managing their reporting needs.

SSRS web portal. Image source: Microsoft Learn.
Next, let’s take a closer look at these two BI platforms' similarities and differences.
Master Power BI From Scratch
Power BI vs SSRS: Similarities
Although they serve different purposes, Power BI and SSRS actually share several features that highlight their common strengths. Here are some of them:
Data sources and connectivity
Both Power BI and SSRS can pull data from a wide variety of sources. This extensive connectivity allows users to flexibly analyze and report on data, accommodating diverse business needs.
Whether it’s databases, cloud services, or external files, these tools support numerous data inputs, providing robust solutions for comprehensive data analysis.
Security features
Both tools offer strong security features, mainly when used within the Microsoft ecosystem.
Power BI and SSRS support role-based access control (RBAC) and integrate with Active Directory for user authentication and access management. This ensures that sensitive information remains secure and accessible only to authorized users, reinforcing data governance and compliance.
Integration with the Microsoft ecosystem
As Microsoft products, Power BI and SSRS integrate smoothly with other Microsoft services, such as Azure, SQL Server, and Excel.
This compatibility allows teams already invested in Microsoft solutions to easily manage and transition data across these platforms. The deep integration enhances productivity by creating a cohesive workflow within a familiar environment.
Power BI vs SSRS: Differences
While Power BI and SSRS share some common features, their differences are significant, defining their unique strengths and ideal use cases. Let’s review them!
User interface
Power BI is designed for ease of use. It features an intuitive drag-and-drop interface that enables non-technical users to quickly create interactive reports and dashboards with customizable widgets and real-time data visualization.
In contrast, SSRS has a more technical interface that requires users to understand Report Definition Language (RDL) for building reports, making it better suited for developers or power users who need precise control over report formatting.
Report types and output
Power BI focuses on interactive, dynamic reports with rich visualizations, allowing users to drill down into data, explore relationships, and create mobile-friendly dashboards.
On the other hand, SSRS is designed for paginated, static reports, making it ideal for financial, compliance, or operational reporting where fixed formats and precise pagination are critical.
Deployment
Power BI is primarily cloud-based, with an on-premises option through the Power BI Report Server. This makes it ideal for easy sharing and collaboration across teams.
SSRS, in contrast, is primarily on-premises – however, cloud options are available via Azure SSRS. This makes SSRS a better fit for teams needing more control over their data environment or those in highly regulated industries requiring on-premises reporting.
Pricing model
Power BI follows a “freemium” model. It offers a free version with limited features and paid options like Power BI Pro and Power BI Premium, which provide advanced features and larger data capacities.
In contrast, SSRS is bundled with SQL Server at no extra cost, making it a cost-effective solution for organizations already using SQL Server.
Summary Table: Power BI vs SSRS
|
Feature |
Power BI |
SSRS |
|
User interface |
Intuitive drag-and-drop, user-friendly |
Technical, requires RDL knowledge |
|
Report type |
Interactive, dynamic reports |
Static, paginated reports |
|
Deployment |
Primarily cloud-based, with on-premises option |
Primarily on-premises, with cloud options |
|
Pricing model |
Freemium with paid tiers (Pro, Premium) |
Included with SQL Server, no additional cost |
|
Security features |
Role-based access control, integrates with AD |
Role-based access control, integrates with AD |
|
Data sources |
Wide range of connectivity options |
Wide range of connectivity options |
|
Microsoft integration |
Seamless with Azure, SQL Server, Excel |
Seamless with Azure, SQL Server, Excel |
Power BI vs SSRS: When To Use Each
Choosing between SSRS and Power BI depends on your team’s unique needs and priorities. In this section, we will dig into the key factors to consider when making your pick.
When should you use Power BI?
Power BI is ideal for organizations that:
- Require interactive and dynamic data visualization tools.
- Operate in collaborative environments where data needs to be shared across teams.
- Use cloud-based systems and need a tool that integrates with Azure and other Microsoft cloud services.
- Want AI-driven insights and predictive analytics built into their reporting.
Example scenario: A marketing team wants to track real-time campaign performance across various channels. They need an interactive dashboard to pull data from different platforms (e.g., Google Analytics, Facebook Ads) and display it visually.
When should you use SSRS?
SSRS is better suited for organizations that:
- Need static, paginated reports, especially for financial or operational purposes.
- Work in highly regulated industries requiring strict control over report formats and data environments.
- Rely on SQL Server for most of their database management and reporting.
- Prefer on-premises solutions due to data privacy or regulatory requirements.
Example scenario: A finance department needs to generate monthly financial reports with detailed layouts for compliance purposes. These reports must be printable and follow strict formatting guidelines.
Final Thoughts
Choosing between Power BI and SSRS depends mainly on your specific needs. Power BI excels in dynamic data visualizations and collaborative cloud-based reporting, while SSRS remains a reliable choice for static, detailed, and print-ready reports. Both tools are powerful in their own right, but understanding each use case will help you make the right decision.
For those new to Power BI, the Power BI Fundamentals track and Introduction to Power BI course are excellent resources to get started! Advanced users can also explore Data Visualization in Power BI for deeper insights.
For those looking to enhance their knowledge of SSRS and SQL Server, the Introduction to SQL Server course is an excellent resource for building basic expertise!
Pass Microsoft's PL-300
FAQs
What is the primary difference between Power BI and SSRS?
Power BI focuses on interactive, dynamic data visualizations, while SSRS is designed for static, paginated reports with detailed formatting.
Can Power BI and SSRS connect to the same data sources?
Yes, both tools support a wide range of data sources, including SQL Server, Excel, and cloud services like Azure.
Which tool is easier to use for non-technical users, Power BI or SSRS?
Power BI is generally easier for non-technical users due to its intuitive drag-and-drop interface, while SSRS requires more technical knowledge for report creation.
Can Power BI and SSRS be used together in an organization?
Yes, many organizations use both Power BI and SSRS to meet different reporting needs. Power BI is often used for real-time, interactive dashboards, while SSRS handles more formal, paginated reports.
How do Power BI and SSRS handle real-time data updates?
Power BI supports real-time data streaming, allowing dashboards and reports to be updated in real time as new data becomes available. This makes it particularly beneficial for monitoring KPIs and live data sources. SSRS, however, does not natively support real-time data updates.
What are the data volume handling capabilities of Power BI and SSRS?
Power BI is powerful but has data size limitations, especially in its free version. Larger data sets may require Power BI Premium, which offers greater data capacity and performance optimizations. SSRS, on the other hand, is better equipped for handling large volumes of data as it’s closely integrated with SQL Server, making it a preferred choice for extensive operational reporting where high data volume is a factor.
How customizable are the reports in SSRS compared to Power BI?
SSRS offers more in-depth customization options for report layouts and formatting, including the use of Report Definition Language (RDL), custom code, and complex parameters. This level of customization allows for highly detailed, print-ready reports tailored to specific requirements. While Power BI provides customization features, they are focused on visual interactivity and ease of use, prioritizing an intuitive design over extensive format control. Advanced report designers who need precise control may find SSRS more suitable for their needs.
Can SSRS reports be embedded into web applications or other software?
Yes, SSRS supports embedding reports into web applications and software using the SSRS report viewer control or via APIs. This allows organizations to integrate detailed, formatted reports into their internal or external applications, providing users with structured data insights without needing to access the SSRS platform directly.


