Course
In the world of data management and visualization, staying ahead of the curve is important. Microsoft has long been at the forefront of this space, offering tools like Power BI for data visualization and business intelligence.
Now, with the introduction of Microsoft Fabric, Microsoft offers a broader data platform that integrates Power BI into a comprehensive solution for data engineering, analytics, and real-time processing.
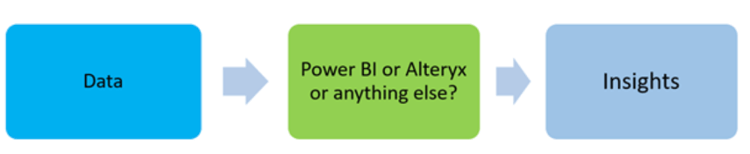
This evolution raises an important question: when should you use Microsoft Fabric, and when is Power BI the better choice?
In this article, we will explore the differences between Microsoft Fabric and Power BI as standalone and integrated solutions. If you’re a current Power BI user considering Microsoft Fabric, this can help you navigate the transition.
What is Microsoft Fabric?
Microsoft Fabric is a comprehensive data platform designed to unify data management, engineering, and science within the Microsoft ecosystem. Unlike its predecessors, Fabric isn’t just another tool—it's the new backbone of Microsoft's data strategy.
These are some of the most important features of Microsoft Fabric:
- End-to-end data management: Fabric supports the complete data lifecycle, including data ingestion, transformation, and storage, making it a one-stop solution for organizations with complex data needs.
- Azure integration: Deep integration with Azure services allows Fabric to leverage Microsoft's cloud infrastructure for scalable data processing and storage.
- Comprehensive tools: Fabric offers a suite of tools for data engineering, data science, and machine learning, enabling teams to collaborate on complex data projects.
- Real-time data processing: Fabric's real-time processing capabilities allow stakeholders to make timely decisions based on up-to-date data.
- Collaborative features: Fabric is built with collaboration in mind. It enables data teams to work together and ensures that insights are shared across the organization.
If you’re new to Microsoft Fabric and want to dive deeper, check out this Introduction to Microsoft Fabric course to get started!

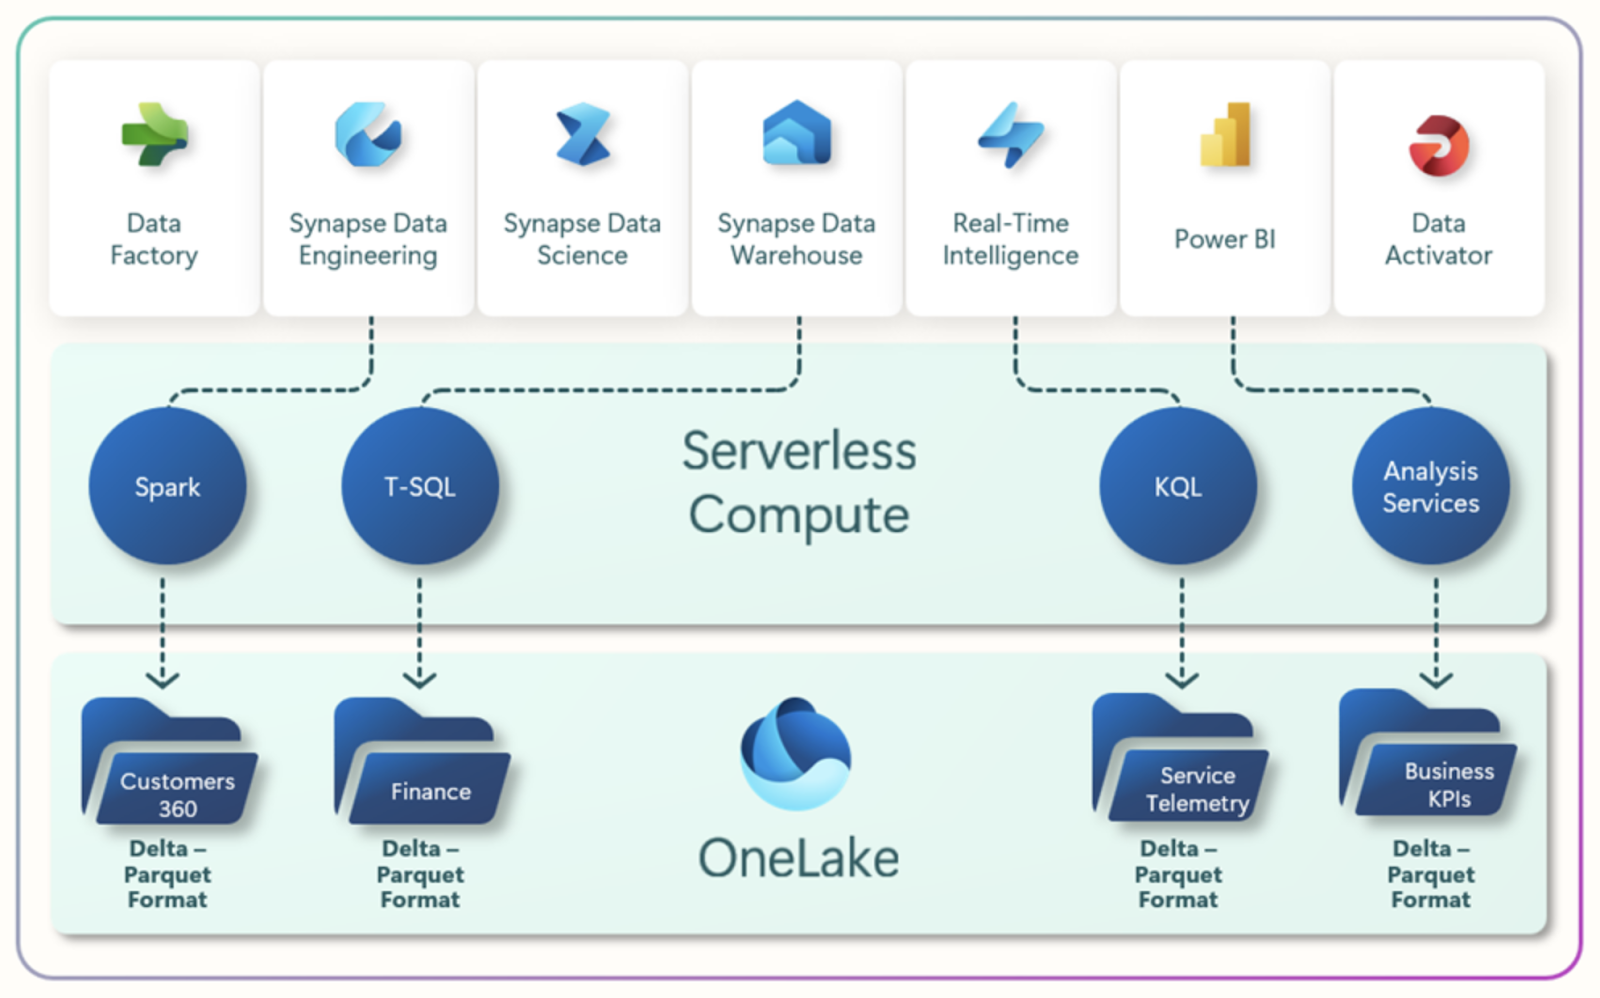
The Microsoft Fabric architecture. Image source: Microsoft Learn
What is Power BI?
Power BI is Microsoft's flagship business intelligence (BI) and data visualization tool. It empowers users to create interactive reports and dashboards, transforming raw data into actionable insights.
Power BI is widely recognized for its ease of use and capabilities, making it a go-to choice for companies focused on data visualization and business intelligence.
These are some of the core features of PowerBI:
- Advanced data visualization: Power BI offers a wide range of visualization options, allowing users to create insightful and interactive reports and dashboards.
- Integration with various data sources: Power BI can connect to many data sources, making it easy to gather and analyze data from different systems.
- Interactive dashboards: With Power BI, users can build dashboards, allowing real-time interaction and data exploration.
- Built-in AI and machine learning: Power BI includes AI-driven features that help users uncover hidden insights and patterns within their data.
- Strong community support: Power BI benefits from a vast user community, providing extensive resources and support for users of all skill levels.
To learn the fundamentals and get hands-on experience with Power BI, explore this Introduction to Power BI course and build impactful data visualizations.

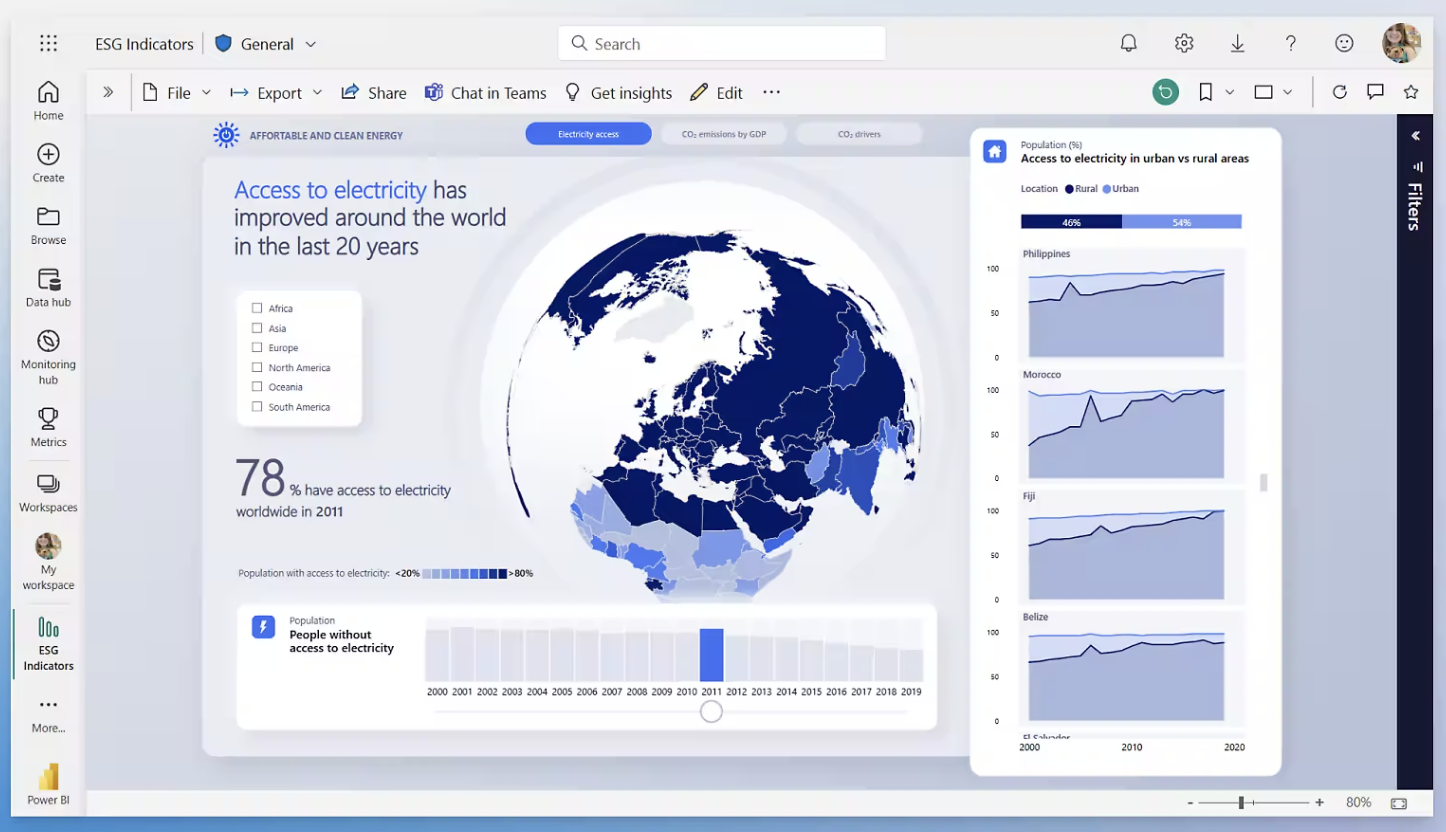
The Power BI user interface. Image source: Microsoft
Master Power BI From Scratch
Microsoft Fabric vs Power BI: Core Differences
Although Power BI is now integrated within Microsoft Fabric, it remains available as a standalone tool. So, understanding the distinctions between these two offerings is important for choosing the right solution.
Purpose and focus
Power BI is a specialized business intelligence tool primarily focused on data visualization and reporting. In contrast, Microsoft Fabric is a comprehensive data platform that supports the entire data lifecycle—from ingestion and storage to transformation, analysis, and visualization.
While Power BI is a component of Fabric, Fabric itself includes additional services for data engineering, data science, and real-time data processing.
Data management and processing
Power BI is designed for visualization but includes basic data modeling and transformation tools (e.g., Power Query).
However, Microsoft Fabric provides more advanced data processing and management capabilities, including data engineering and warehousing, allowing users to handle large-scale, complex data operations directly within the platform.
Integration with Azure and data sources
While Power BI connects to various data sources and integrates with some Azure services, Fabric’s integration with Azure is deeper and more extensive.
One of the key changes with integrating Power BI into Microsoft Fabric is the deepened connection with Azure services and other Microsoft tools. Previously, Power BI worked well with tools like Excel and various data sources, but within Fabric, it now plays a role in a fully integrated data ecosystem.
This means users can move from data ingestion and transformation to visualization without leaving the Fabric environment.
User interface and ease of use
Power BI is widely praised for its intuitive, user-friendly interface, making it accessible to users with varying technical backgrounds. The platform's drag-and-drop report builder and straightforward dashboard customization allow non-technical users to easily create visualizations.
Microsoft Fabric, however, includes a more complex interface due to its broader range of functionalities and integrated tools. While it provides powerful features for data professionals, users might experience a steeper learning curve than Power BI alone.
Customization and flexibility
Power BI offers robust customization options for reports and dashboards, with extensive visualization types, custom themes, and the ability to integrate DAX formulas for tailored analytics. However, its flexibility is primarily limited to visualization and reporting needs.
Microsoft Fabric, by contrast, offers greater customization across the entire data lifecycle. Users can tailor data engineering workflows, apply custom machine learning models, and integrate complex data processing pipelines, providing a more flexible environment for managing and analyzing data at scale.
Collaboration and sharing
Power BI supports sharing reports and dashboards, but collaboration is mainly limited to viewing and commenting.
Fabric, however, is built for collaborative analytics, allowing teams across roles—data engineers, scientists, and analysts—to work within the same platform, contributing to unified datasets, insights, and models.
Pricing structure
When comparing the costs of Power BI and Microsoft Fabric, it's important to consider their pricing structures and the value they offer.
Power BI pricing:
- Power BI Free: Allows individual users to create reports and dashboards but lacks sharing and collaboration features.
- Power BI Pro: Priced at $10 per user per month, this plan includes sharing, collaboration, and integration with other Microsoft services.
- Power BI Premium Per User: At $20 per user per month, it offers advanced features like larger dataset sizes, more frequent data refreshes, and AI capabilities.
For up-to-date information, check the Power BI pricing page.
Microsoft Fabric pricing:
Microsoft Fabric introduces a unified pricing model for various services, including Power BI. Pricing is based on capacity units (CUs), which represent a combination of compute, storage, and other resources. Fabric capacities range from F2 (2 CUs) to F2048 (2048 CUs), with pay-as-you-go and reservation options available.
For example, an F64 capacity (64 CUs) is priced at $8,409.60 per month on a pay-as-you-go basis, with potential savings through reservation plans.
This capacity supports all Fabric workloads, including Power BI, data engineering, and real-time analytics.
For up-to-date information, check the Fabric pricing page.
Power BI standalone is ideal for organizations focused solely on business intelligence and data visualization, with predictable per-user or per-capacity costs.
Microsoft Fabric is for organizations requiring a comprehensive data platform that integrates multiple services. While the initial investment may be higher, Fabric offers a unified solution that can lead to cost efficiencies by consolidating several data services.
Microsoft Fabric vs Power BI: A Summary
This table highlights each area of differentiation, making it easier to see where each platform excels and which might be better suited to specific needs.
|
Feature |
Microsoft Fabric |
Power BI |
|
Scope and functionality |
Comprehensive data platform supporting full data lifecycle (ingestion, storage, transformation) |
Primarily focused on data visualization and business intelligence |
|
Data management and processing |
Includes advanced data engineering, real-time data processing, and data science capabilities |
Limited to data modeling and transformation for visualization |
|
Integration with Azure |
Deep integration with Azure services for scalable infrastructure and high-performance analytics |
Can connect to Azure but with less direct integration and scalability |
|
User interface and ease of use |
More complex interface due to broad functionality; steeper learning curve |
User-friendly interface with drag-and-drop functionality, easy for non-technical users |
|
Customization and flexibility |
High customization across data engineering, ML, and advanced analytics |
Customization primarily focused on reports and dashboards |
|
Collaborative environment |
Built for cross-functional team collaboration (engineers, scientists, analysts) |
Collaboration mainly through report sharing and commenting |
|
AI and advanced analytics |
Offers AI and ML tools integrated into data science workflows |
Built-in AI features for data insights, but limited in scope |
|
Cost structure |
Based on capacity units (CUs) covering all data services within Fabric |
Per-user or per-capacity pricing for business intelligence only |
Power BI Evolution within Microsoft Fabric
Power BI has undergone a significant transformation through its integration within Microsoft Fabric. Initially a standalone tool, Power BI has become a core component of Fabric's unified analytics platform.
Here’s what the Power BI integration into Fabric specifically means:
- The Fabric integration enhances Power BI’s connectivity to data sources. Within Fabric, Power BI can directly access more diverse and larger data sources, tapping into real-time data streams and large-scale data storage.
- Additionally, users can leverage Fabric's data science and machine learning tools directly within Power BI, enriching their reports with predictive insights and automated analyses.
- As part of Fabric, Power BI supports more robust collaboration features, enabling teams to collaborate on data projects across roles. Data engineers, scientists, and analysts can interact within the Fabric environment, sharing insights and contributing to unified reports and dashboards.
While standalone Power BI remains accessible, those transitioning to Fabric will find an enriched ecosystem that extends beyond visualization, bringing together advanced data management, processing, and analytical capabilities in a single platform.
When to Use Microsoft Fabric
Microsoft Fabric is best suited for organizations seeking an all-in-one data platform beyond business intelligence to support data engineering, data science, and advanced analytics.
Consider Microsoft Fabric if:
- You require a comprehensive data platform: Fabric supports end-to-end workflows, including data ingestion, transformation, storage, real-time processing, and visualization, making it ideal for organizations with complex data needs.
- Your team spans multiple data roles: Fabric helps collaboration between data engineers, data scientists, and business analysts within a unified environment.
- Advanced analytics and machine learning are priorities: With integrated AI and machine learning tools, Fabric allows for more sophisticated data analysis, predictive modeling, and automated insights.
- You need high scalability: Fabric’s deep integration with Azure enables it to handle large-scale, real-time data and offers the flexibility to expand data infrastructure as needed.
- Consolidation of data services is beneficial: For organizations using multiple data tools, Fabric offers a single platform to streamline costs and improve efficiency by unifying data services.
When to Use Power BI
Power BI is ideal for organizations or teams focused on business intelligence, data visualization, and straightforward reporting needs.
Choose Power BI if:
- Your primary goal is data visualization and reporting: Power BI excels at creating interactive dashboards and reports, making it perfect for business users and analysts who need a clear view of data insights.
- You have a smaller team with simpler data needs: Power BI’s ease of use makes it accessible to non-technical users, making it a good choice for smaller teams or those primarily focused on visualizing and sharing data.
- Budget constraints are a factor: Power BI’s per-user or per-capacity pricing is more budget-friendly, especially for organizations that don’t need the additional functionalities offered by Fabric.
- You don’t require extensive data processing or engineering capabilities: Power BI includes data modeling and transformation tools. However, it’s best for relatively simple datasets and doesn’t offer Fabric’s full suite of data processing tools.
- Integration with other Microsoft Office tools is sufficient: Power BI integrates with other Office products like Excel and Teams, making it convenient for teams focused on business applications.
Conclusion
Choosing between Microsoft Fabric and Power BI depends mainly on your organization's needs.
Microsoft Fabric offers a robust platform for comprehensive data management, making it ideal for organizations with complex data needs. Power BI, on the other hand, excels in data visualization and business intelligence, providing a user-friendly experience for creating interactive reports and dashboards.
If you’d like to explore Fabric’s capabilities further, check out this Introduction to Microsoft Fabric course.
To get started with Power BI, consider the Introduction to Power BI course or deepen your skills with Data Visualization in Power BI and Introduction to DAX in Power BI.
Pass Microsoft's PL-300
FAQs
What is the primary difference between Microsoft Fabric and Power BI?
Microsoft Fabric focuses on end-to-end data management and engineering, while Power BI is designed for data visualization and business intelligence.
Why is Microsoft integrating Power BI into Fabric?
Microsoft is integrating Power BI into Fabric to create a unified platform that combines data management, engineering, and visualization, providing a more comprehensive solution for organizations.
Is Microsoft Fabric suitable for real-time data processing?
Yes, Microsoft Fabric offers real-time data processing capabilities, making it ideal for organizations that require up-to-date data insights.
What are the cost differences between Microsoft Fabric and Power BI?
Microsoft Fabric may have higher costs due to its comprehensive features and reliance on Azure services, while Power BI can be more cost-effective for data visualization and reporting needs.
Lead BI Consultant - Power BI Certified | Azure Certified | ex-Microsoft | ex-Tableau | ex-Salesforce - Author


