
Course
Understanding Prompt Engineering
1 hr
202.7K
To deepen your understanding of AI agents and how tools like Chrome DevTools MCP fit into the bigger picture, explore DataCamp’s Introduction to AI Agents course or the AI Agent Fundamentals skill track.
Chrome DevTools MCP is an official Model Context Protocol server from the Chrome DevTools team that lets AI coding assistants control Chrome through natural language. Instead of writing scripts, you tell your AI assistant what you want (“navigate to this page and check for console errors” or “fill out this form and take a screenshot”), and it handles the technical details.
The server gives you access to powerful browser automation and debugging tools. It’s built on Puppeteer, so it’s reliable and runs entirely on your machine. You don’t have to write a single line of Puppeteer code.
In this tutorial, you’ll learn how to use this MCP server with AI coding assistants like Claude, Cursor, and Cline. We’ll cover installation and configuration, then move into the core capabilities: browser automation, debugging, and inspection. Throughout the article, we’ll use Conduit (demo.realworld.io), a Medium-style blogging platform, to demonstrate real-world examples.
If you’re new to Model Context Protocol, I recommend you check out this comprehensive MCP guide for a deep dive into how MCP connects AI models to external tools. You can also check out our Claude for Chrome tutorial and our guide to the best AI browsers. For a different approach to AI browser automations, read our ChatGPT Atlas tutorial.
Chrome DevTools MCP is an official MCP server that lets AI coding assistants control Chrome through natural language
It exposes 26 tools across 6 categories: input automation, navigation, debugging, network, performance, and emulation
Install with claude mcp add chrome-devtools npx chrome-devtools-mcp@latest for Claude Code (other clients have similar setup)
Automate browser tasks like navigation, form filling, and screenshot capture without writing Puppeteer scripts
Debug web apps by inspecting console errors, network requests, and running JavaScript—all through conversation
Build frontends iteratively by letting the AI take screenshots to verify its own work at each step
Here’s how the architecture works under the hood.
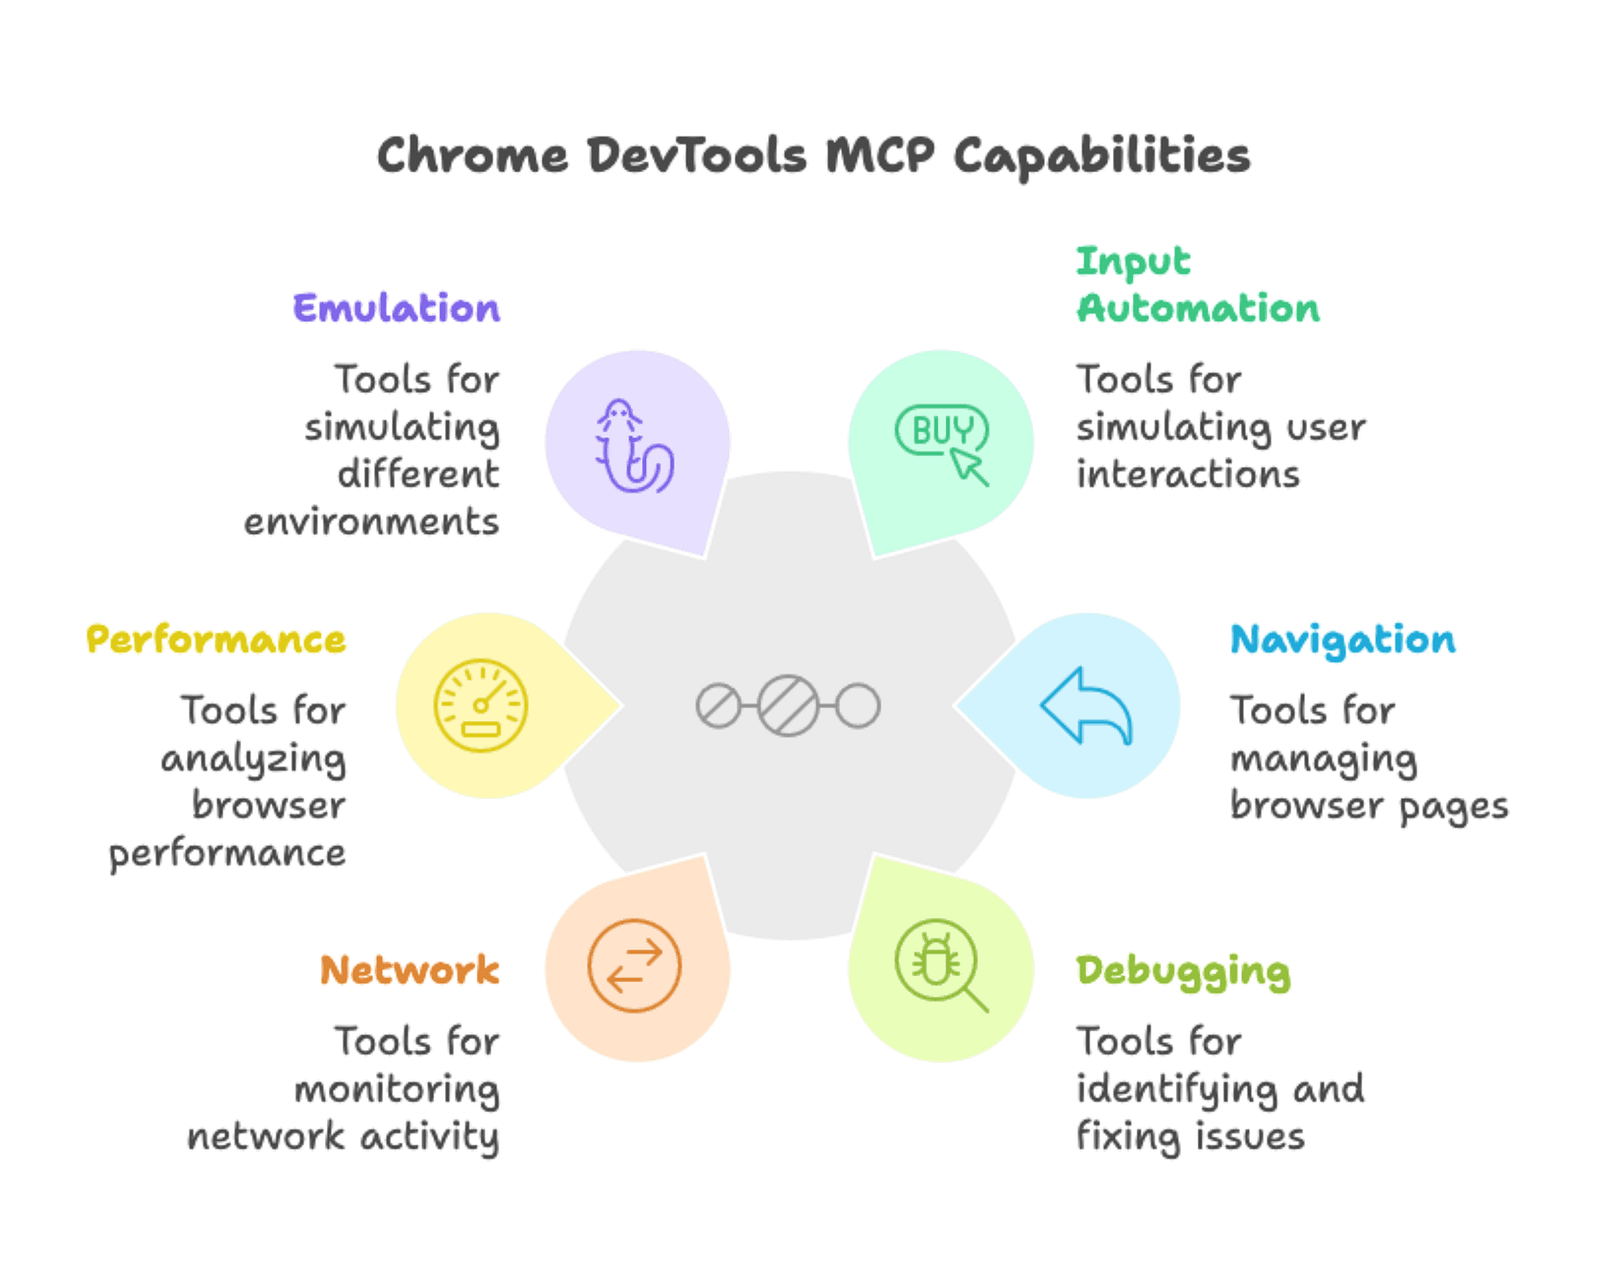
The server exposes 26 tools organized across 6 categories:
Browser automation becomes conversational. Instead of writing Puppeteer scripts and debugging CSS selectors, you describe what you want in natural language. The AI assistant figures out the technical details.
| Feature | Chrome DevTools MCP | Manual DevTools | Puppeteer Scripts |
|---|---|---|---|
| Interface | Natural language | GUI (point and click) | JavaScript code |
| Setup time | One command | None (built into Chrome) | Project setup + dependencies |
| AI integration | Native (MCP protocol) | None | None (must parse output manually) |
| Automation | Conversational, iterative | Manual only | Fully scriptable |
| Debugging | AI interprets errors for you | Manual inspection | Console output + assertions |
| Learning curve | Low (describe what you want) | Medium (learn DevTools UI) | High (learn Puppeteer API) |
| Reproducibility | Session-based | Not reproducible | Fully reproducible scripts |
With these tools, your AI assistant can help you:
All of this is triggered through natural language commands rather than writing Puppeteer scripts.
Chrome DevTools MCP works with Claude Desktop, Cursor, Cline, and VSCode Copilot. Since it’s one MCP server among many, you can combine it with others—such as file system access, database tools, and APIs—to build workflows that span multiple tools.
You’ll need a few things:
Basic familiarity with browser DevTools helps, but it’s not required.
Chrome DevTools MCP runs through your AI assistant’s MCP configuration. The setup varies slightly depending on which AI coding assistant you use. We’ll show you how to install it for Claude Code, but other editors like Cursor, Cline, and VSCode Copilot have similar approaches.
For Claude Code, run this command in your terminal:
claude mcp add chrome-devtools npx chrome-devtools-mcp@latestThis command registers the Chrome DevTools MCP server with Claude Code. The server runs via npx, which downloads and executes the package without requiring a permanent installation. The @latest ensures you get the current version.
After running the command, restart Claude Code to load the new server.
Other MCP clients have similar installation methods—some use commands, others use configuration files, or one-click install buttons. Check the Chrome DevTools MCP GitHub page for specific instructions for Cursor, Cline, Gemini CLI, Windsurf, and other supported clients.
Let’s verify everything works with a simple command:
Navigate to demo.realworld.io and take a screenshotYou should see:
If something goes wrong, check these common issues:
Chrome DevTools MCP gives you six core tools for interacting with web pages. Use navigate_page to load URLs, click to interact with elements, fill and fill_form to enter text, hover to trigger hover effects, and take_screenshot to capture what you see. These tools cover the majority of browser automation tasks you'll encounter.
Let’s load a page. Tell your AI assistant:
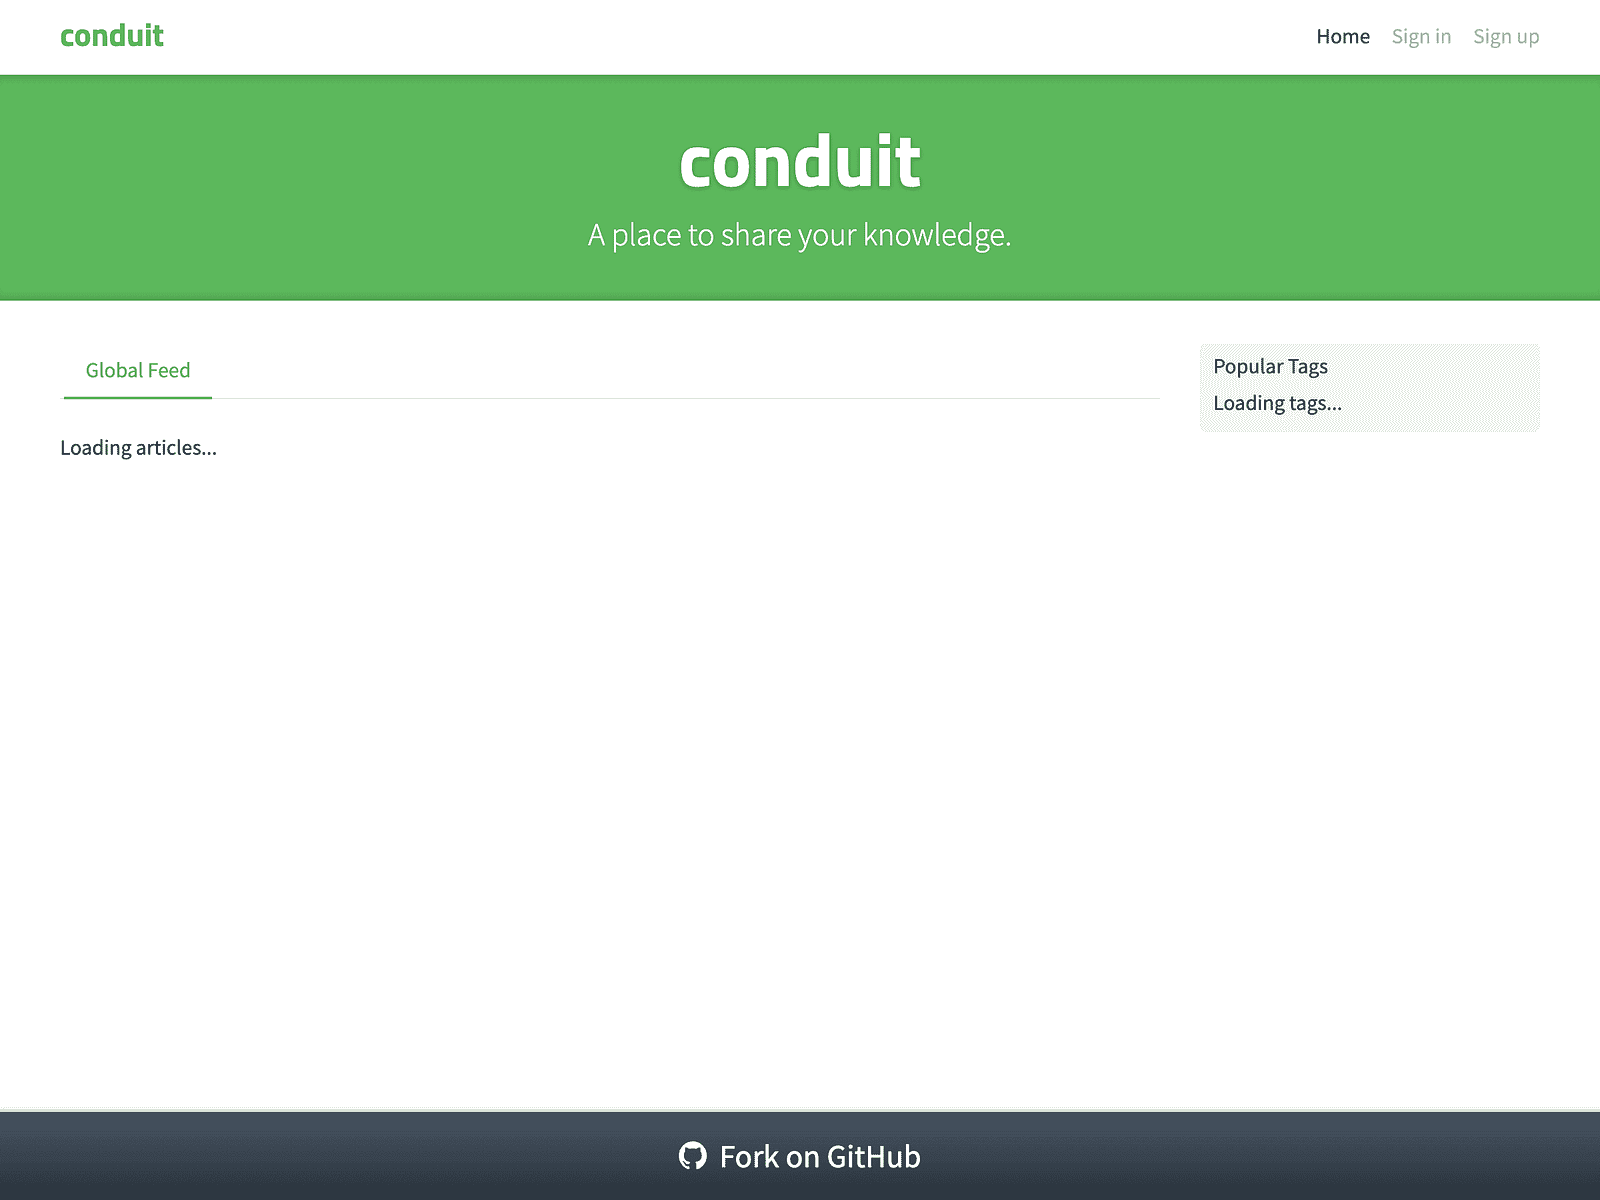
Navigate to demo.realworld.ioThe AI uses the navigate_page tool, Chrome opens, and the Conduit homepage loads. You'll see the browser window unless you configured headless mode.

To document what you see, just ask:
Take a screenshot of the homepageThe AI captures the current page with take_screenshot and shows you the result. This is useful for visual documentation or verifying that a page looks correct.
You can interact with any element on the page without writing CSS selectors or inspecting element IDs. Just describe what you want:
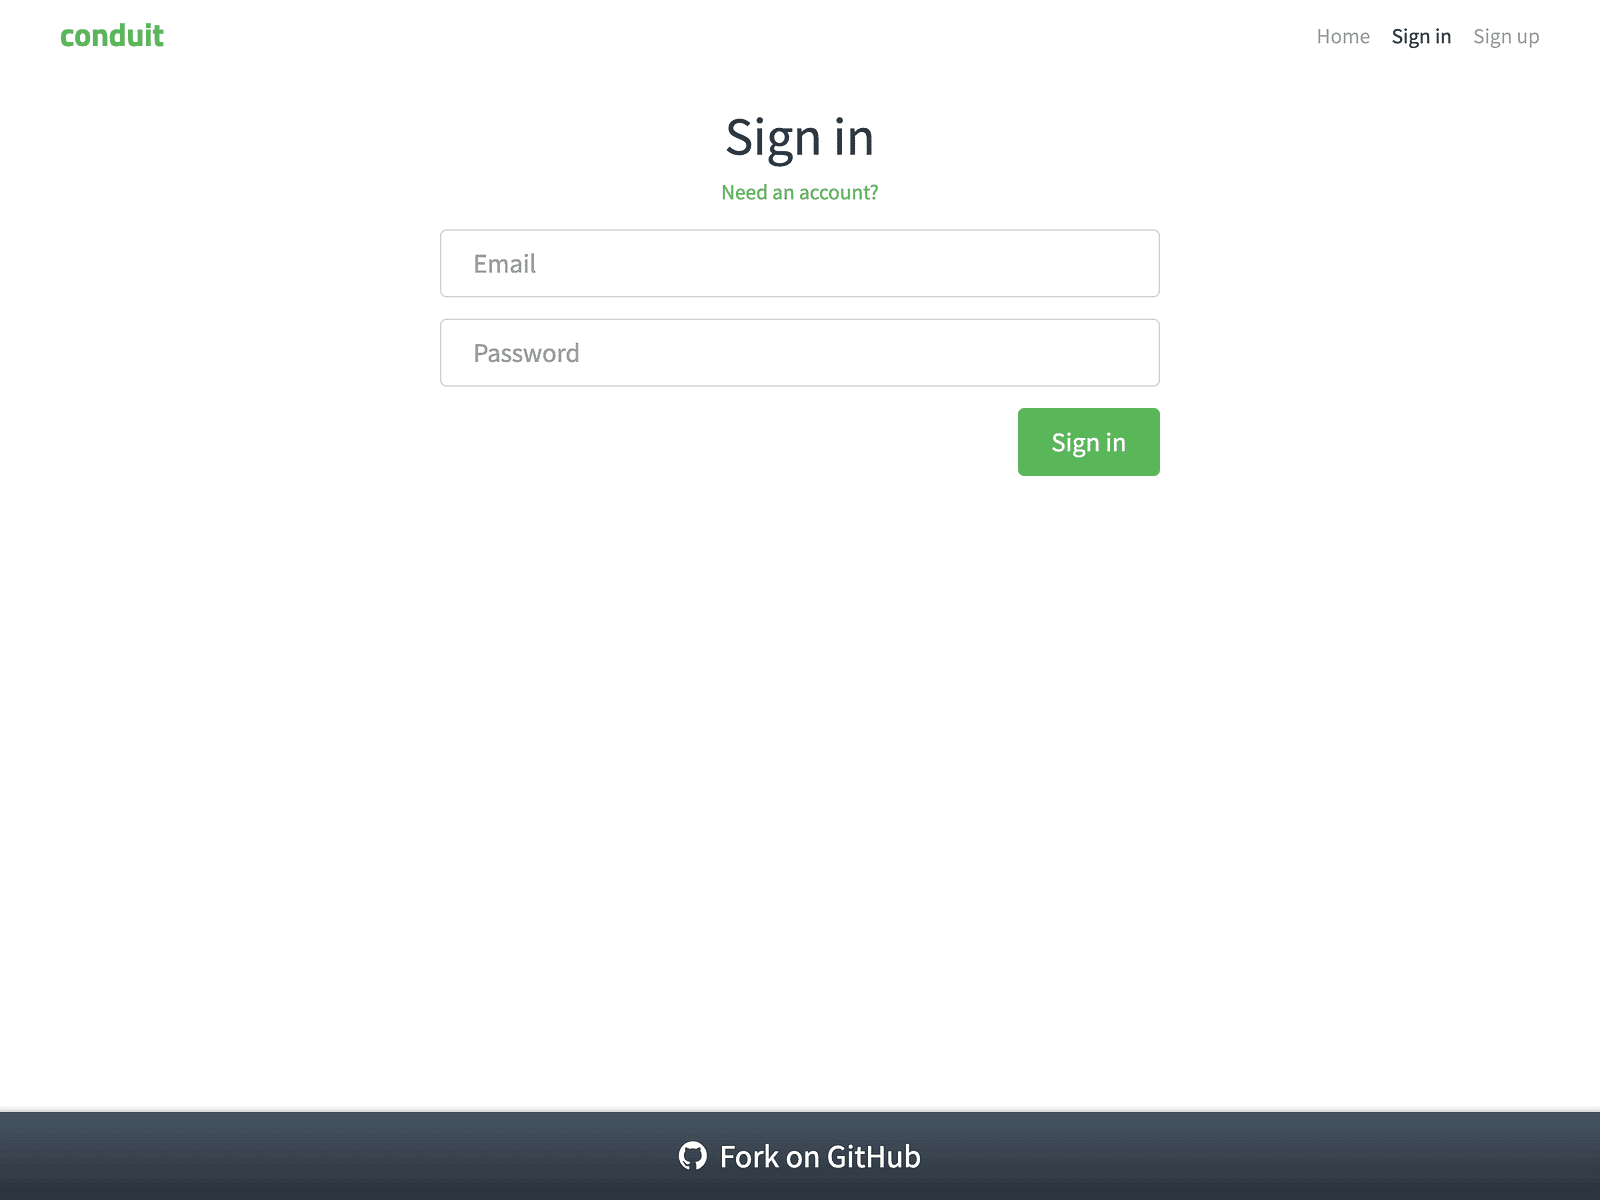
Click the Sign in linkThe AI figures out which element you’re talking about and clicks it using the click tool. The sign-in page loads.
You can hover over elements, too:
Hover over the Sign up linkThe AI uses the hover tool. If there's a tooltip or dropdown, it appears.
Forms are where browser automation gets tedious if you’re writing scripts. With Chrome DevTools MCP, you just describe what you want filled in.
Fill one field at a time:
Fill in the email field with test@example.com
Fill in the password field with testpass123
Or fill multiple fields at once:
Fill out the sign-in form with email test@example.com and password testpass123
The AI uses fill_form to handle all the fields in one go. Here's what the filled form looks like:
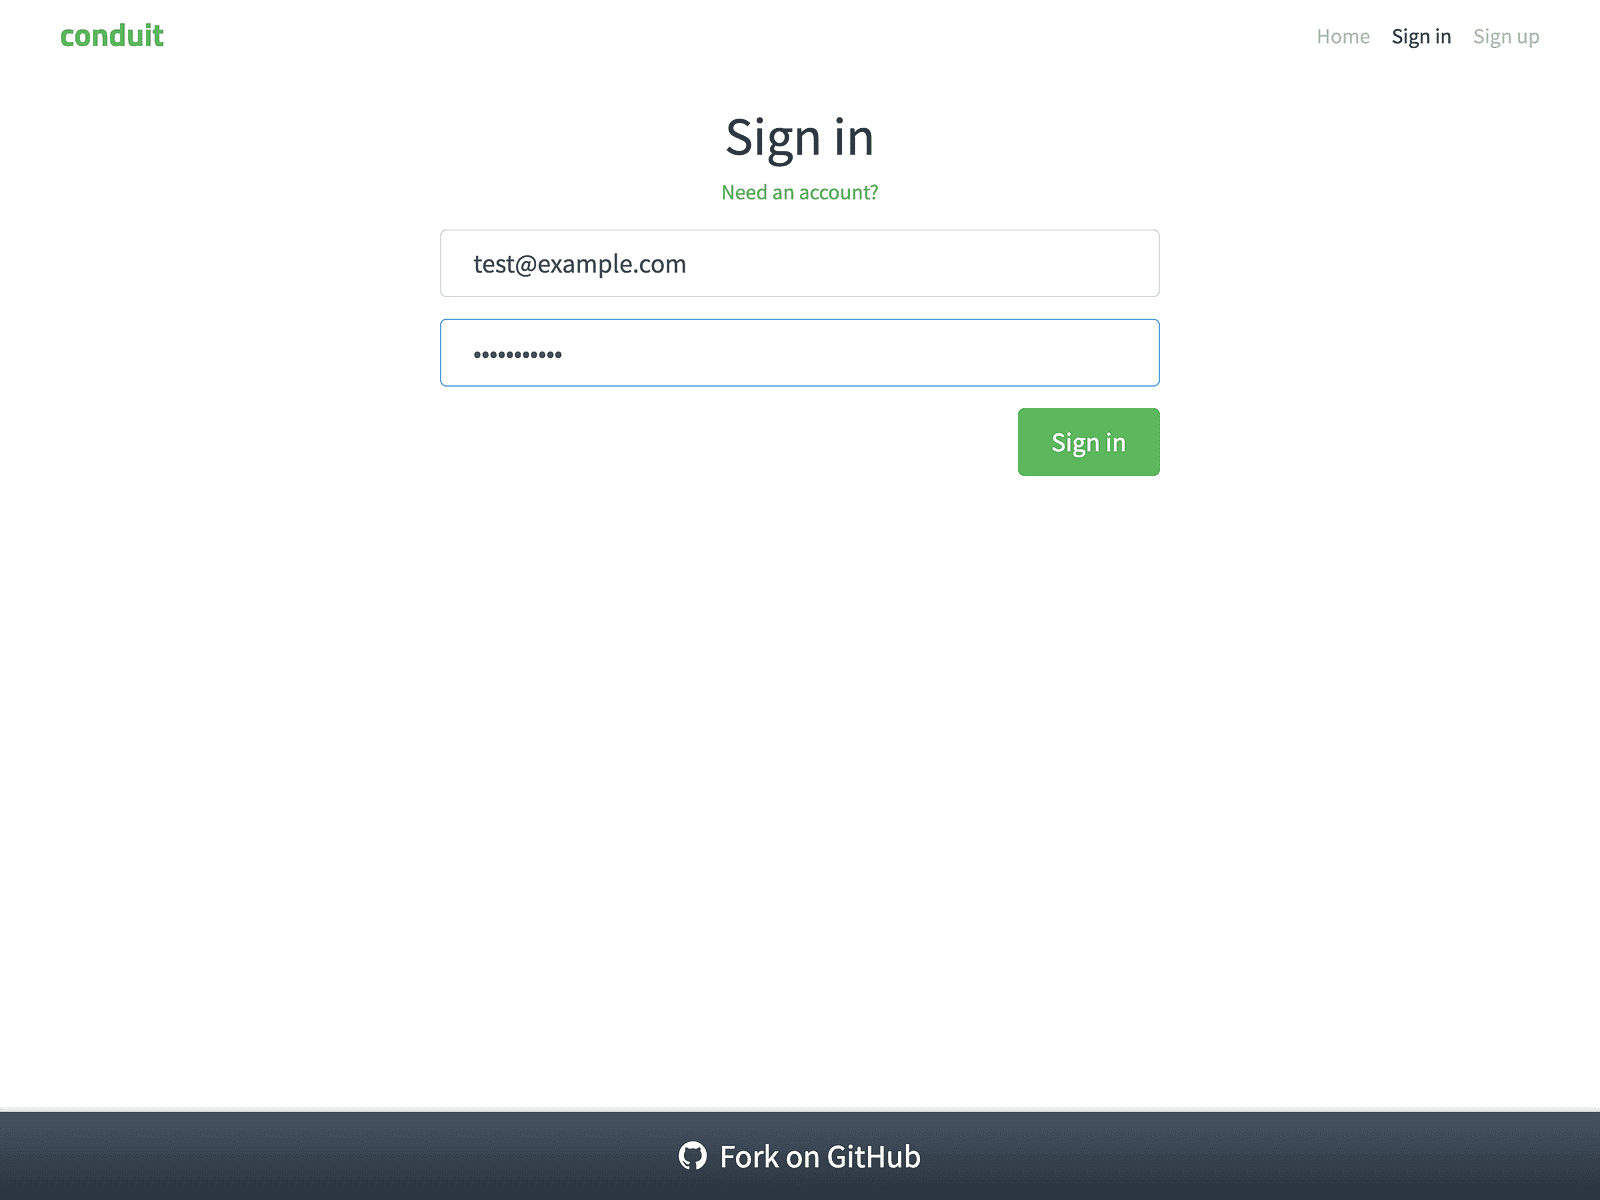
The AI identifies the right input fields based on your description. You don’t touch the HTML.
Chrome DevTools MCP gives you three core tools for debugging: list_console_messages to view console output, list_network_requests to see network activity, and evaluate_script to run JavaScript and extract data from pages.
When you use these tools through your AI assistant, you’re having a conversation. You ask questions in natural language, and the AI translates them into MCP tool calls behind the scenes.
Here’s what that looks like:

The AI assistant understands your intent and executes the appropriate Chrome DevTools tools, then presents the results in a readable format. Let’s see how these work in practice.
Console errors are usually the first place to look when something breaks. Instead of opening DevTools manually, just ask your AI assistant:
Navigate to demo.realworld.io and check the console for any errorsThe AI loads the page and checks the console using list_console_messages. Here's what it finds:
Error> Access to XMLHttpRequest at 'https://api.realworld.io/api/articles'
from origin 'https://demo.realworld.io' has been blocked by CORS policy
Error> Access to XMLHttpRequest at 'https://api.realworld.io/api/tags'
from origin 'https://demo.realworld.io' has been blocked by CORS policy
These CORS errors (Cross-Origin Resource Sharing)—are a browser security feature that restricts web pages from making requests to different domains) and explain why the page shows “Loading articles…” and “Loading tags…” instead of actual content:
You can dig deeper by asking the AI to filter and interpret these messages:
Are there any errors or warnings on this page?The AI analyzes the console output and tells you: “Yes, there are two CORS errors blocking API requests for articles and tags.”
This gives you immediate visibility into what’s breaking without manually opening the DevTools console.
Console errors often point to network problems. To understand what’s actually happening with your requests, check the network activity:
Show me what network requests are made on the homepageThe AI uses list_network_requests and returns a list of all requests. You'll see successful requests (CSS, fonts, JavaScript files) and failed ones:
https://demo.realworld.io/ GET [success - 200]
https://demo.realworld.io/main.css GET [success - 200]
https://demo.realworld.io/main.js GET [success - 200]
https://conduit.productionready.io/api/tags GET [failed - 307]
https://conduit.productionready.io/api/articles?limit=10&offset=0 GET [failed - 307]
https://api.realworld.io/api/tags GET [failed - net::ERR_FAILED]
https://api.realworld.io/api/articles?limit=10&offset=0 GET [failed - net::ERR_FAILED]
Ask follow-up questions to dig deeper:
Are there any failed requests?The AI filters the list and identifies the problem: “Yes, four API requests failed. Two returned 307 redirects, and two failed completely with ERR_FAILED errors.”
This helps you spot issues quickly without manually inspecting the Network tab.
Beyond viewing console and network data, you can run code directly on the page to check its state or extract information. Use evaluate_script for this:
Check if any articles are displayed on the homepageThe AI runs JavaScript to count article elements:
const articles = document.querySelectorAll('.article-preview');
return articles.length;
Result: “There are 0 articles displayed. The page shows ‘Loading articles…’ which suggests the API errors are preventing content from loading.”
You can extract more complex data, too:
Get the page title and main heading textThe AI evaluates:
return {
 pageTitle: document.title,
 mainHeading: document.querySelector('h1')?.textContent
};
Result: {pageTitle: "Home — Conduit", mainHeading: "conduit"}
This lets you verify page content, extract structured data, or check that dynamic elements are loaded correctly. The take_screenshot and take_snapshot tools complement this by capturing visual and structural documentation when you need it.
These three debugging capabilities work together naturally. Start with console messages to spot errors, check network requests to understand what failed, then use JavaScript evaluation to verify how those failures affect the page, all through conversation with your AI assistant—no switching between tools or writing inspection scripts.
AI assistants can build web interfaces, but they can’t see what they create. You end up manually taking screenshots and asking for adjustments.
Chrome DevTools MCP changes this. The AI takes its own screenshots, verifies layouts, and iterates until everything looks right.
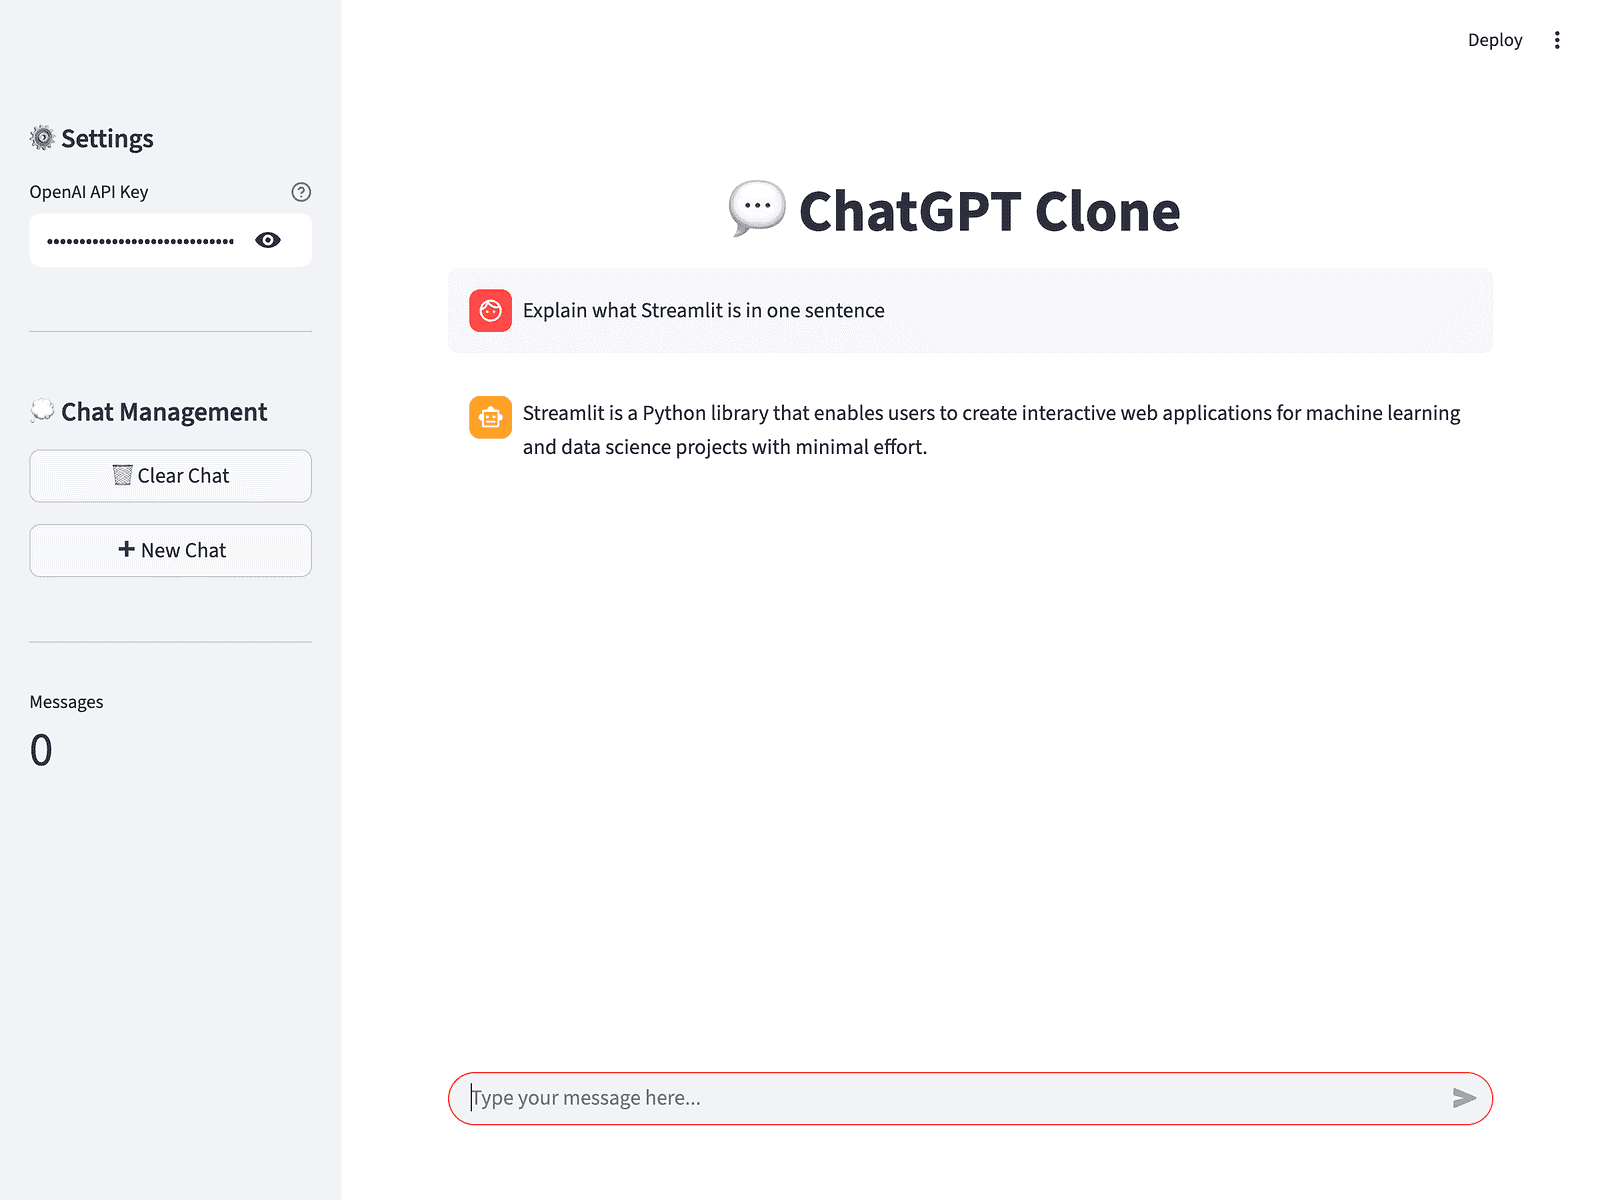
Let’s build a ChatGPT clone using Streamlit. You’ll need an OpenAI API key for this . Provide it to your AI assistant when running the prompt so it can verify the app works correctly. Here’s the prompt:
Build a ChatGPT clone using Streamlit. Create a clean chat interface
with message history, text input, and OpenAI API integration. Include
a sidebar for API key management and chat management features (Clear
Chat, New Chat, message counter). Use Chrome DevTools MCP to verify
the UI at each step.
The AI creates the app with a sidebar and takes a screenshot to verify the initial layout:
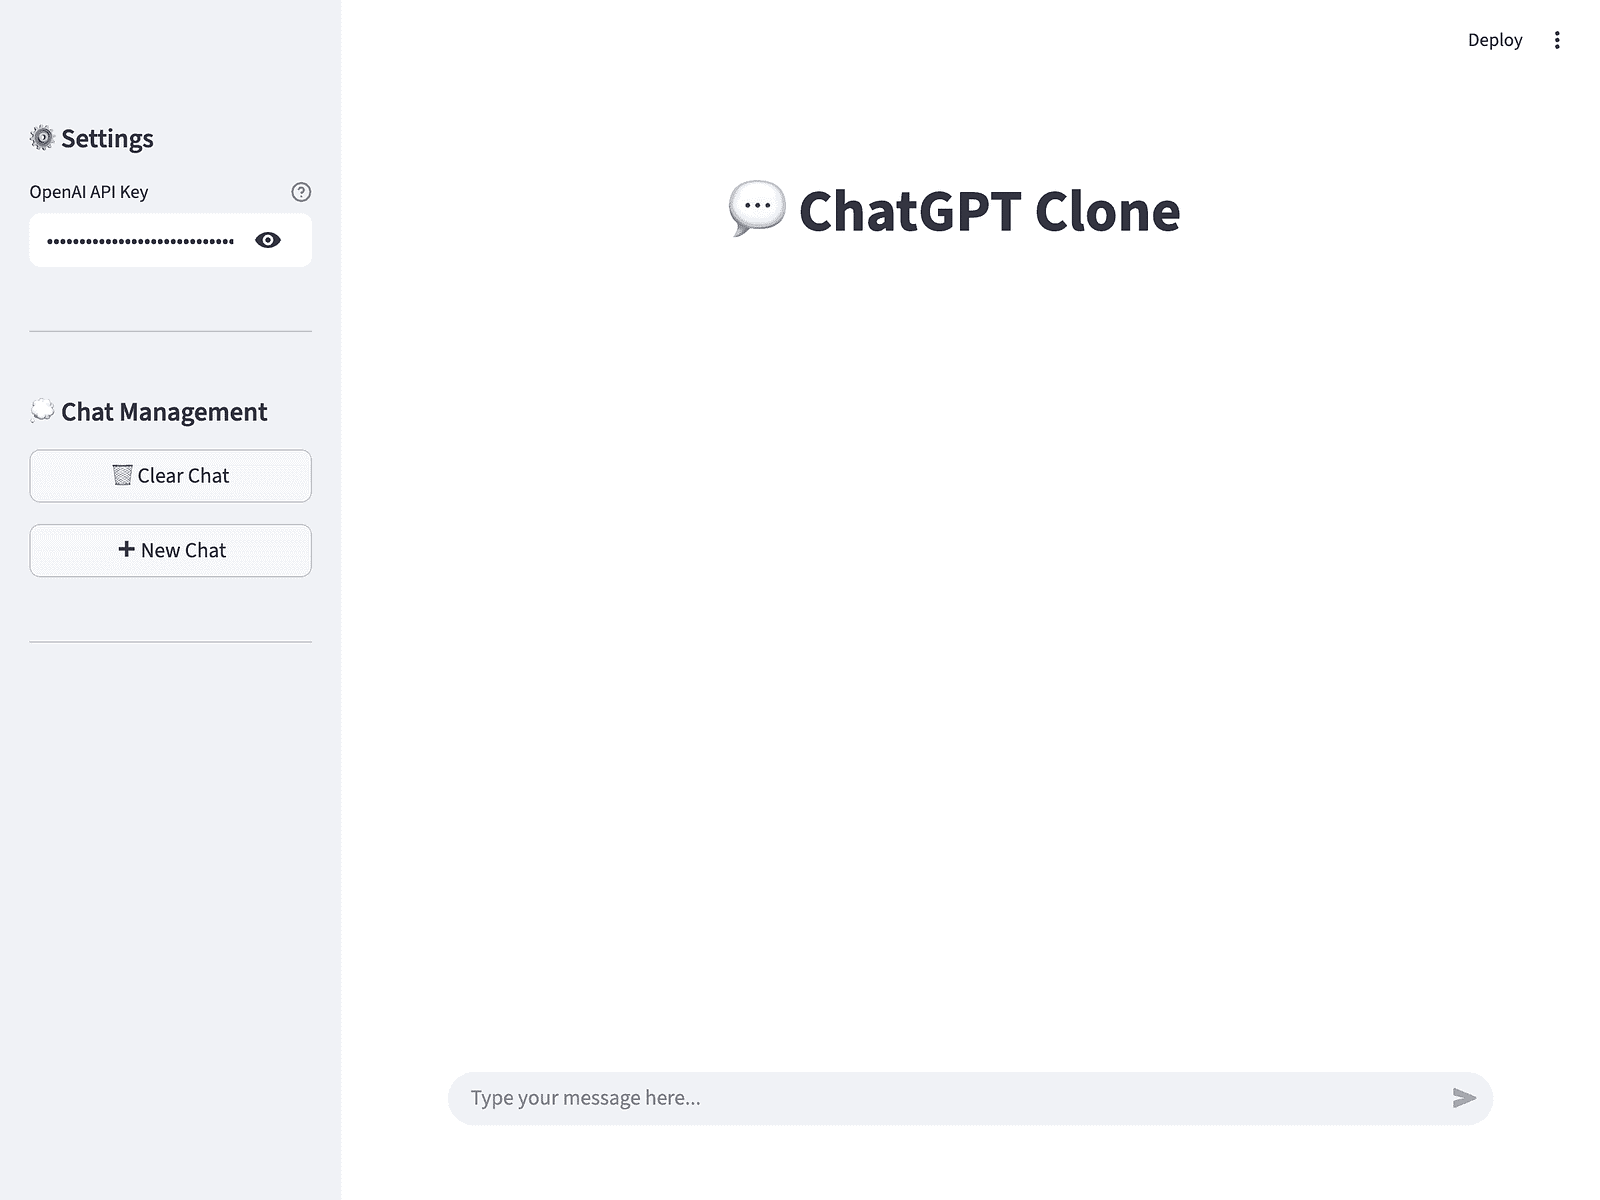
The sidebar includes API key input, Clear Chat and New Chat buttons, and a message counter at 0. With the interface ready, let’s see if the chat functionality works.
Testing with a simple question:
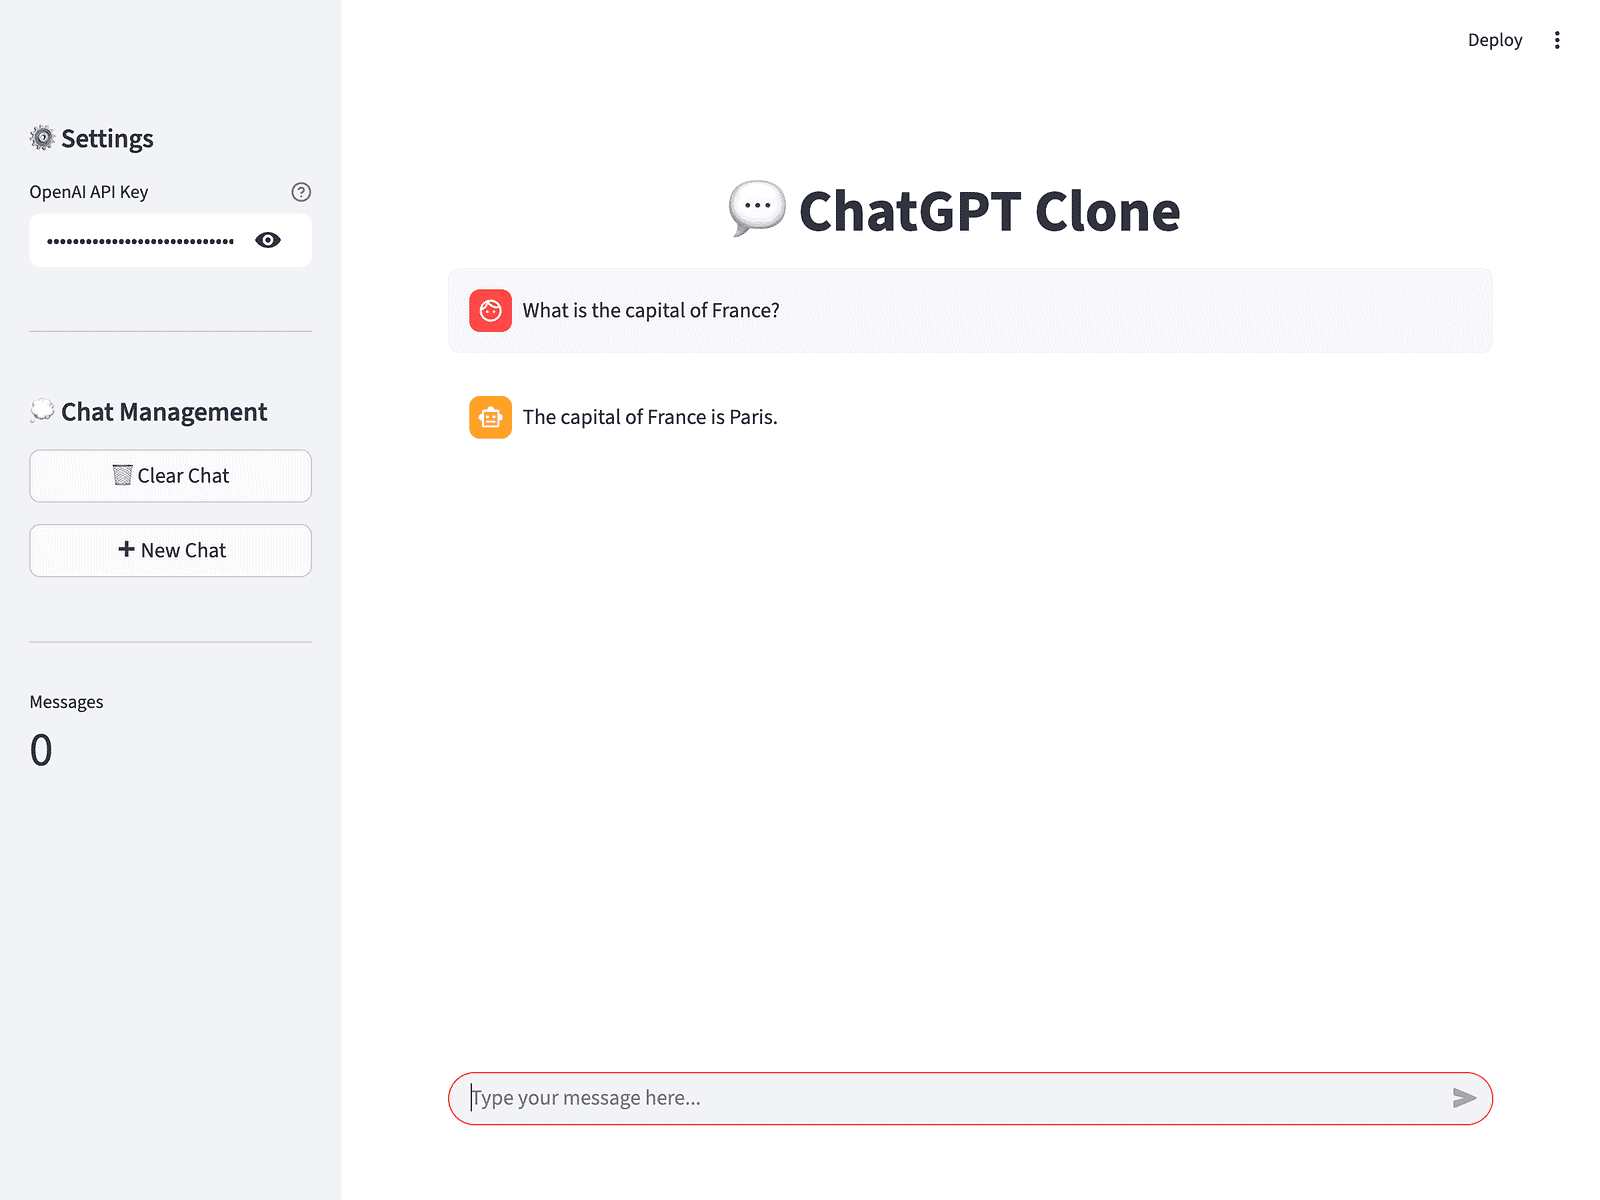
The chat responds correctly, and the counter shows two messages (in the next screenshot). But can it handle multi-turn conversations?
Testing conversation context:
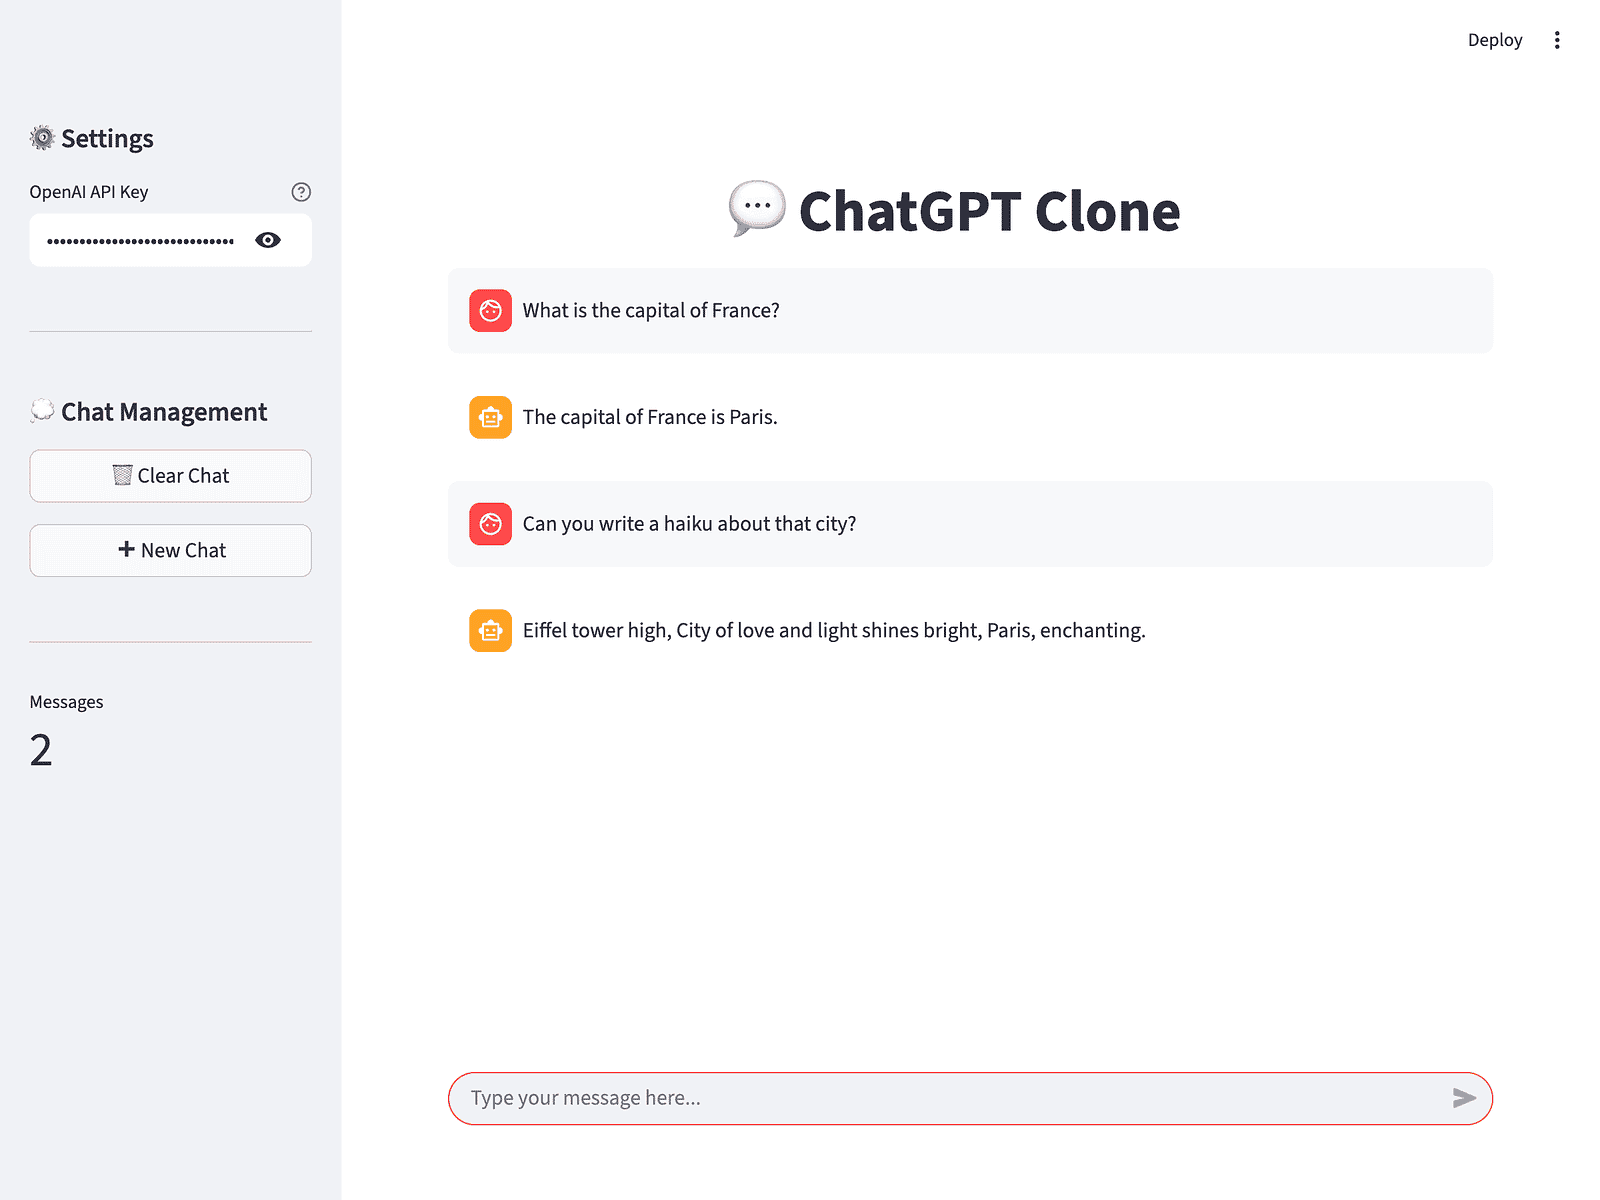
The AI remembers the previous exchange. Next, we need to verify the Clear Chat feature.
Clicking the Clear Chat button:
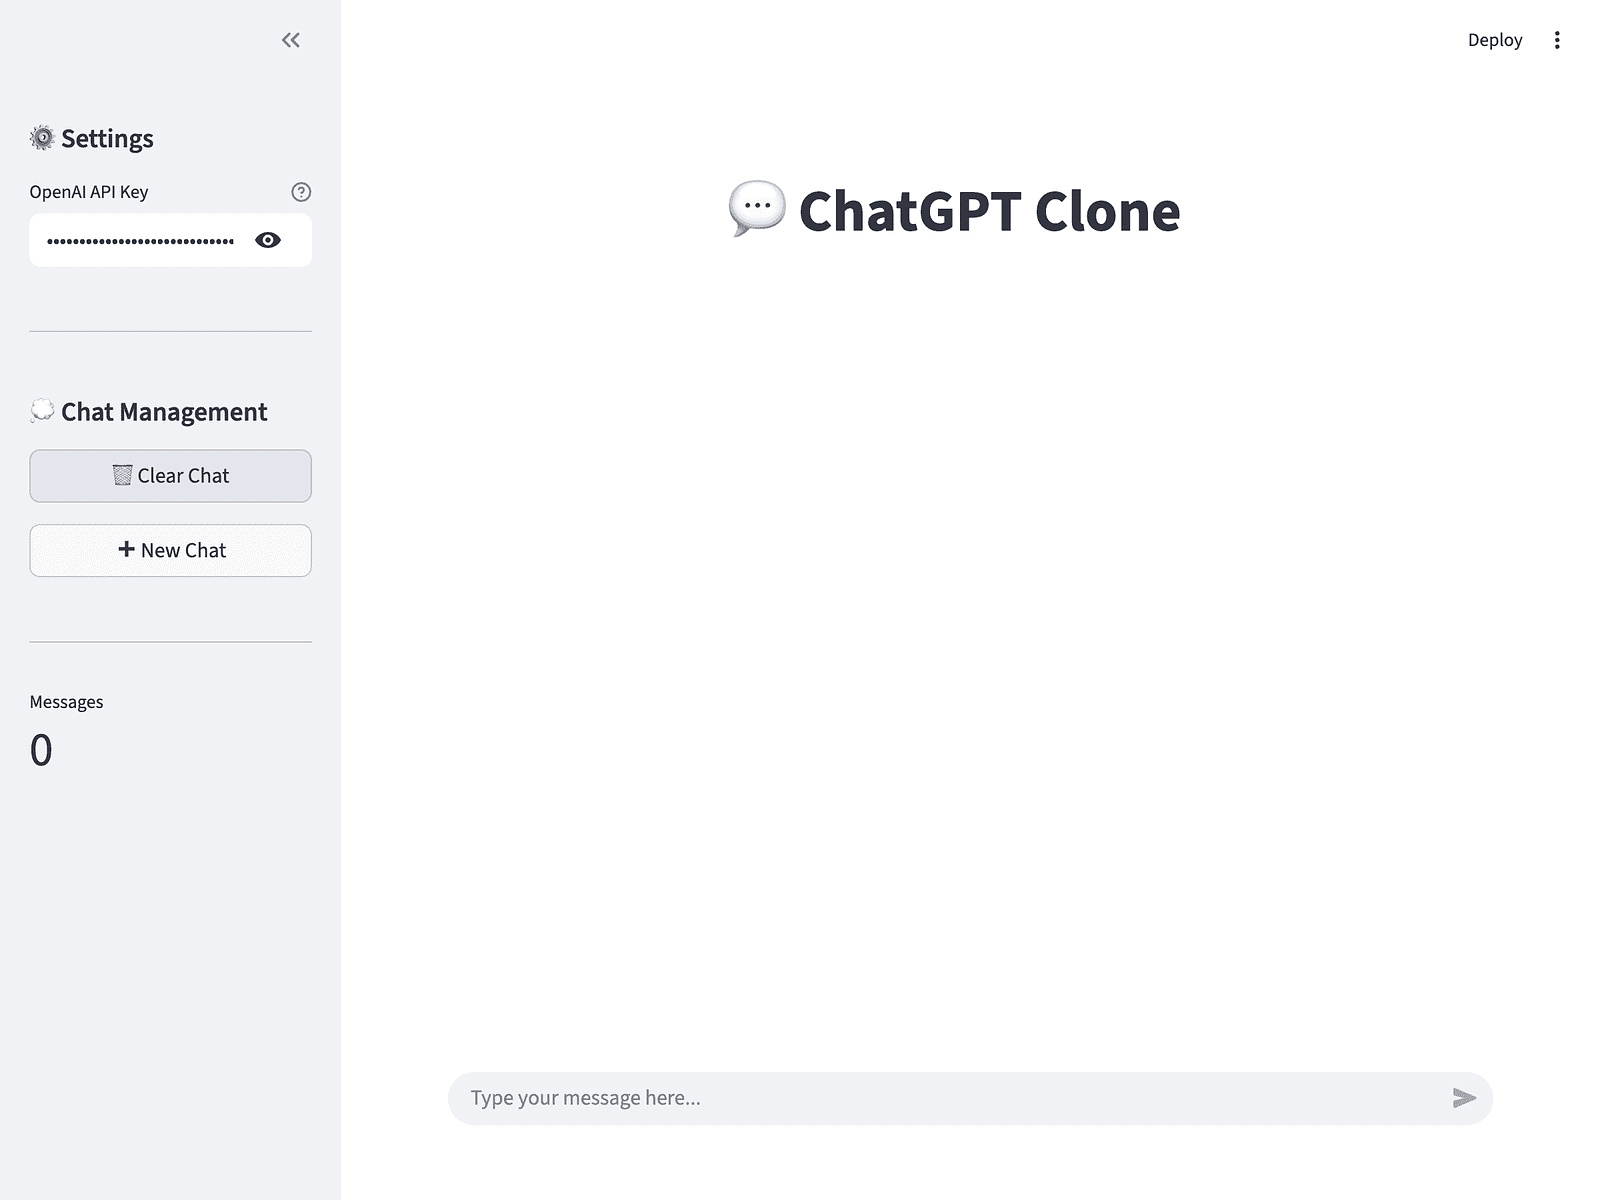
The chat clears successfully, and the counter resets to 0.
Starting a new chat:
Perfect. The AI built a working ChatGPT clone, verified the appearance at each step, and tested all features without human intervention.
This works for any framework. React, Vue, Svelte, vanilla HTML. The AI verifies layouts, tests interactions, and catches bugs before you see the code.
Chrome DevTools MCP gives you browser automation through conversation. You describe what you want, and your AI assistant handles the technical details. No scripts to write, no selectors to debug.
Throughout this article, we covered the basics: installing the server, navigating pages, filling forms, clicking elements, and taking screenshots. Then we moved into debugging with console inspection, network monitoring, and JavaScript evaluation. Finally, we saw how these tools work together to build frontends where the AI can see what it creates.
Start by navigating to a site you’re working on and ask your AI to check for console errors or inspect network requests. If you’re using Claude Code, our Claude Code best practices guide covers effective prompting patterns for tool use. Take screenshots of different states. Test form submissions.
Then combine multiple tools: navigate to a page, fill out a form, submit it, and capture the result. Check console messages, list failed network requests, and run JavaScript to verify page state.
Once you’re comfortable with the basics, create a small UI component with your AI and let it verify the layout at each step. Watch how it catches visual issues before you manually check.
For performance work, use the performance tools (performance_start_trace, performance_stop_trace, performance_analyze_insight) to profile page load times and identify bottlenecks. Use emulation tools (emulate_cpu, emulate_network, resize_page) to test under different conditions.
Chrome DevTools MCP is one server among many. Combine it with file system servers, database tools, or API integrations to build workflows that span multiple systems. For more MCP examples, see our Codex CLI MCP tutorial and Google ADK MCP tutorial.
If you want to build your own MCP servers, check out Building an MCP Server and Client with FastMCP 2.0.
Top DataCamp Courses
Course
Course
Course
blog
Abid Ali Awan
15 min
blog
Adejumo Ridwan Suleiman
14 min
Tutorial
Josep Ferrer
Tutorial
Bex Tuychiev
Tutorial
Aashi Dutt
Tutorial
Khalid Abdelaty