Course
Clustered column charts are among the most helpful and, hence, commonly used types of charts. Because of their popularity, they can be created in virtually all programs and software geared toward data analysis, and Excel is no exception.
In this article, we'll learn what a clustered column chart is and how to create and customize it in Excel. Besides, we'll cover some additional techniques and best practices for clustered column charts in Excel.
For a quick start or refresher on Excel, check out the Learn Excel course.
The Quick Answer: How to Create a Clustered Column Chart in Excel
To create a clustered column chart in Excel, follow these steps:
- Select the columns of your Excel table with the categories and values to be plotted, including the headers of those columns.
- Open the “Insert” tab.
- Click on the “Insert Column or Bar Chart” button.
- Click on the “Clustered Column” button.
What Is a Clustered Column Chart and What Is It Used for?
A clustered column chart, also known as a grouped bar chart, is a visualization that displays the discrete values for two or more types of items by category.
Such values are shown as vertical rectangular columns, the height of each column corresponding to the value it represents. These vertical columns are clustered by category, and all data series (types of items) share the same x-axis labels since the categories are the same for each.
Each cluster of columns represents a specific category, while each column in a cluster represents a certain type of items.
Clustered column charts compare different data series, each corresponding to a distinct type of item, category-wise.
Features of Clustered Column Charts
A clustered column chart is characterized by two main features:
- Multiple data series: Clustered column charts display multiple data series in the chart legend, chart filters, and when hovering over the columns on the plot area, similar to stacked-column, multi-line, and combo charts.
- Differentiation by colors and labels: Data series on a clustered column chart is easily discernible by different colors, fill types, transparencies, borders, or data labels, similar to stacked-column, combo, and area charts.
To learn or revise different types of data visualizations in Excel and to fully leverage the tool's power, feel free to explore the Visualizing Data in Excel tutorial.
Why Excel Is Good For Creating Clustered Column Charts
There are numerous advantages of using Excel for creating clustered column charts:
- Excel allows us to create a basic clustered column chart in four quick, straightforward steps.
- Excel provides intuitive and efficient ways of customizing a clustered column chart.
- Excel facilitates the usage of an already-created clustered column chart through filters (by category and data series) and interactive information reading upon hovering.
- Excel applies by default many best practices for clustered column charts.
- Excel offers advanced techniques and features for creating specific varieties of clustered column charts.
- Creating and customizing clustered column charts in Excel requires no programming skills.
- Excel automatically updates the chart as soon as the source data is updated.
- Excel is widely used for data analysis by companies all over the world.
How to Create and Customize a Clustered Column Chart in Excel
Now that we know what a clustered column chart is and why Excel is suitable for creating it, let's see how we can build and format a basic clustered column chart in Excel.
Throughout this and the next section, we're going to work with the table below, which contains the names of fictitious pet shops and the number of cats, dogs, and hamsters each of them sold during a certain period.
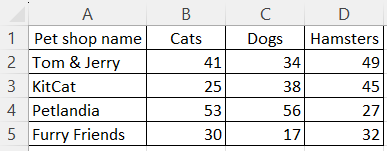
An example Excel table with pets sold by fictitious pet shops. Image by Author
It goes without saying that before building a clustered column chart in Excel, it's important to properly clean and transform your data using suitable methods and best practices. Check out the Data Preparation in Excel course to learn more about this.
Creating a clustered column chart
To create a clustered column chart in Excel, you need to take four simple steps:
- Select the columns of your Excel table containing the categories and values to be plotted, including the headers of those columns. If the columns of interest aren't adjacent, press Ctrl on your keyboard before selecting the next column.
- Open the “Insert” tab on the Excel ribbon.
- Click on the “Insert Column or Bar Chart” button of the “Charts” group.
- Click on the “Clustered Column” button of the “2-D Column” group.
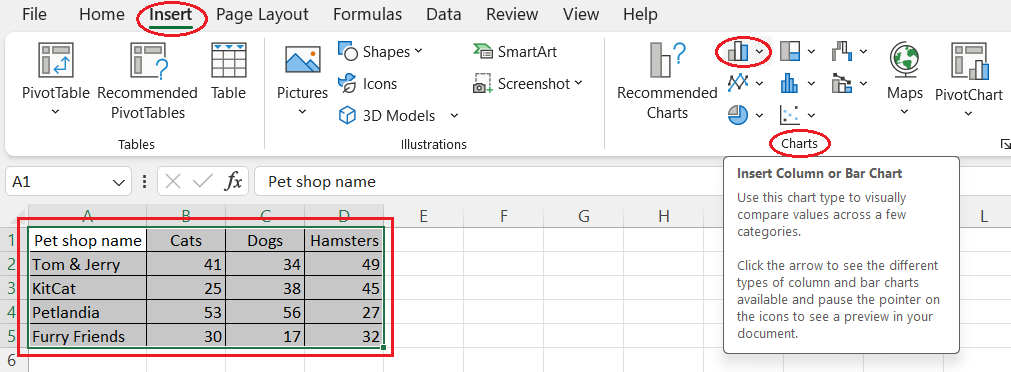
Selecting the data and opening the Insert Column or Bar Chart feature. Image by Author
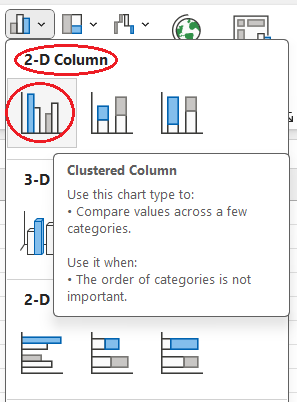
Opening the Clustered Column option. Image by Author
Customizing a clustered column chart
Excel offers numerous ways of adjusting visuals. Many apply to all types of Excel charts, such as adding or removing chart elements or filters, changing the chart style or color scheme, customizing text, and moving the legend.
You can learn more in the tutorial on How to Create and Format a Combo Chart in Excel, in the chapter “How to Format a Combo Chart” in Excel.
In this section, we'll focus on the ways of formatting the data series constituting our clustered column chart.
- Click on one of the columns of the data series you want to customize and right-click on your mouse.
- Select “Format Data Series…”
- Click on the “Fill & Line” button in the “Format Data Series” pane on the right side of the screen.
- Upon clicking on the “Fill” drop-down section, you can play with the following fill settings until obtaining a satisfactory result:
-
- fill type (solid, gradient, picture, texture, pattern, or no fill)
- color
- transparency
- other possible settings available for some kinds of fills
- Upon clicking on the “Border” drop-down section, you can play with the following border settings until obtaining a satisfactory result:
-
- border type (commonly, no border or solid line)
- color
- transparency
- width
- dash type
- other settings (quite specific and rarely used)
Note: if you want to format only one column of a data series, e.g., for highlighting a column among the others, click twice, with a little delay on that column and then follow the above instructions.
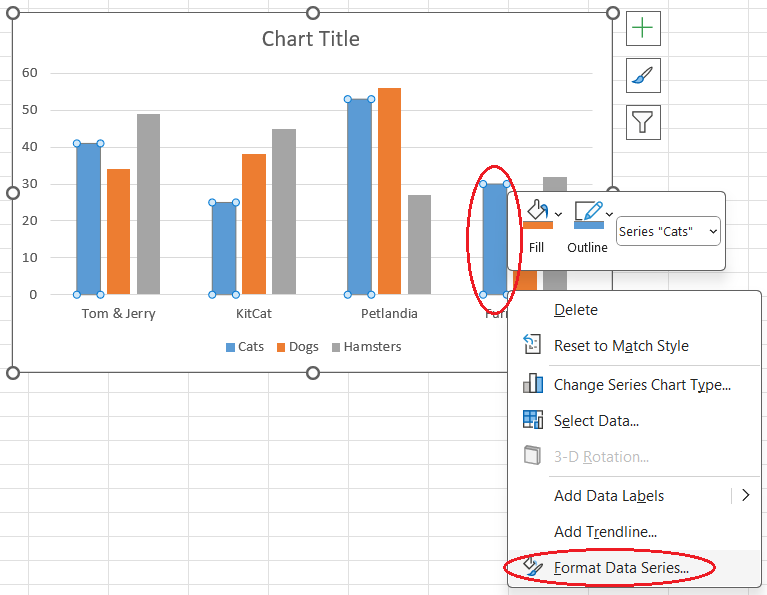
Opening the Format Data Series pane. Image by Author
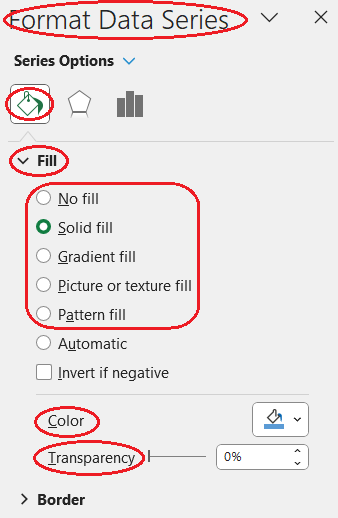
Adjusting the fill settings. Image by Author
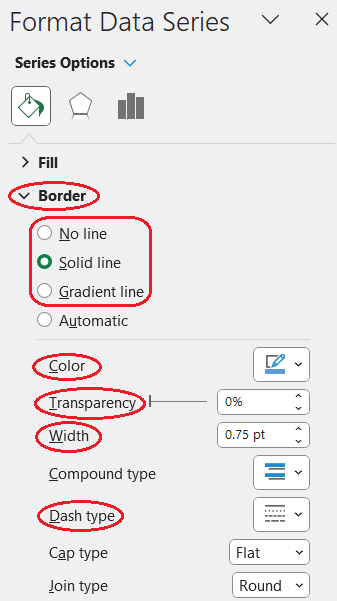
Adjusting the border settings. Image by Author
Learn Excel Fundamentals
Additional Techniques and Features for Clustered Column Charts
Now, let's explore some additional techniques for creating specific varieties of clustered column charts in Excel.
How to change the clustering criterion for a clustered column chart in Excel
What if we want to change the clustering (grouping) criterion for our chart?
By default, each group of columns refers to a specific category from the column containing category names. In contrast, each column in a group of columns represents a particular type of item taken from the corresponding column header.
However, in some cases, we may want to swap the categories with the types of items.
Returning to our cats, dogs, and hamsters example, let's say that we need to cluster them by animal type rather than by pet shop:
- Select the plot area of your clustered column chart and right-click on your mouse.
- Select “Change Chart Type…”
- In the pop-up window, click on the second preview image (to the right of the one selected by default).
- Press “OK”.
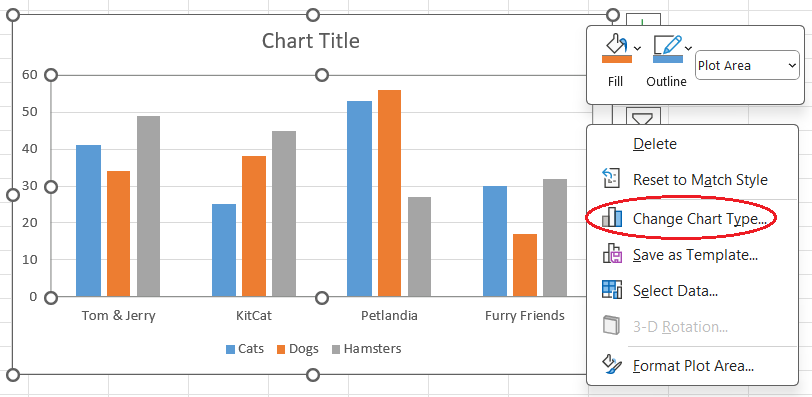
Opening the Change Chart Type window. Image by Author
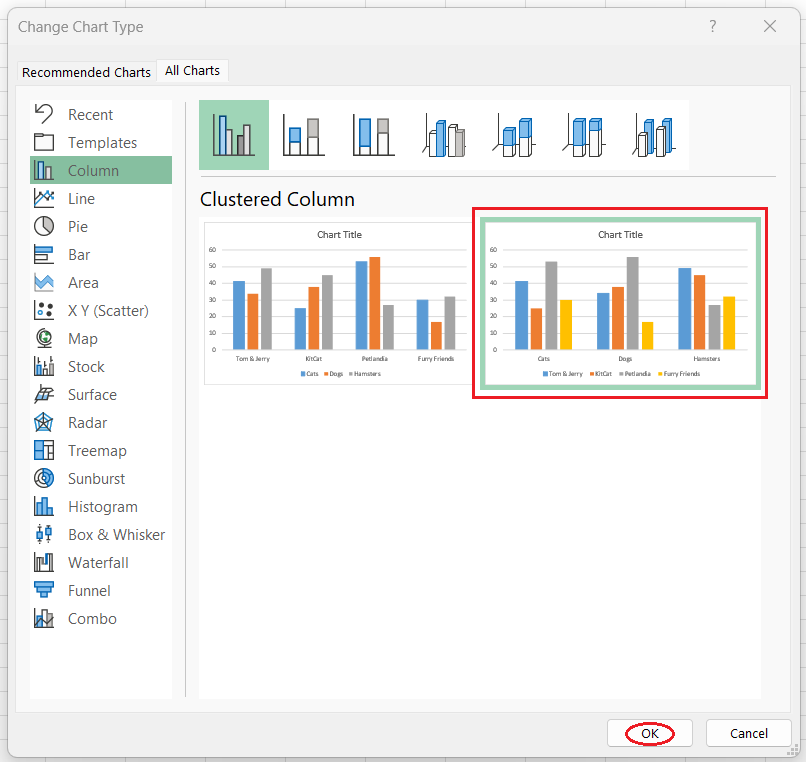
Changing the clustering criterion for a clustered column chart. Image by Author
How to insert a 3D clustered column chart in Excel
Creating a 3D variant of a clustered column chart in Excel is as easy as making a regular one:
- Select the columns of your Excel table containing the categories and values to be plotted, including the headers of those columns. If the columns in interest aren't adjacent, press Ctrl on your keyboard before selecting the next column.
- Open the “Insert” tab on the Excel ribbon.
- Click on the “Insert Column or Bar Chart” button of the “Charts” group.
- Click on the “3-D Clustered Column” button of the “3-D Column” group.
Remember, though, that creating 3D clustered column charts isn't considered a good practice, as discussed further in the section on “Best Practices for Clustered Column Charts.”
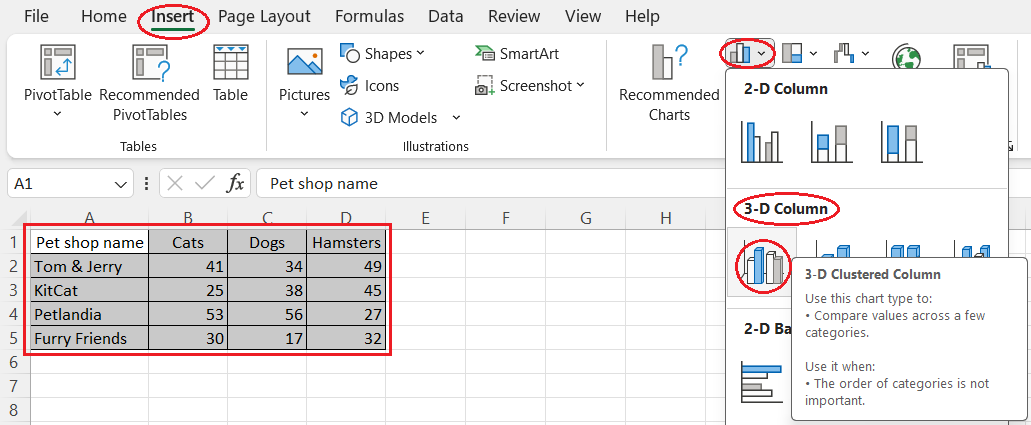
Creating a 3D clustered column chart. Image by Author
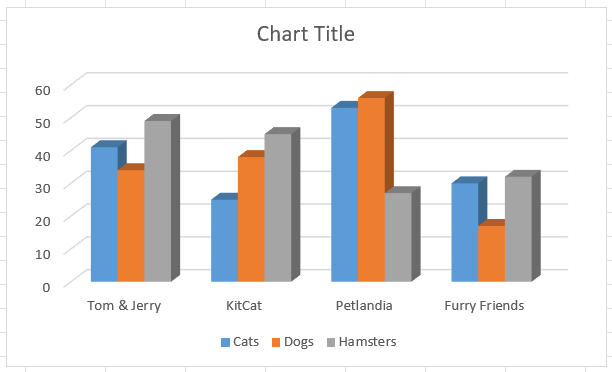
A 3D clustered column chart. Image by Author
How to insert a clustered column and line combo chart in Excel
Sometimes, we may want to combine a clustered column chart with a line chart on a single visual. This type of chart is called a combo chart or a combination chart.
A combo chart is commonly used to show the evolution of different types of data over the same period.
Therefore, our table with sold pets isn't the best use case for creating a combo chart since it doesn't contain either a time series or data types that are different by nature (such as sales and prices).
Let's use it anyway for learning purposes to see how we can build a clustered column and line combo chart in Excel:
- Select the columns of your Excel table containing the categories and values to be plotted, including the headers of those columns. If the columns of interest aren't adjacent, press Ctrl on your keyboard before selecting the next column.
- Open the “Insert” tab on the Excel ribbon.
- Click on the “Recommended Charts” button of the “Charts” group.
- Open the “All Charts” tab in the pop-up window.
- Select the “Combo” option from the list on the left side of the pop-up window.
- Select the necessary chart type for each data series in the lower part of the pop-up window: either “Clustered Column” or “Line.”
- If needed, tick the “Secondary Axis” box for data series with a different scale. Ensure consistency: the secondary axis should relate to all clustered column series or all line series.
- Press “OK”.
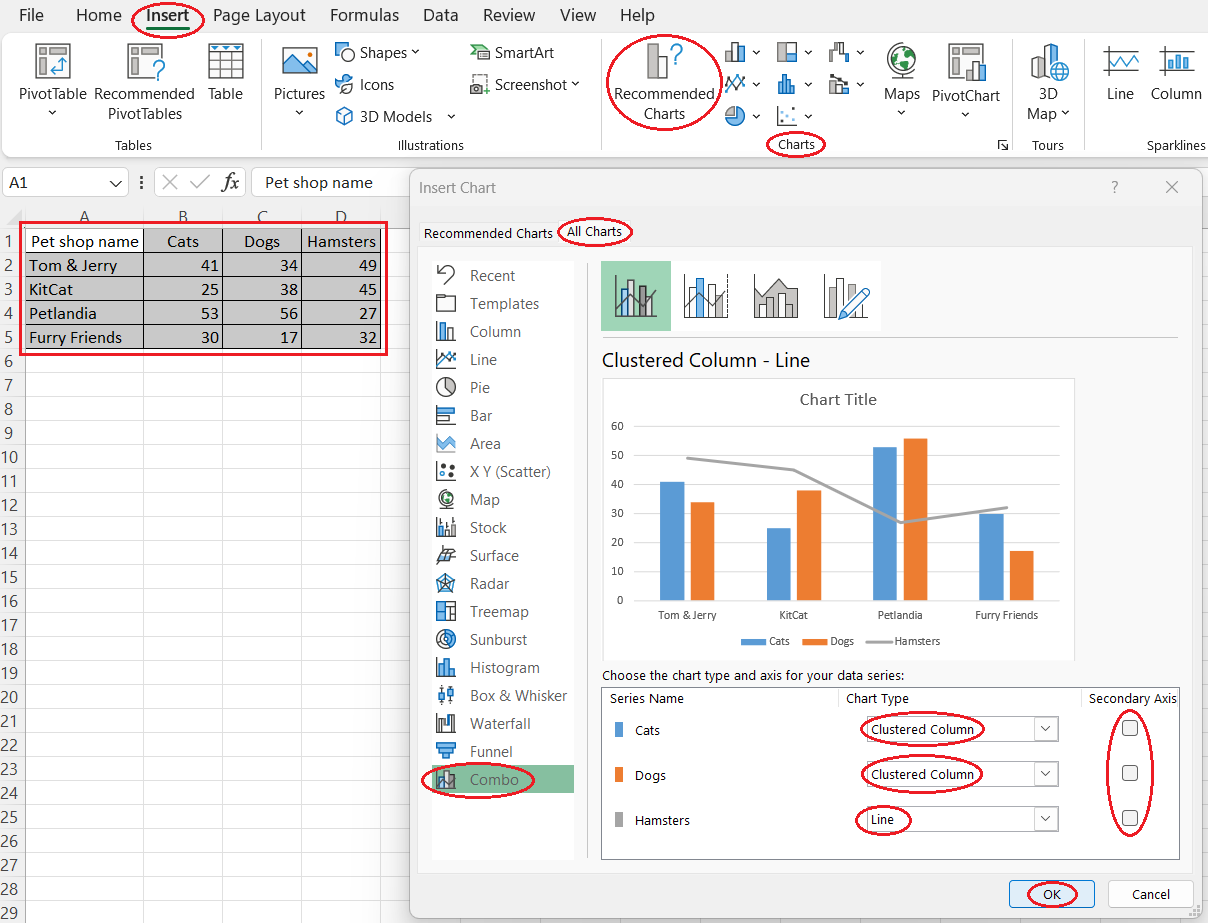
Creating a clustered column and line combo chart. Image by Author
Consider taking the Excel Fundamentals skill track to fully utilize Excel for visualizing and analyzing data.
Best Practices for Clustered Column Charts
Let's outline some best practices for creating clustered column charts in Excel.
Fortunately, Excel takes care of many of them by default, including adding an automatic legend, avoiding redundant elements, opting for a colorblind-friendly palette, starting the y-axis from zero, and making clustering obvious.
For the others, or if you want to adjust the defaults manually, it's recommended to follow the below practices to avoid typical caveats:
- Avoid too many clusters or too many data series in each cluster. Having any of these issues or both of them makes your clustered column chart cluttered and renders it difficult to capture tendencies across the clusters and/or types of items.
- Always add the legend. Given the various categories and types of items on a clustered column chart, it's crucial to keep the information well-labeled. While the cluster names appear on the x-axis, the types of items should be included in the chart's legend.
- Use clear chart and axis titles. Your titles should be informative and concise so that your target audience can immediately grasp what your chart is about.
- Avoid 3D clustered column charts. While we learned earlier how to create a 3D clustered column chart in Excel, remember that 3D variants of charts are almost always to avoid. This also applies to many other types of charts, except for sporadic cases (e.g., surface plots). The reason is that 3D distorts reality and impedes the correct interpretation of graphs.
- Avoid long labels on the x-axis of your chart. If your cluster names are too long, which results in too-long labels on the x-axis of your clustered column chart, consider opting for a clustered bar chart instead.
- Avoid redundant elements in the plot area. Gridlines, trendlines, data labels, pattern or gradient fill, borders, and special effects such as shadows or soft edges should be used cautiously and only when they add value to your data analysis.
- Avoid counterintuitive colors and their combinations. Keep in mind the common visual standards of your audience. For example, if the pet stores from our table were selling, say, wolves and foxes rather than cats, dogs, and hamsters, it wouldn't be a good idea for you to use orange color for wolves and grey for foxes. Doing so would be misleading for your chart's end users and result in wrong conclusions.
- Opt for a colorblind-friendly palette. This is especially important if you're going to present your work's results to a wide audience. The insights from your charts must be easily accessible to everyone.
- Start the y-axis from zero. The columns in a clustered column chart, like in a regular column chart, are supposed to show the absolute magnitude of the values they represent. Hence, cutting the y-axis is a bad practice for this chart type.
- Ensure that the columns within a cluster are closer to one another than the columns in different clusters. If you want to adjust the default gap width manually, make sure that the clusters remain well-distinguishable after your modifications.
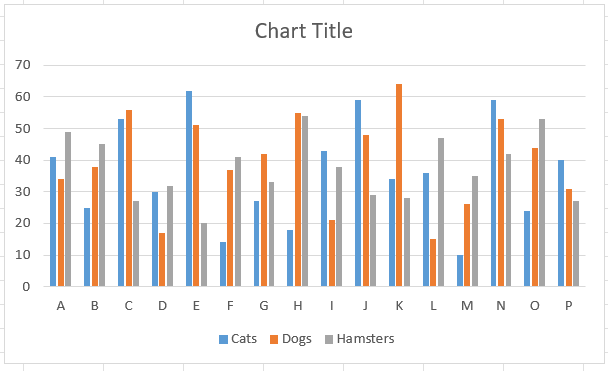
A clustered column chart with too many clusters. Image by Author
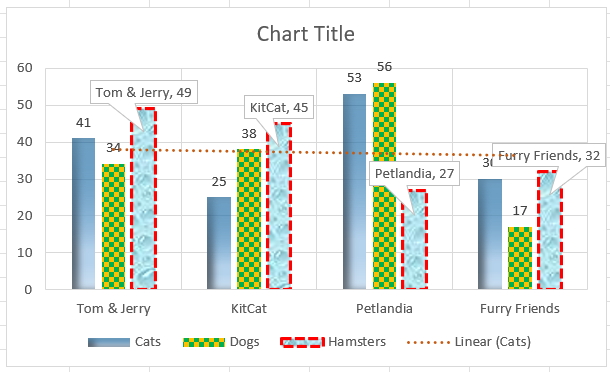
A clustered column chart with redundant elements. Image by Author
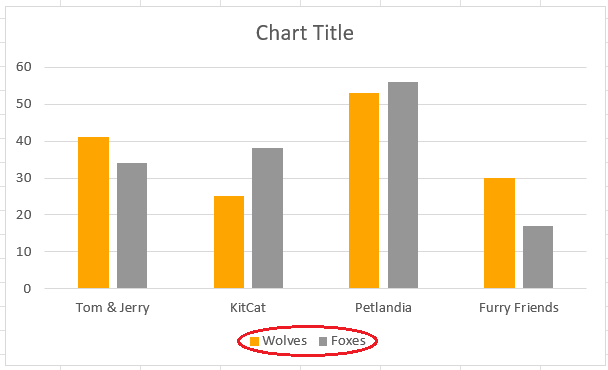
A clustered column chart with counterintuitive colors. Image by Author
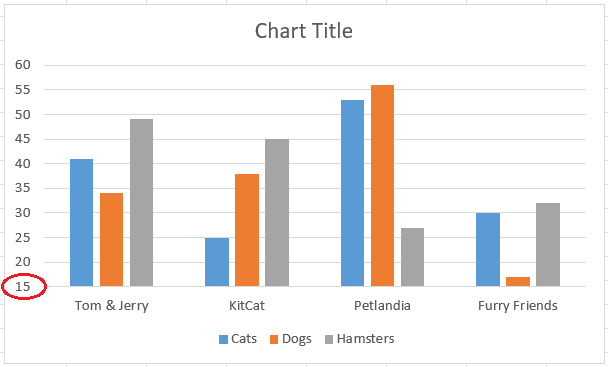
A clustered column chart with a cut y-axis. Image by Author
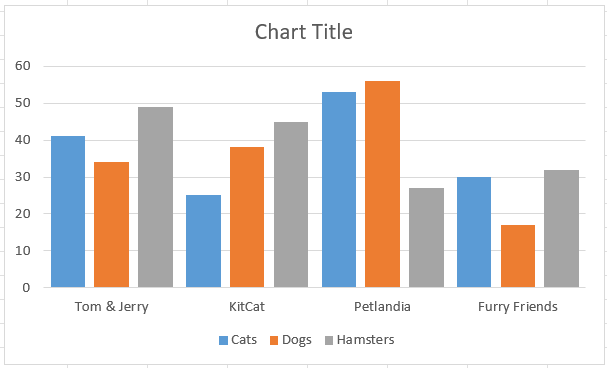
A clustered column chart with unobvious clustering. Image by Author
Conclusion
To wrap up, this article discussed what a clustered column chart is, its purpose, its key features, and why Excel is a good choice for creating this type of plot.
We also explored how to create and customize a clustered column chart in Excel, including its specific types and what best practices to follow when making them.
If you enjoyed this article, you may find the Data Visualization in Excel and Data Analysis in Excel courses helpful for continued learning.
Master Excel with DataCamp for Business
Equip your team with top-tier Excel skills through DataCamp for Business. Comprehensive training and performance tracking for business success.

FAQs
Can I create a clustered column chart in Excel if my data columns are not adjacent to each other?
Yes, you can create a clustered column chart with non-adjacent data columns. To do this, hold down the Ctrl key while selecting the different columns you want to include in your chart.
How can I add data labels to each column in a clustered column chart?
To add data labels, click on one of the columns in the chart, then right-click and select "Add Data Labels." This will add the values directly onto each column, making it easier to see the exact figures.
Can I use a secondary axis for some data series in a clustered column chart?
Yes, you can add a secondary axis. This is useful if you have data series with different scales. To add a secondary axis, select the data series you want to change, right-click, choose "Format Data Series," and then select "Secondary Axis" in the format pane.
Why is starting the y-axis from zero important in a clustered column chart?
Starting the y-axis from zero is important because it accurately represents the relative size of the data values. Cutting the y-axis can distort the visual interpretation of the data, making differences appear more significant than they are.
How can I avoid cluttering my clustered column chart if I have many data series?
To avoid clutter, try to limit the number of data series and clusters. If you have too many, consider breaking your data into multiple charts or using filters to display specific data series at a time.

