
Course
Introduction to Excel
4 hr
237.2K
In this guide, I will explain what Excel gridlines are, how to show or hide them when needed, how they differ from cell borders, and how they behave when a worksheet is printed.
If you are getting started in Excel, our Introduction to Excel course covers skills like navigating the interface, understanding data formats, and working with basic functions. Also, you can take our Advanced Excel Functions course if you have some experience to learn more about how functions improve efficiency in data analysis.
Gridlines, as you might guess, are the faint lines that appear between rows and columns in an Excel worksheet. People like them because they help you more easily read data, follow values across rows, and align info without adding any other kinds of formatting.
It’s important to note that gridlines are part of Excel’s default display, not cell formatting. They don’t represent borders, don’t affect the data itself, and can be shown or hidden without changing how the worksheet is structured.
You can control gridline visibility through Excel’s view settings. This allows you to adjust how a worksheet looks on screen without altering cell content or formatting.
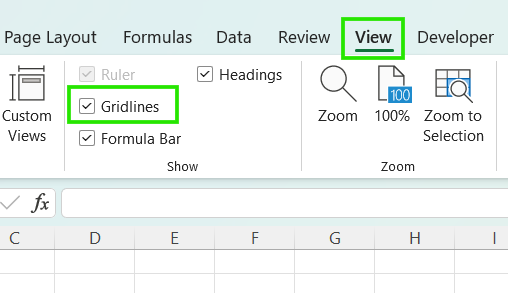
You can toggle gridlines on or off using the ribbon in the steps below:
You should note that this setting applies only to the currently active worksheet. Turning gridlines off in one sheet does not affect others in the same workbook.
The steps for showing or hiding gridlines are the same across platforms, with the following interface differences:
When you group multiple worksheets, changes to gridline visibility apply to all grouped sheets at the same time. This can be useful when you want consistent display settings across several worksheets.
If gridlines appear to turn off unexpectedly in multiple sheets, check whether the worksheets are still grouped. When this happens, ungroup the sheets to restore independent control over gridline settings.
If gridlines seem to be missing, it’s usually due to a display or formatting choice rather than a problem with the worksheet itself. The following are some of the possible causes for this issue:
In Excel, “removing” gridlines simply means hiding them from view; it does not affect your data or cell structure.
To hide gridlines in the active worksheet:
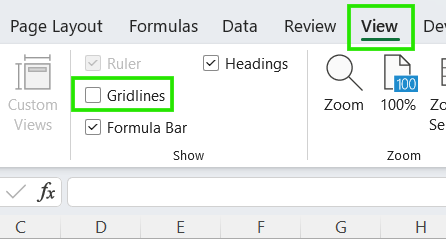
Gridlines will immediately disappear from the current worksheet, but remember that this change applies only to that sheet and does not affect other worksheets in the workbook.
Although gridlines and borders can look similar, they serve different purposes and behave differently.
The table below summarizes the difference between gridlines and cell borders in Excel.
|
Feature |
Gridlines |
Cell Borders |
|
Purpose |
General navigation and alignment |
Emphasizing specific data and sections |
|
Scope |
Applies to the entire worksheet |
Applied to only specific cells. |
|
Printing |
Hidden by default (must be enabled) |
Always visible when printing |
|
Customization |
Global color change only |
Highly customizable (thickness, style, color) |
Borders are a better choice when you need more control over layout and emphasis.
Use borders when
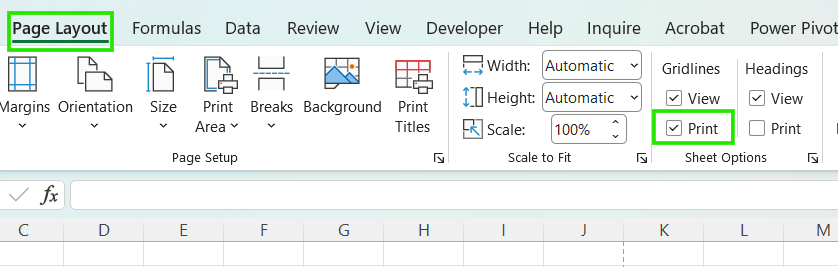
By default, Excel does not print gridlines, even if they’re visible on screen.
To print gridlines:
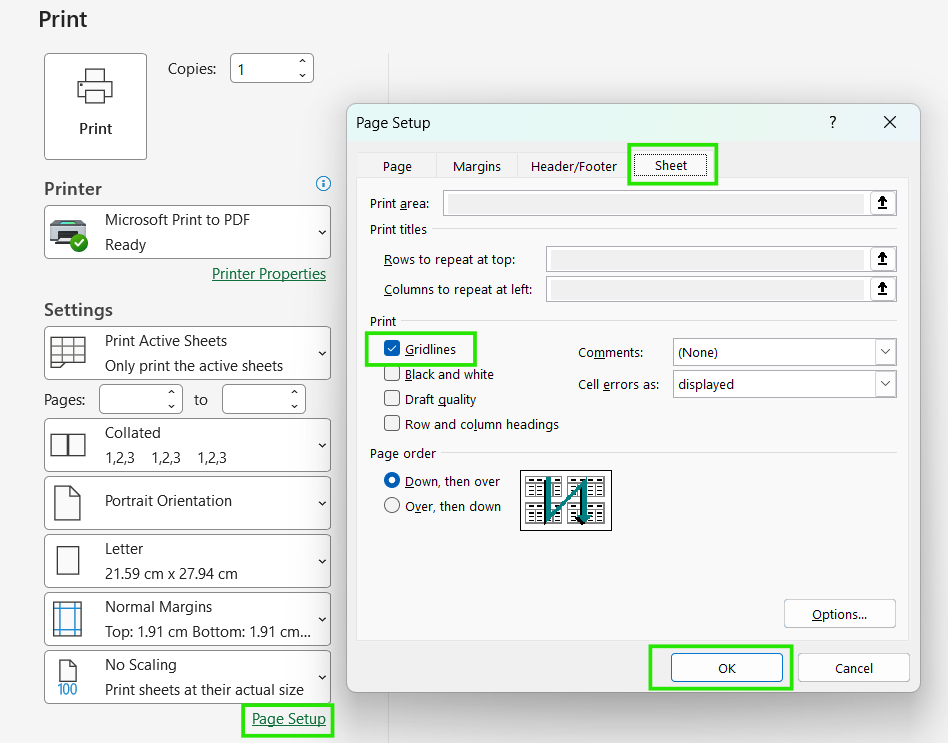
You can also enable gridlines to print in the Page Setup dialog, under the Sheets tab.
If gridlines still don’t appear on printouts, it could be due to the following reasons:
Excel allows you to change the color of your gridlines. This is particularly useful if you need to improve on-screen visibility.
Use the steps below to change the gridline color at the application level:
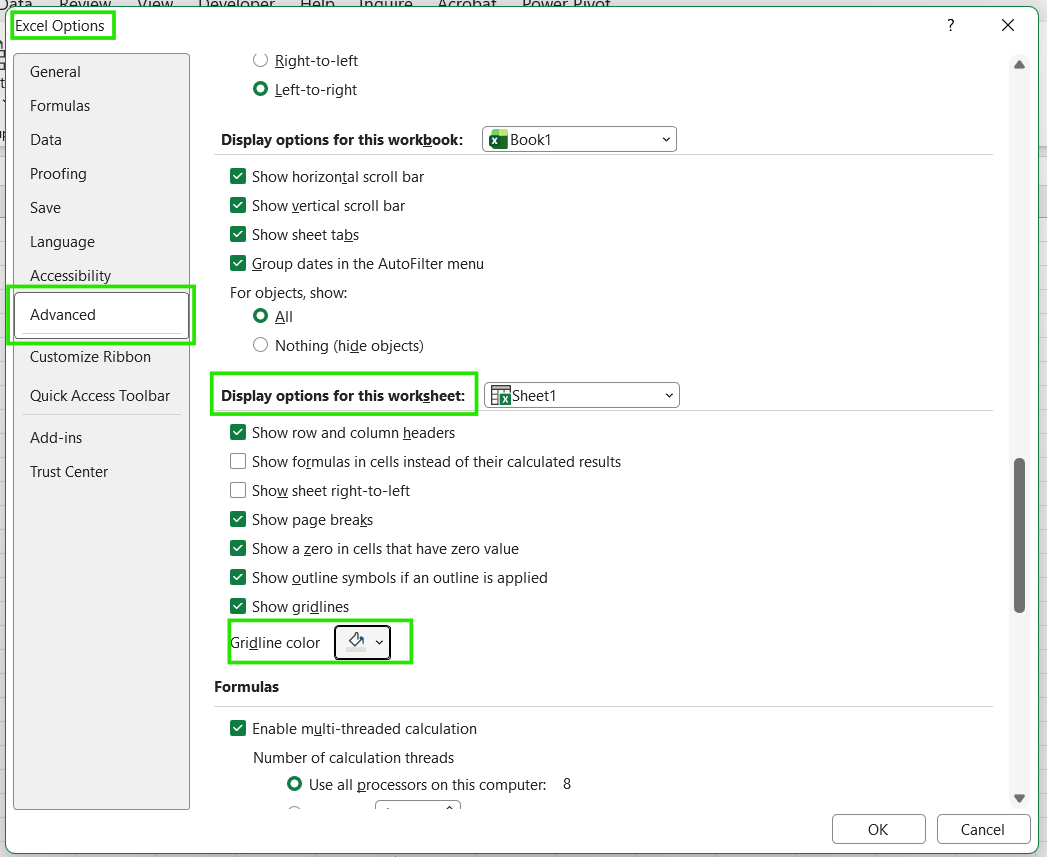
Always remember that just like visibility, color changes only apply to the current worksheet. If you want a "theme" across your workbook, you’ll need to repeat this for each sheet.
Also, remember that custom colors are great for high-contrast needs, but bright colors can quickly become unnecessary due to their visual strain.
To keep your workbook functional and professional, follow these guidelines:
Gridlines serve as a visual aid in Excel, different from formatting like borders, helping you navigate cells without altering your data's structure. Understanding how they behave, especially across worksheets, views, and print settings, helps avoid common points of confusion when a spreadsheet doesn’t look the way you expect.
To advance your Excel skills, I recommend taking our Data Analysis in Excel course. This course will help you master advanced analytics and propel your career. I also recommend taking our Intermediate Power Query in Excel course to learn about data transformation and using the M language for creating dynamic functions.
Learn Excel with DataCamp
Course
Course
Course
Tutorial
Derrick Mwiti
Tutorial
Laiba Siddiqui
Tutorial
Laiba Siddiqui
Tutorial
Oluseye Jeremiah
Tutorial
Javier Canales Luna
Tutorial
Laiba Siddiqui