
Course
Data Preparation in Excel
3 hr
85.3K
If you often find yourself working with probabilities and statistics in Excel, chances are you’ll encounter the NORM.DIST() function sooner or later. This essential tool is a staple for anyone analyzing normal distributions—whether you’re running quality control, assessing test scores, or digging into business data. With NORM.DIST(), you can easily determine the probability associated with a specific value within a normal distribution.
In this guide, we’ll start by understanding what NORM.DIST() actually does, then break down its syntax, clarify important options, and walk through practical examples. By the end, you’ll know exactly how to use this function and where it fits in your Excel toolkit.
Before we dive into the details of how to use NORM.DIST(), let’s clarify its purpose. NORM.DIST() calculates the probability that a value drawn from a normal distribution is less than or equal to a specified number. Depending on your needs, you can use it to obtain either the probability density (the height of the curve at a specific point) or the cumulative probability up to that value.
So, whether you want to find out how likely it is to score below a certain number, or simply need the value of the normal curve at a point, this function has you covered. Next, let’s see what goes into the function and how you can set it up in your spreadsheet.
Now that you have a sense of what NORM.DIST() does, let’s look at how to use it in Excel. Here’s the function’s syntax:
=NORM.DIST(x, mean, standard_dev, cumulative)Breaking down each argument:
x: The value for which you want the distribution.
mean: The mean (average) of the distribution.
standard_dev: The standard deviation of the distribution.
cumulative: A logical value—use TRUE if you want the cumulative distribution function (CDF), or FALSE if you want the probability density function (PDF).
To put this into context, imagine you want to find the probability that a value is less than or equal to 80 in a normal distribution with a mean of 70 and a standard deviation of 10. The formula would look like this:
=NORM.DIST(80, 70, 10, TRUE)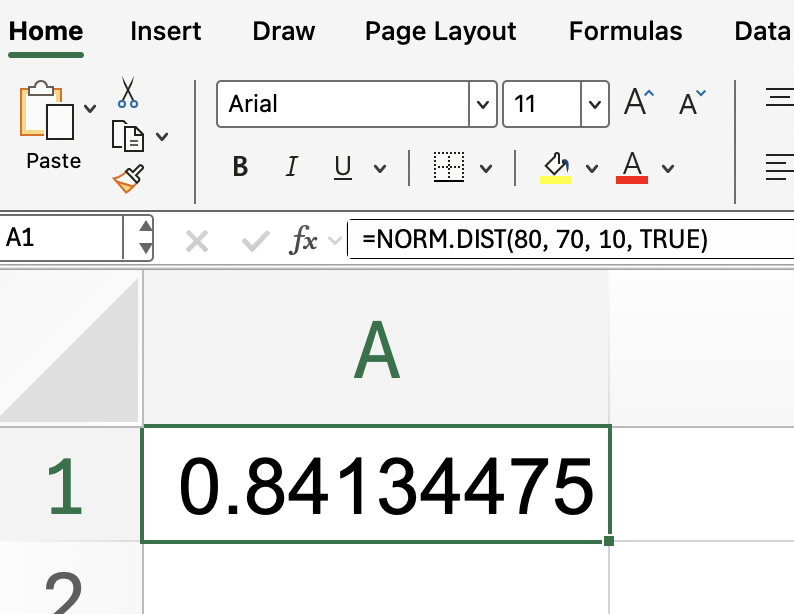
This setup returns the cumulative probability up to 80.
Now that you know how to set up the function, you might be wondering about the two main options for the final argument: cumulative and probability density. Understanding the distinction is key to getting the results you want.
Cumulative (TRUE): When you set the last argument to TRUE, NORM.DIST() returns the probability that a value is less than or equal to x. This is the most common option for statistical analysis, as it answers questions like “What percentage of students scored 85 or lower?”
Probability density (FALSE): When you choose FALSE, the function gives you the height of the normal curve at x. This isn’t a probability, but rather the value of the curve at that point—useful mainly in statistical modeling or probability theory.
Knowing when to use each option will help you interpret the function’s output correctly. Next, let’s see both options in action with practical examples.
To cement these ideas, let’s work through two practical scenarios—one using the cumulative probability and the other using the probability density.
Recall our earlier example. It doesn’t hurt to practice again. Suppose you want to know the probability that something like a test score is less than or equal to 85, assuming test scores are normally distributed with a mean of 75 and a standard deviation of 8:
=NORM.DIST(85, 75, 8, TRUE)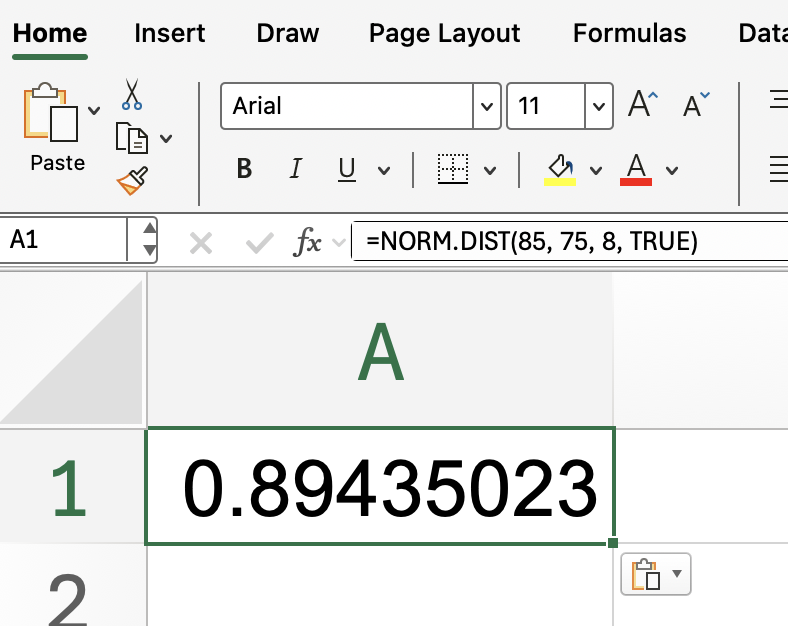
Excel will return a value close to 0.894, meaning that about 89.4% of students scored 85 or lower. This is a straightforward way to gauge how common a certain score is within your data.
But what if you’re interested in the height of the curve at a specific value, rather than the cumulative probability? In that case, set cumulative to FALSE:
=NORM.DIST(85, 75, 8, FALSE)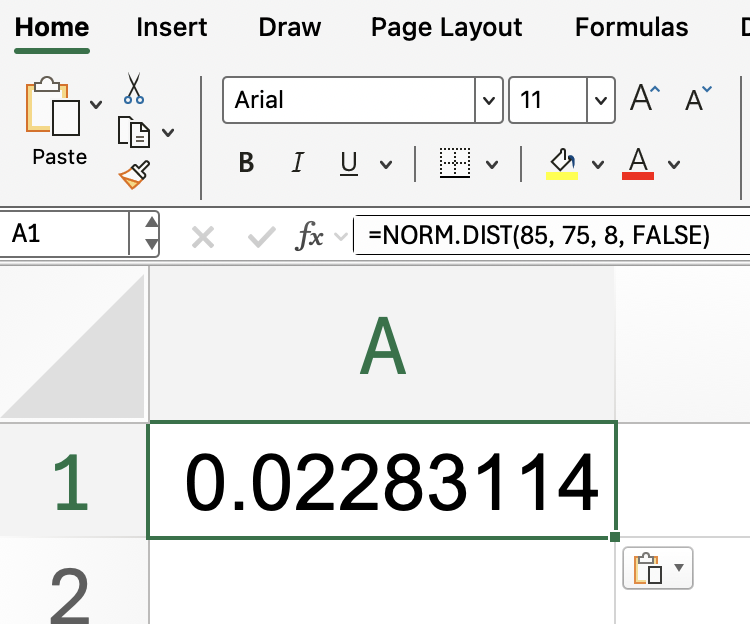
This gives you the probability density at 85. Remember, this isn’t a probability, but the value of the normal curve at that point.
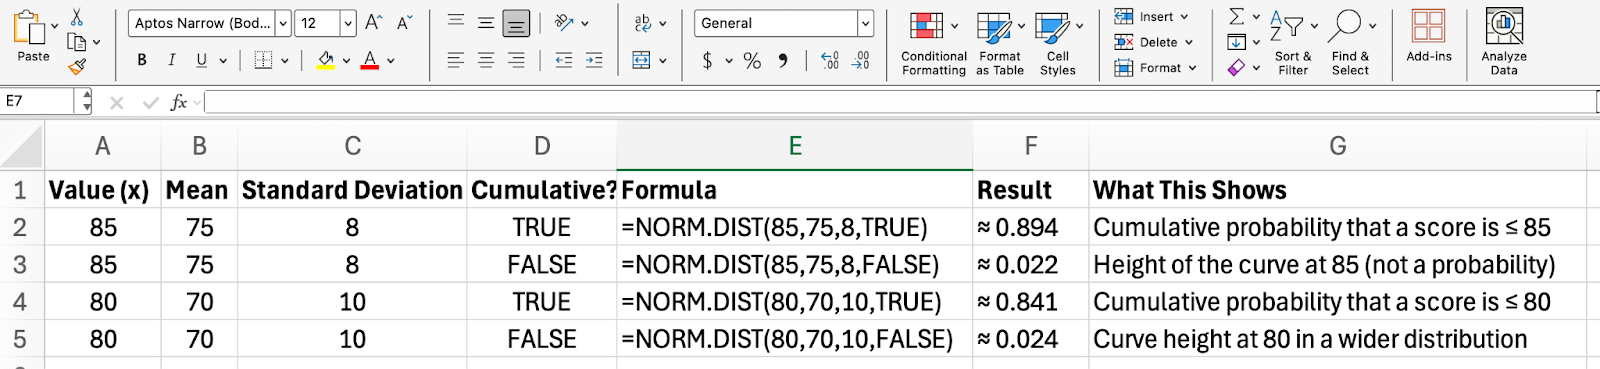
So now, you know that NORM.DIST() can be used either to find the cumulative probability for a given value or to find the height of the curve at that value. Let me show one final table that puts these ideas together.
This table below illustrates how NORM.DIST() behaves when you switch between cumulative and probability density modes. You’ll see how the inputs affect the output, and what each result actually tells you.
As you start applying NORM.DIST() to real data, it helps to be aware of a few common pitfalls:
Standard deviation must be positive. Entering zero or a negative number for standard deviation will result in an error.
Mean and standard deviation flexibility. While the mean can be any real number, the standard deviation must always be positive—never zero or negative.
Going in reverse? If you need to find the value corresponding to a given probability (rather than the probability for a given value), use NORM.INV() instead.
By keeping these tips in mind, you’ll avoid the most frequent errors and make your calculations smoother. Up next, let’s visualize how NORM.DIST() works on a bell curve for a more intuitive grasp.
Now that you’ve seen the formulas in action, it’s helpful to visualize what’s happening under the hood. Take a look at this illustration:
Enter a table directly into your Excel worksheet. In a new sheet or below the table, create thee columns:
One labeled x. In my example, I made the values 60 to 90 in steps of 1.
One for the Cumulative values: =NORM.DIST(x_cell,75,8,TRUE)
One for the Probability Density values: =NORM.DIST(x_cell,75,8,FALSE)
Next, create the chart:
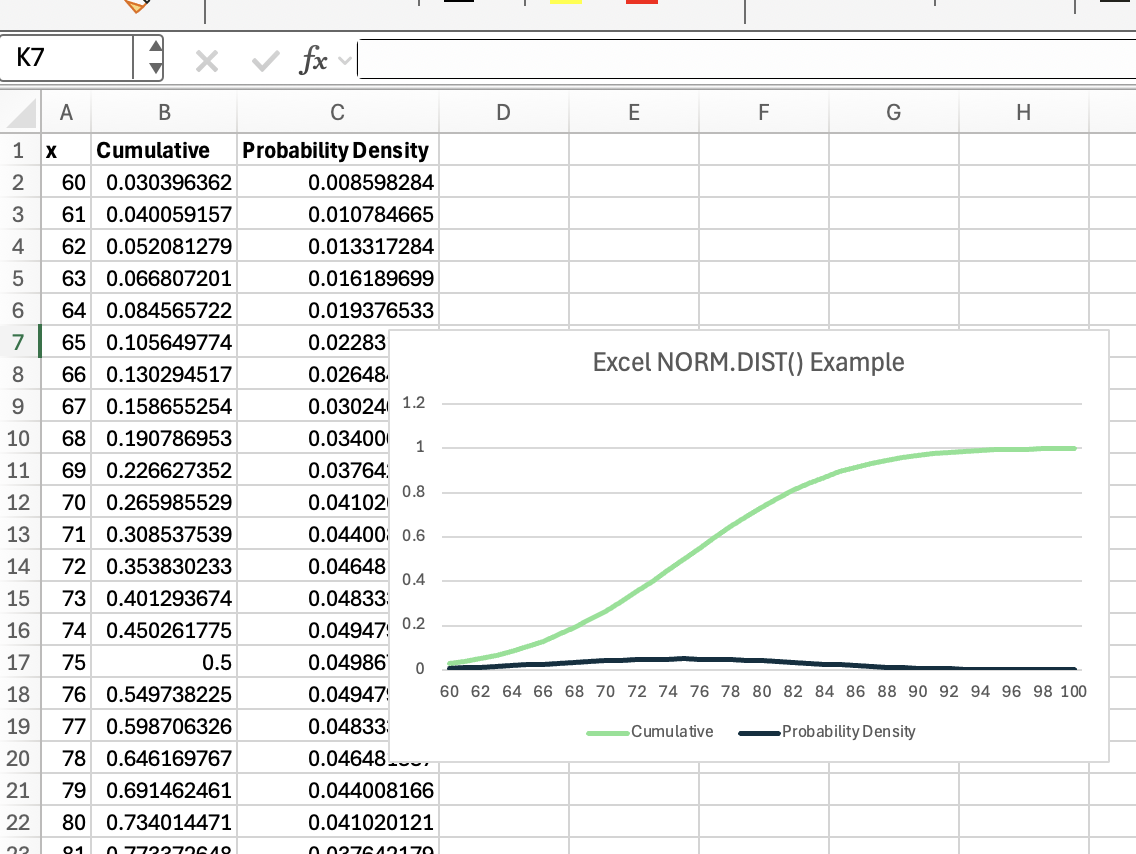
In this bell curve, the shaded area under the curve up to x represents the cumulative probability you get when using cumulative = TRUE. Meanwhile, the height of the curve at x shows the probability density you receive when cumulative = FALSE.
We’ve practiced NORM.DIST(), but you might find yourself needing related tools:
NORM.INV(): Returns the value for a given cumulative probability (the inverse of NORM.DIST()).
NORM.S.DIST(): Calculates probabilities using the standard normal distribution (mean 0, standard deviation 1).
NORM.S.INV(): Returns the value for a given probability in the standard normal distribution.
These functions are especially handy when working with standardized data or when you need to move between probabilities and values. If you’re tackling more complex statistical tasks, consider exploring these related options.
You’ve now seen how NORM.DIST() fits into any data analysis involving the normal distribution. Whether you’re calculating the likelihood that a value falls below a certain threshold or analyzing the distribution’s shape, this function makes your work more precise.
As a next step, take our Data Analysis in Excel course to keep leveling up your skills.
Learn Excel with DataCamp
Course
Course
Course
blog
Josef Waples
10 min
Tutorial
Vidhi Chugh
Tutorial
Arunn Thevapalan
Tutorial
Arunn Thevapalan
Tutorial
Josef Waples
Tutorial
Vinod Chugani