
Track
Excel Fundamentals
16 hr
When designing a model in a spreadsheet, we may be interested in knowing how a result might change by changing the value of one of the variables involved. This process can be performed in Excel by running a sensitivity analysis
Knowing how to conduct a sensitivity analysis is crucial if you’re a data practitioner working in financial modeling or decision processes.
In this article, we will explore sensitivity analysis in depth. We will cover the basics of this useful technique within the “what-if” analysis family and how to conduct and interpret the results of basic and advanced sensitivity analysis in Excel. Finally, we will discuss the role of AI and machine learning in advancing more powerful sensitivity analysis, as well as best practices and common pitfalls.
If you’re eager to get some hands-on experience, check out our Financial Analysis in Excel course, which covers what-if analysis in detail.
The most common approach in sensitivity analysis is to examine how changes in one variable at a time affect the final result while keeping all other factors constant. This is repeated for all variables under consideration. It helps identify the most influential drivers in a model, enabling businesses to focus on key factors that affect their performance.
Sensitivity analysis helps businesses prioritize key risks and opportunities by identifying which factors have the greatest impact on performance. Given its nature, sensitivity analysis is common in finance, business, and project management, for example, to calculate how interest rates may change over time or to understand different growth trends.
Further, sensitivity is often combined with scenario analysis, which typically analyzes the combination of variables at the same time. These two what-if analyses study how a dependent variable will react to certain inputs. However, scenario analysis is specific to a certain "scenario", while sensitivity analysis is more open-ended because it gives a range of inputs and values.
The goal of sensitivity analysis is to understand how the dependent variable reacts to a range of input values, known as independent variables.
By incorporating this technique into decision-making, organizations can proactively adjust strategies and enhance resilience against uncertainty.
For a more detailed explanation of the theory behind sensitivity analysis, we highly recommend our Advanced Probability: Uncertainty in Data course.
Often, sensitivity analysis is presented in a sensitivity table with conditional formatting that highlights the values from highest to lowest.
Below is an example of the price sensitivity of supply and demand. Supply and demand are the independent variables labeled on the axes, and the price is the dependent variable, which holds the values in the table.
We will work with similar Excel sensitivity tables in the next sections.
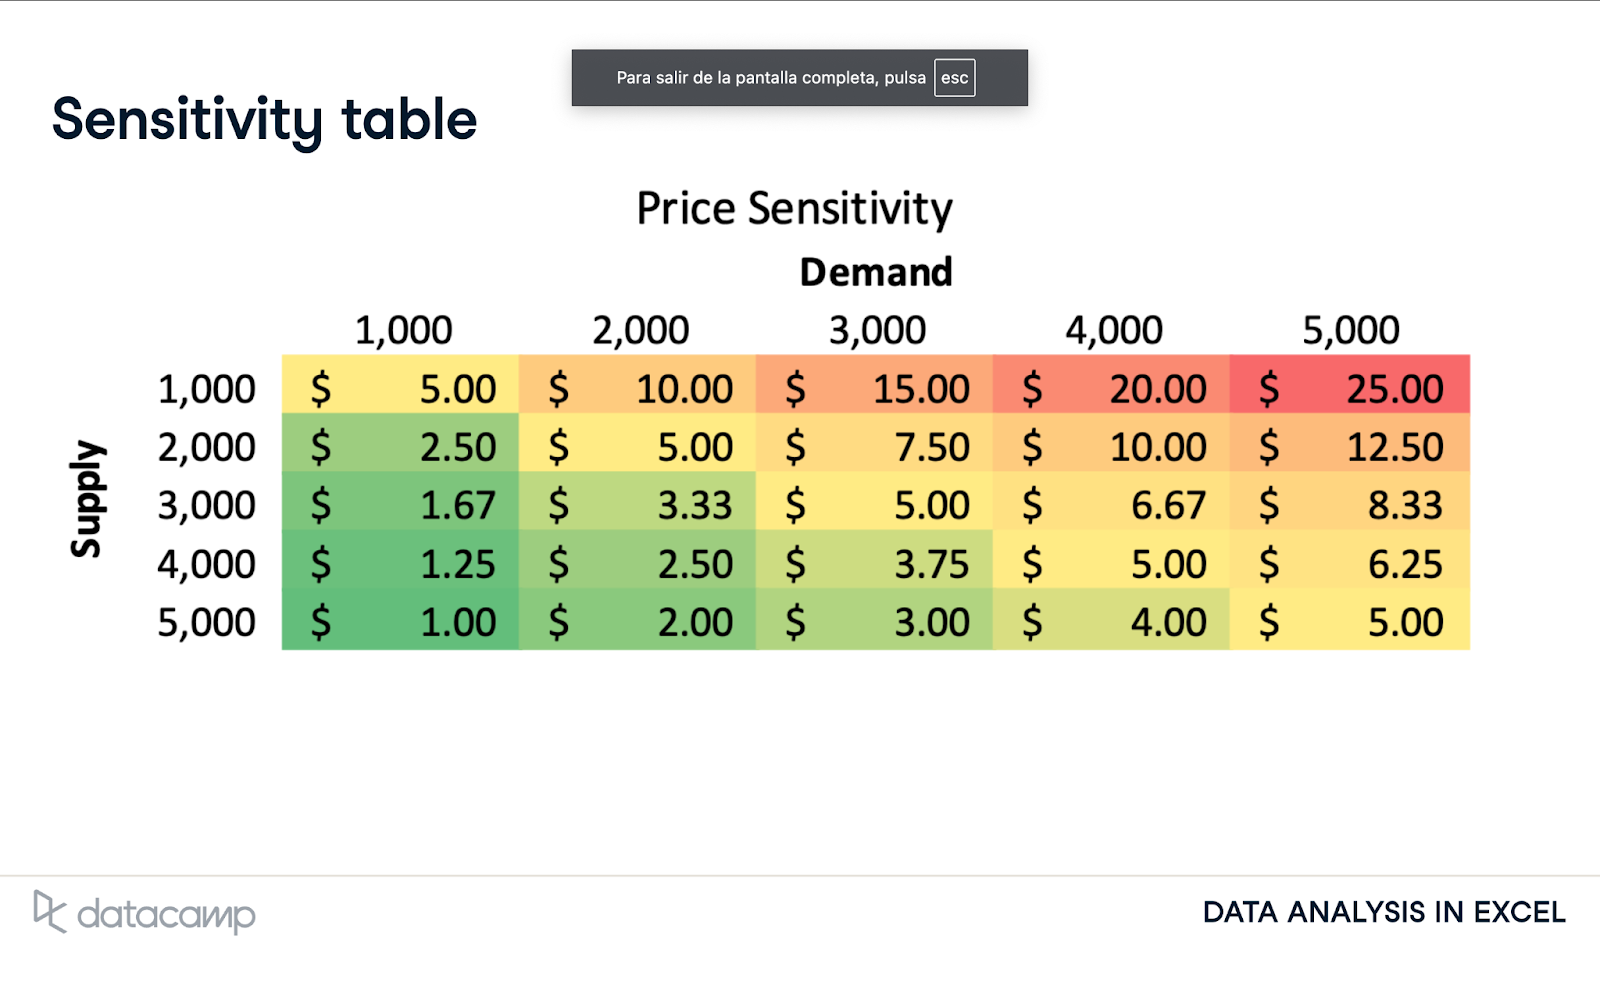
Sensitivity table. Source: DataCamp
Let’s see how to perform a sensitivity analysis in Excel, following each step of the process.
Excel is a handy tool for creating mathematical models, including what-if analysis. What-if analysis is essentially creating formulas that allow questions to be explored, like a sensitivity analysis.
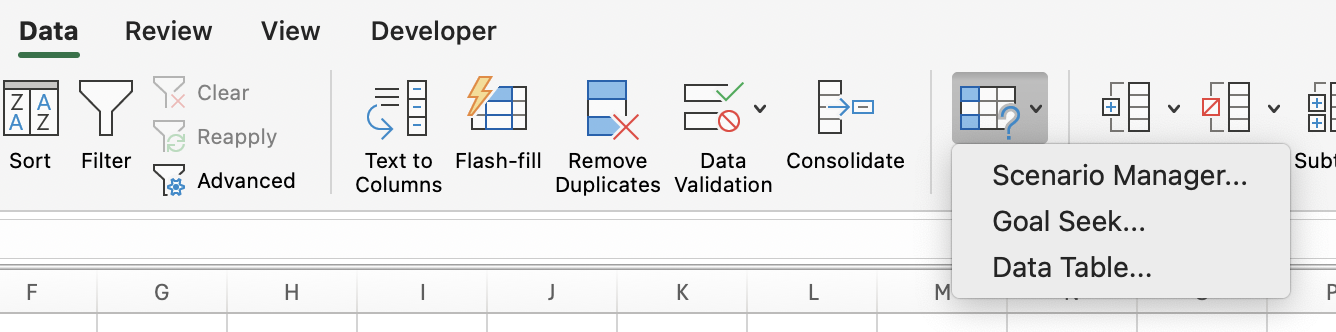
Most recent versions of Excel come with a Data Tab, which provides a myriad of tools and possibilities for working with data. This includes a What-if Analysis button in the ribbon. It includes three tools. The Data Table button is specifically designed to create sensitivity tables.
To perform scenario analysis, just click on the Scenario Manager button.
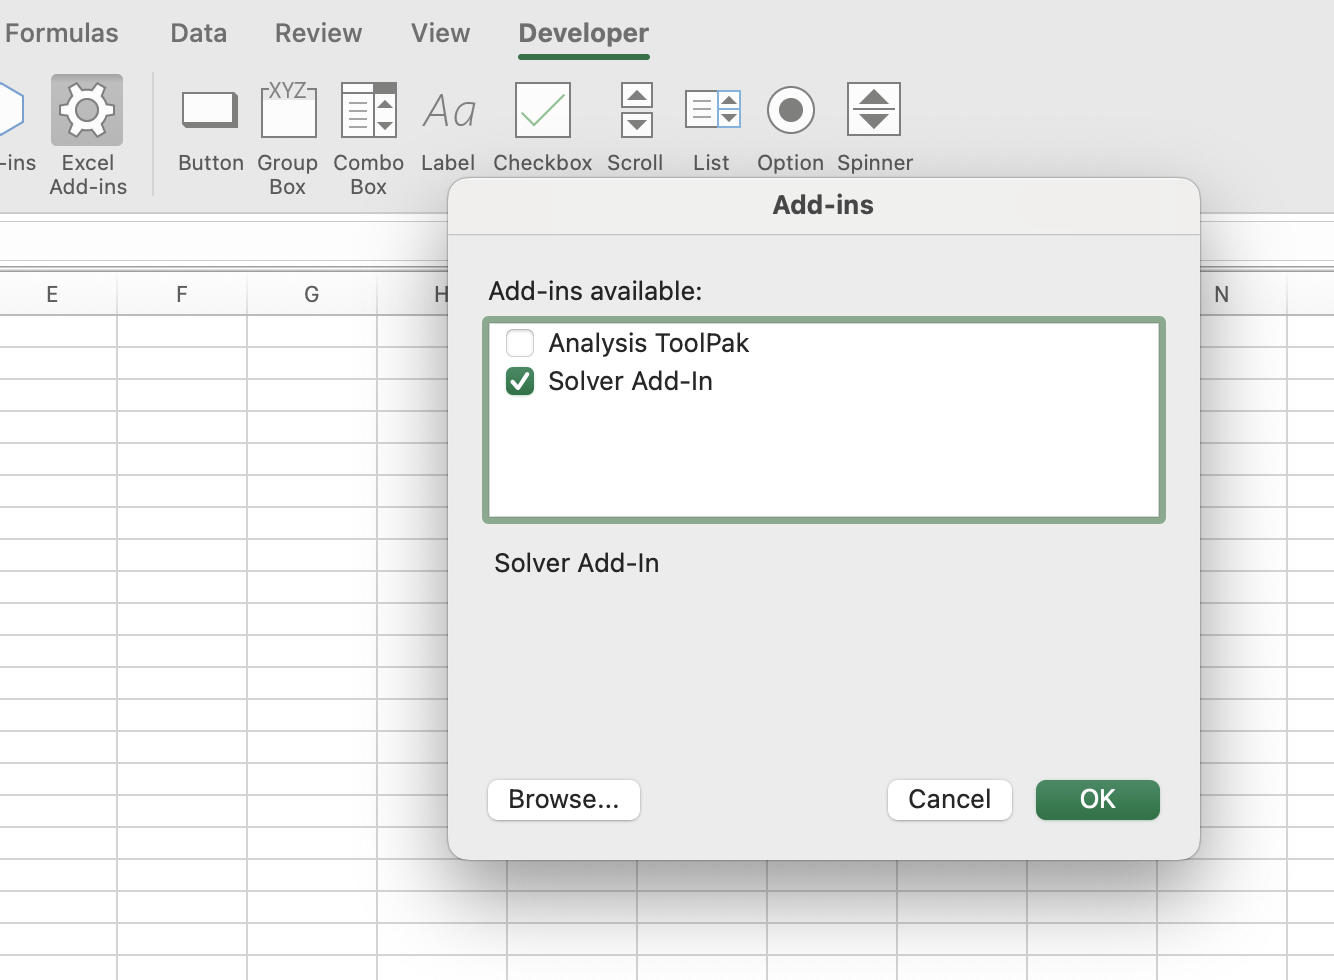
We will also use Solver, an add-in that you can activate from the Developer Tab.
Solver is used in what-if analyses to find an optimal (maximum or minimum) value for a formula in one cell —called the objective cell– subject to constraints, or limits, on the values of other formula cells on a worksheet.
Before enabling Solver, you must access the Developer Tab, which is not displayed by default. To display this tab:
Now that we have our tools ready, let’s start by creating a simple, single-variable sensitivity analysis in Excel.
The initial step to performing a sensitivity analysis in Excel is identifying the inputs and outputs on which your model will be based.
For this tutorial, we will use sensitivity analysis to study how the net profit of a guitar-selling company will vary if we change the value of certain input variables, like the number of guitars sold, the price of the guitar, or the production costs.
Below, you can find the tables with the input and output variables.
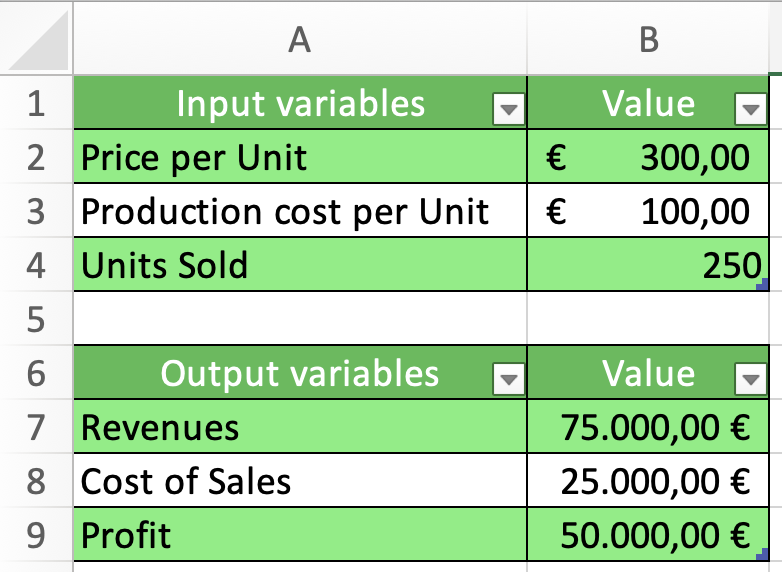
When using data tables for sensitivity analysis, it’s important to link output cells to input variables so Excel can understand the relationship between the model variables. This process is done through formulas. In our example:
You may want to know how profit changes if we increase or decrease the price per unit, keeping the production cost and number of units sold unchanged. When we analyze how an output variable changes when we modify the value of an input variable, we need a so-called one-way data table.
The following GIF shows how to create a one-way data table in Excel. As you can see, the table automatically recalculates the profit for each unit sold. Naturally, the profit when we sold 250 units is the same as in the original parameters (i.e., 50.000 €).

You may also want to study how different output variables change when we modify the unit sales. This is also fairly easy, as shown below. In the following GIF, we calculate how unit sales affect both profits and cost of sales.
Instead of analyzing how an output is affected by one input, you could also create a two-variable table to analyze the impact of two input variables. Say you want to know how profit changes if we modify guitar sales and the price per guitar.
First, you need to create a two-dimensional table with the ranges of price per unit in the rows and the unit sales in the columns. Then, in the upper left corner of the table, choose the variable you want to study. Finally, choose the cell reference of the independent variables in the input variable table (i.e., price per unit and units sold).
As you can see, once you create the table, you can easily change the output variable in the upper left corner to another variable, and Excel will recalculate all the values
Now that you have your data tables, the final step is to interpret the results to generate insights on how changes in inputs impact the outputs.
Given this sensitivity analysis, we can make an informed decision about profit. Here are some insights:
The interpretation of the analysis will depend on the particular needs of your company. Posing questions like how many guitars you can produce, what is the minimum level of profits you need to keep your company sound, and what’s in your hands to reduce the production cost of the guitar will be crucial to extracting meaningful insights from the sensitivity analysis.
When you perform a sensitivity analysis, you’re returning a range of potential outputs based on changes in the input variables of a model. However, you may want to know more details about the inner workings of your model.
Fortunately, Excel comes with a powerful tool called Solver, which can help you in this task. As mentioned, Solver is used in what-if analyses to find an optimal (maximum or minimum) value for a formula subject to constraints, or limits, on the values of other formula cells on a worksheet.
This may sound like the aim of Goal Seek, another type of What-If analysis that focuses on adjusting a single variable to meet a desired result. However, Solver is much more than Goal Seek.
First, Solver allows you to calculate an optimal result based on more than one variable and allows you to include constraints in the models.
What’s more, Solver also comes with an optional sensitivity feature that gives you insight into how the optimal solution changes when you change the coefficients of the model.
To illustrate the power of Solver, let’s go back to our guitar company. Imagine the company manufactures two guitar models (model A and B), each of which requires a certain combination of mahogany and cedar. Each model has a different price.
The company wants to know how many units of each model to produce to maximize its profits, given its current availability of mahogany and cedar.
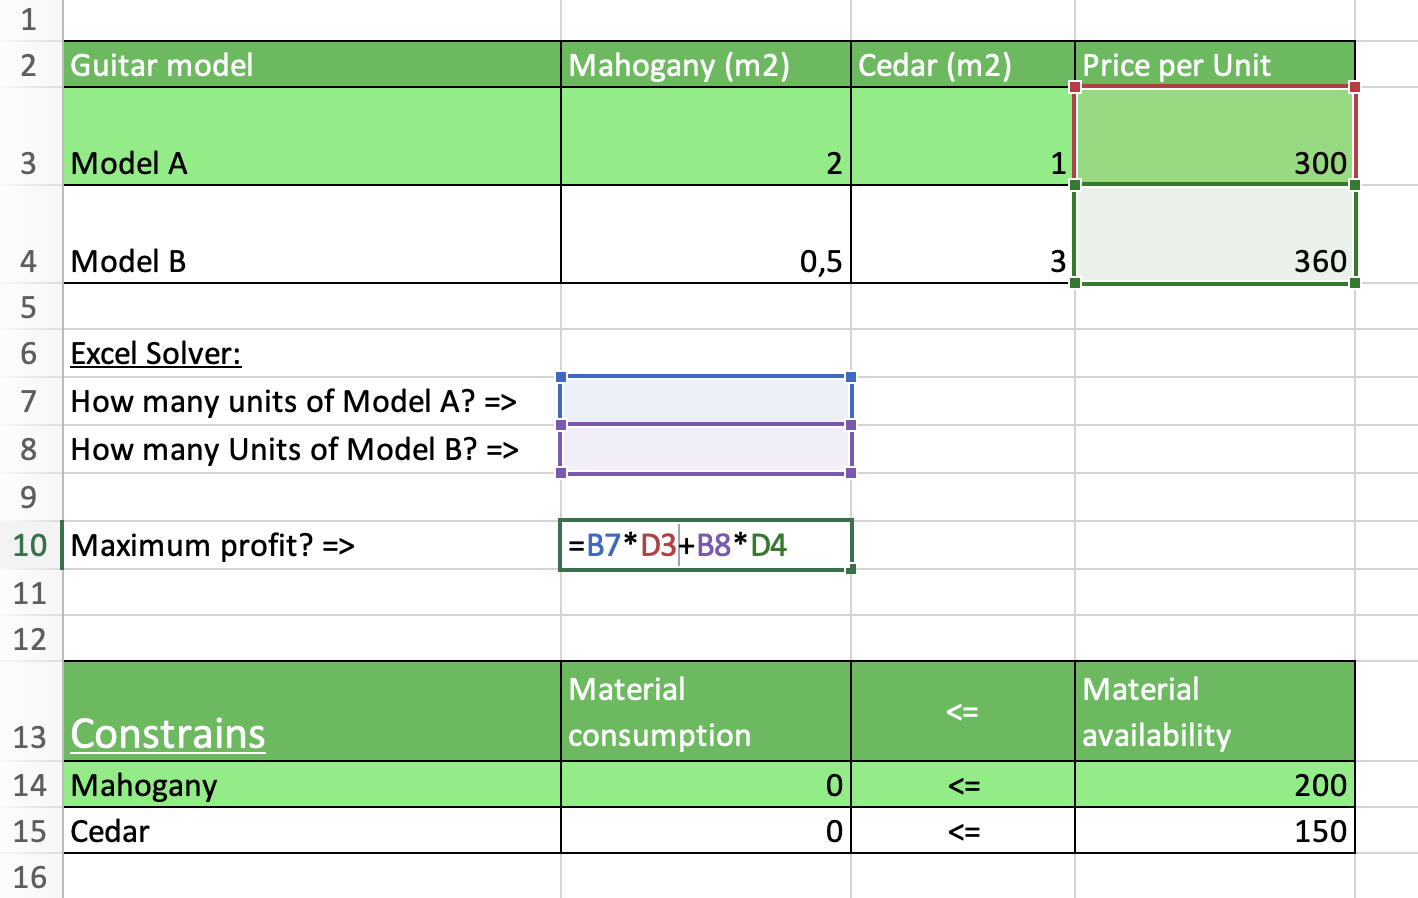
There are three things we want Solver to calculate: Profit, units of Model A, and units of Model B. The image above shows the inputs, formulas, and constraints the model will be based on.
In the following GIF, we show how to use Solver to find the optimal values of units to maximize benefits, using wood availability constraints and making sure units are full numbers. There are several strategies Solver can use to optimize the model, both for linear and nonlinear problems. In our case, we will use Simple LP.
Once we add all the parameter values, Solver estimates that the 48 units of model A and 9 of model B are the best combination to maximize profit (17,591€). We can click on Sensitivity before closing the Solver box, and Excel will create a new sheet with a Sensitivity report.
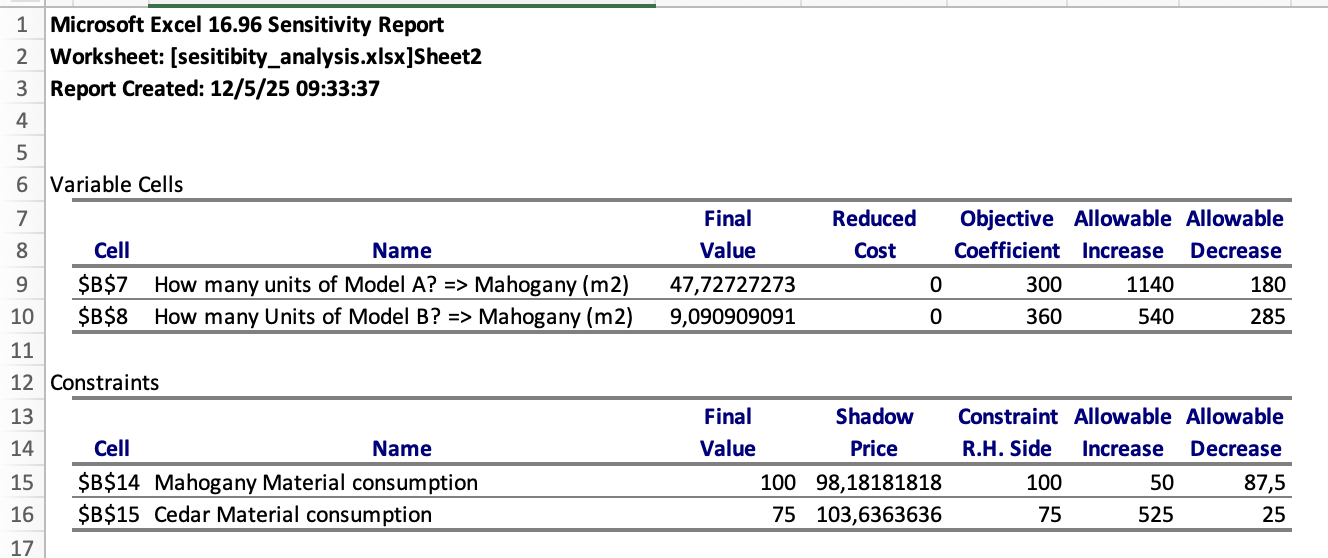
The sensitivity provides us with valuable insights to estimate how profits would vary if we change the input variables. The Shadow Price indicates how much profit would increase if you had one additional unit of a constrained resource. In this example, each additional square meter of mahogany increases profit by €98, while cedar increases profit by €103, highlighting cedar's greater potential return on investment
Another important element in the sensitivity report is the ranges within which you could keep the prices of the models to keep the results of the model unchanged.
Profit is calculated by multiplying the units of each model by its price, which is given in the Final Value and Objective Coefficient columns. The ranges are given in the columns Allowable Increase and Allowable Decrease.
For example, Solver would find the same number of units to manufacture if you increase the value of Model A by 1140€ or decrease it by 180€.
If you create one-way and two-way sensitivity tables, formatting the results can be a game-changer to rapidly spot relevant information and enhance decision-making. Conditional formatting is key to creating important thresholds and compelling heatmaps.
Let’s go back to our two-way table. Instead of showing the table in white cells, we can use conditional formatting to create a multicolor heatmap of a two-color scale, establishing a custom threshold, as shown in the GIF.
Let’s briefly cover how AI and machine learning can help to improve your sensitivity analysis.
So far, we have seen how to manually perform a sensitivity analysis. However, as the complexity of your models increases, conducting and interpreting the results of the sensitivity analysis can become time-consuming.
Here is where AI enters the scene. With AI and machine learning, you can let machines do the calculations every time certain conditions are met and insert the results in compelling dashboards.
Once you know the calculations you want to perform, your next step is to clearly define an AI pipeline to streamline and automate the process.
Curious about how to do it? Check out our Machine Learning, Pipelines, Deployment and MLOps Tutorial.
Monte Carlo Simulation is a mathematical technique used to model the probability of different outcomes in a process that cannot easily be predicted due to the intervention of random variables.
The problem is first modeled by a probability distribution for each variable that has inherent uncertainty. Large numbers of random samples are then drawn from these probability distributions, and these samples are used to compute the outcomes.
This process is repeated many times to create a distribution of possible outcomes, which can be analyzed statistically to provide predictions about how a system will behave. Monte Carlo helps analyze uncertainty more comprehensively than traditional sensitivity tables.
You can learn everything about this powerful technique in our Monte Carlo Simulation in Excel Guide.
Given the nature of the Monte Carlo simulation, you could use it to supercharge your sensitivity analysis to find which variables have the most significant impact on the output.
In our guitar example, we can hold the cost price and units sold constant and change the unit price to understand the changes in the estimates. Then, repeat the same process for the remaining two variables one by one. Eventually, this technique helps in understanding which variable to focus efforts on to improve accuracy.
While Excel makes sensitivity analysis extremely easy and accessible, there are still some common pitfalls to keep in mind. Here are a few things to consider.
As you have seen in this tutorial, for sensitivity analysis to work, Excel must know the relationships between input and output variables. This requires you to use formulas wisely, providing clearly defined cell references and ranges.
If you want to add new values to the data tables, a good practice to avoid potential problems during recalculation is to use Excel Tables, as they are inherently dynamic, meaning that they auto-expand when new rows or columns are added.
This will help you make the right formula recalculations to keep the information in the right format.
Even if your sensitivity analyses are clearly defined, you need to verify your results carefully. Manual testing and charts are great options to visualize your results and check for outliers or anomalies in the outputs.
However, it’s important to remember that sensitivity analysis may simply not work for your use case. This analysis is based on a set of simple assumptions, such as the independence of input variables, the existence of linear relationships, and the static nature of input variables.
However, your model may be more complex and may be affected by external factors that sensitivity analysis overlooks by nature. Hence, despite its benefits, it’s important to have a comprehensive understanding of your model beyond sensitivity to ensure correct analysis.
Congratulations on making it to the end of this tutorial. Sensitivity analysis is a powerful what-if analysis that can be a game-changer in your decision-making process. There are only what-if analyses to supersede your financial models, like Goal Seek or Scenario Manager. Fortunately, DataCamp is here to help you. Check out our curated Excel courses and materials:
Top Excel Courses
Track
Course
Course
Tutorial
Avinash Navlani
Tutorial
Laiba Siddiqui
Tutorial
Arunn Thevapalan
Tutorial
Joleen Bothma
Tutorial
Arunn Thevapalan
Tutorial
Laiba Siddiqui