Course
Power BI is a cloud-based business analytics service from Microsoft that enables anyone to visualize and analyze data, with better speed, understanding an efficiency. It is a powerful as well as a flexible tool for connecting with and analyzing a wide variety of data. Apart from the various visualization advantages that Power BI offers, it has an amazing out of the box connection capabilities like easily integrating with Databases. This offers increased advantages regarding functionalities and comes in handy for Data Scientists who are used to working in SQL. Power BI provides an optimized, live connector to SQL Server so that we can easily create charts, reports, and dashboards by directly working with a large amount of data.
Pre-requisites
Since this article will be focused only on SQL with Power BI, we suggest going through the following existing DataCamp courses and tutorial, which serve as an excellent primer:

1. Power BI
Power BI gives the ability to analyze and explore data on-premise as well as in the cloud. Power BI gives the ability to collaborate and share customized dashboards and interactive reports across colleagues and organizations, easily and securely.

Advantages of using Power BI
Power BI provides certain advantages which makes it superior to the existing analytical tools:
- Provides a cloud-based along with a desktop interface.
- Provides capabilities like data warehousing, data discovery and interactive dashboards.
- Ability to load custom visualizations
- Easily scalable across the entire organization.
Due to the immense capabilities of Power BI, Microsoft has been recognized as a Leader in the “Analytics and Business Intelligence Platform”, by Gartner, for 12 consecutive years.
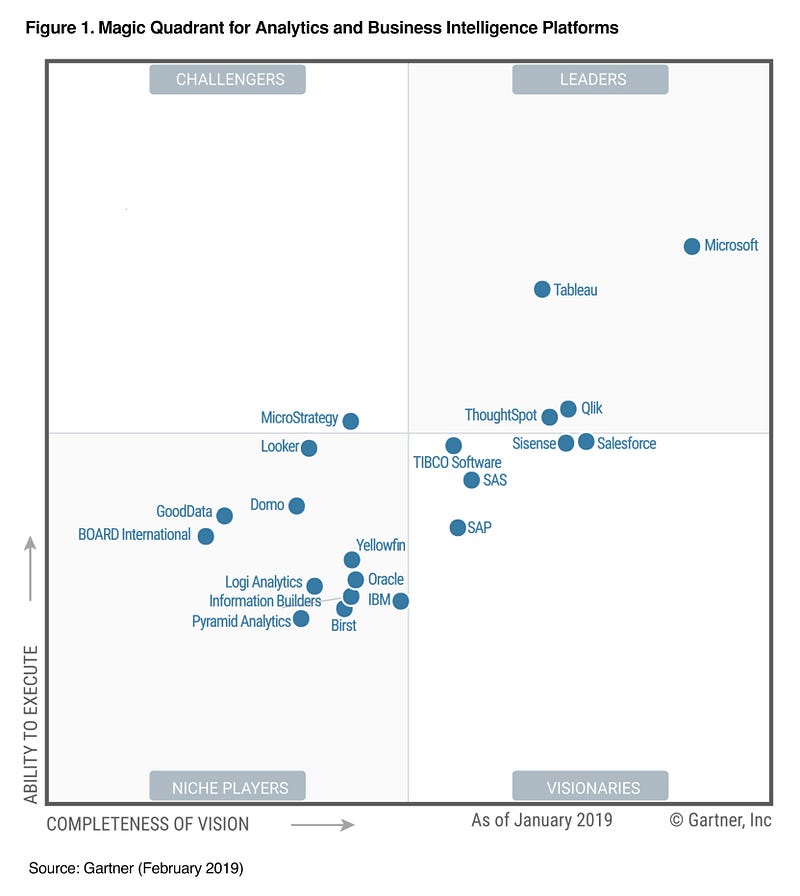
2019 Gartner Magic Quadrant for Analytics and Business Intelligence Platform
Power BI Components
Power BI consists of various components which are available in the market separately and can be used exclusively.
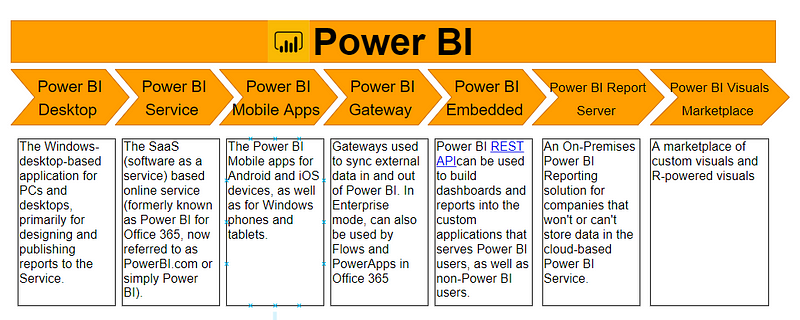
Choosing which component to work with depends mainly on the project or a team. We, however, will be working with Power BI desktop since this is a component primarily used for Business report generation and desktop creation. Also, the other works usually begin with Power BI desktop, where the report creation takes place.
2. Power BI Desktop
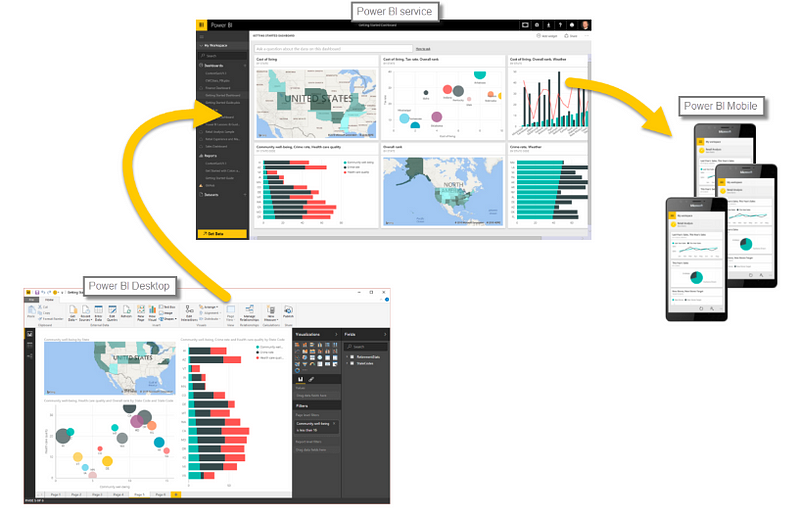
Power BI Desktop is a free application that can be downloaded and installed on the system. It can be connected to multiple data sources. Typically, an analysis work begins in Power BI Desktop where report creation takes place. The report is then published to Power BI service from where it can be shared to the Power BI Mobile apps so that people can view the reports even on mobiles.
Installation
Power BI only runs on Windows Machines. Mac users could spin up a Windows VM in Azure and load Power BI onto that or use Turbo.net, which can stream Power BI to the Mac directly from the cloud.
Power BI can be accessed in two ways:
- We can get it as an app from the Microsoft store and just sign in to get started. This is the online version of the tool.
- Sometimes, we need to work in offline mode with our data. In such situations, download the software locally and then install it. Make sure you read all the installation instructions.
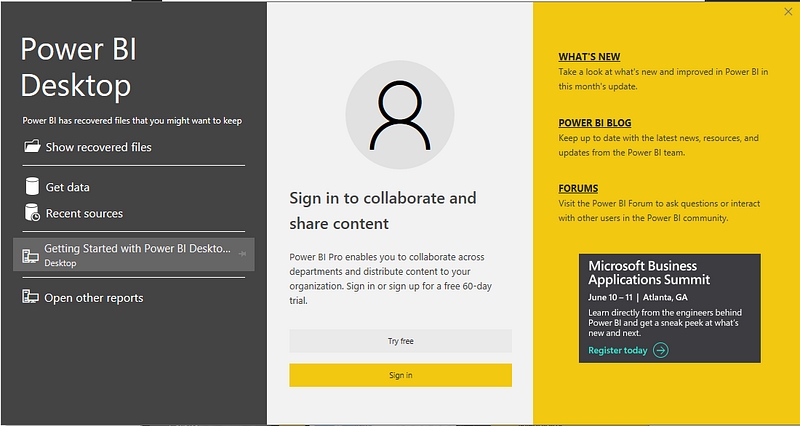
Depending upon the choice of product, download the software on to the computer. After accepting the license agreement, verify the installation by clicking the Power BI Icon/App. If the following screen appears, you are good to go.
3. Getting Started
Let us now get an idea about working of Power BI Desktop. In this section, we shall explore it a bit to get accustomed to its interface.
Workspace
The image below highlights the major components of the workspace of Power BI.
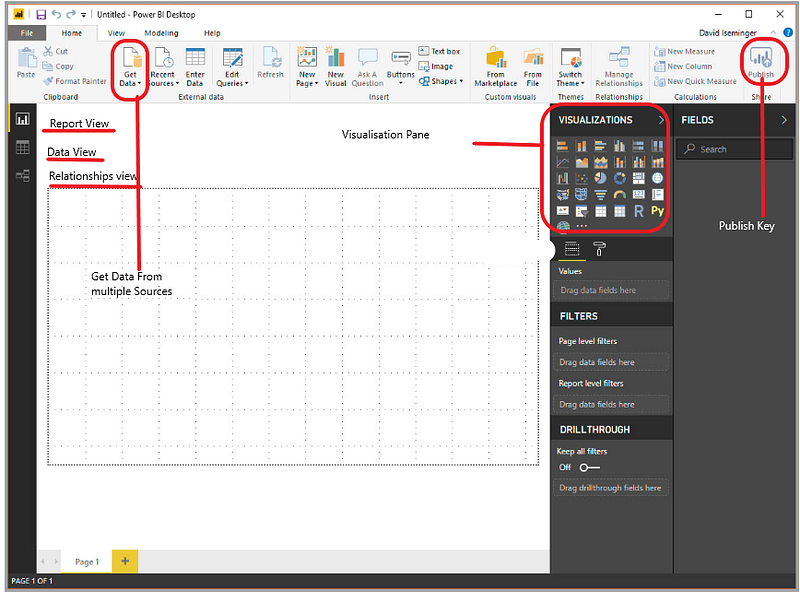
Power BI Desktop workspace
Data Source
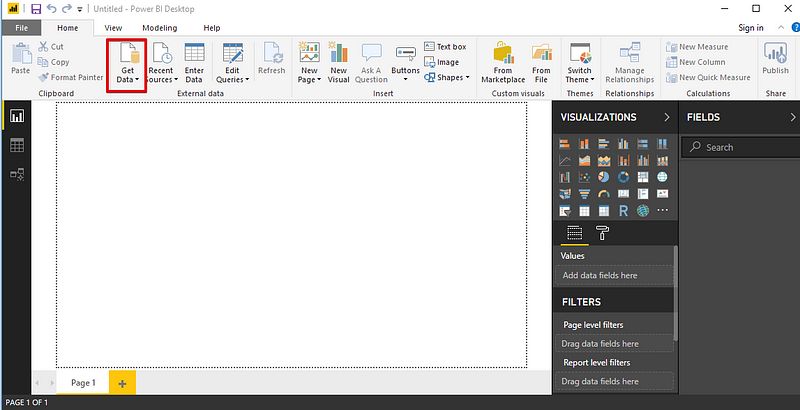
Power BI can be connected to a number of data sources. The Get Data icon displays all the possible available options from where data can be imported into Power BI.
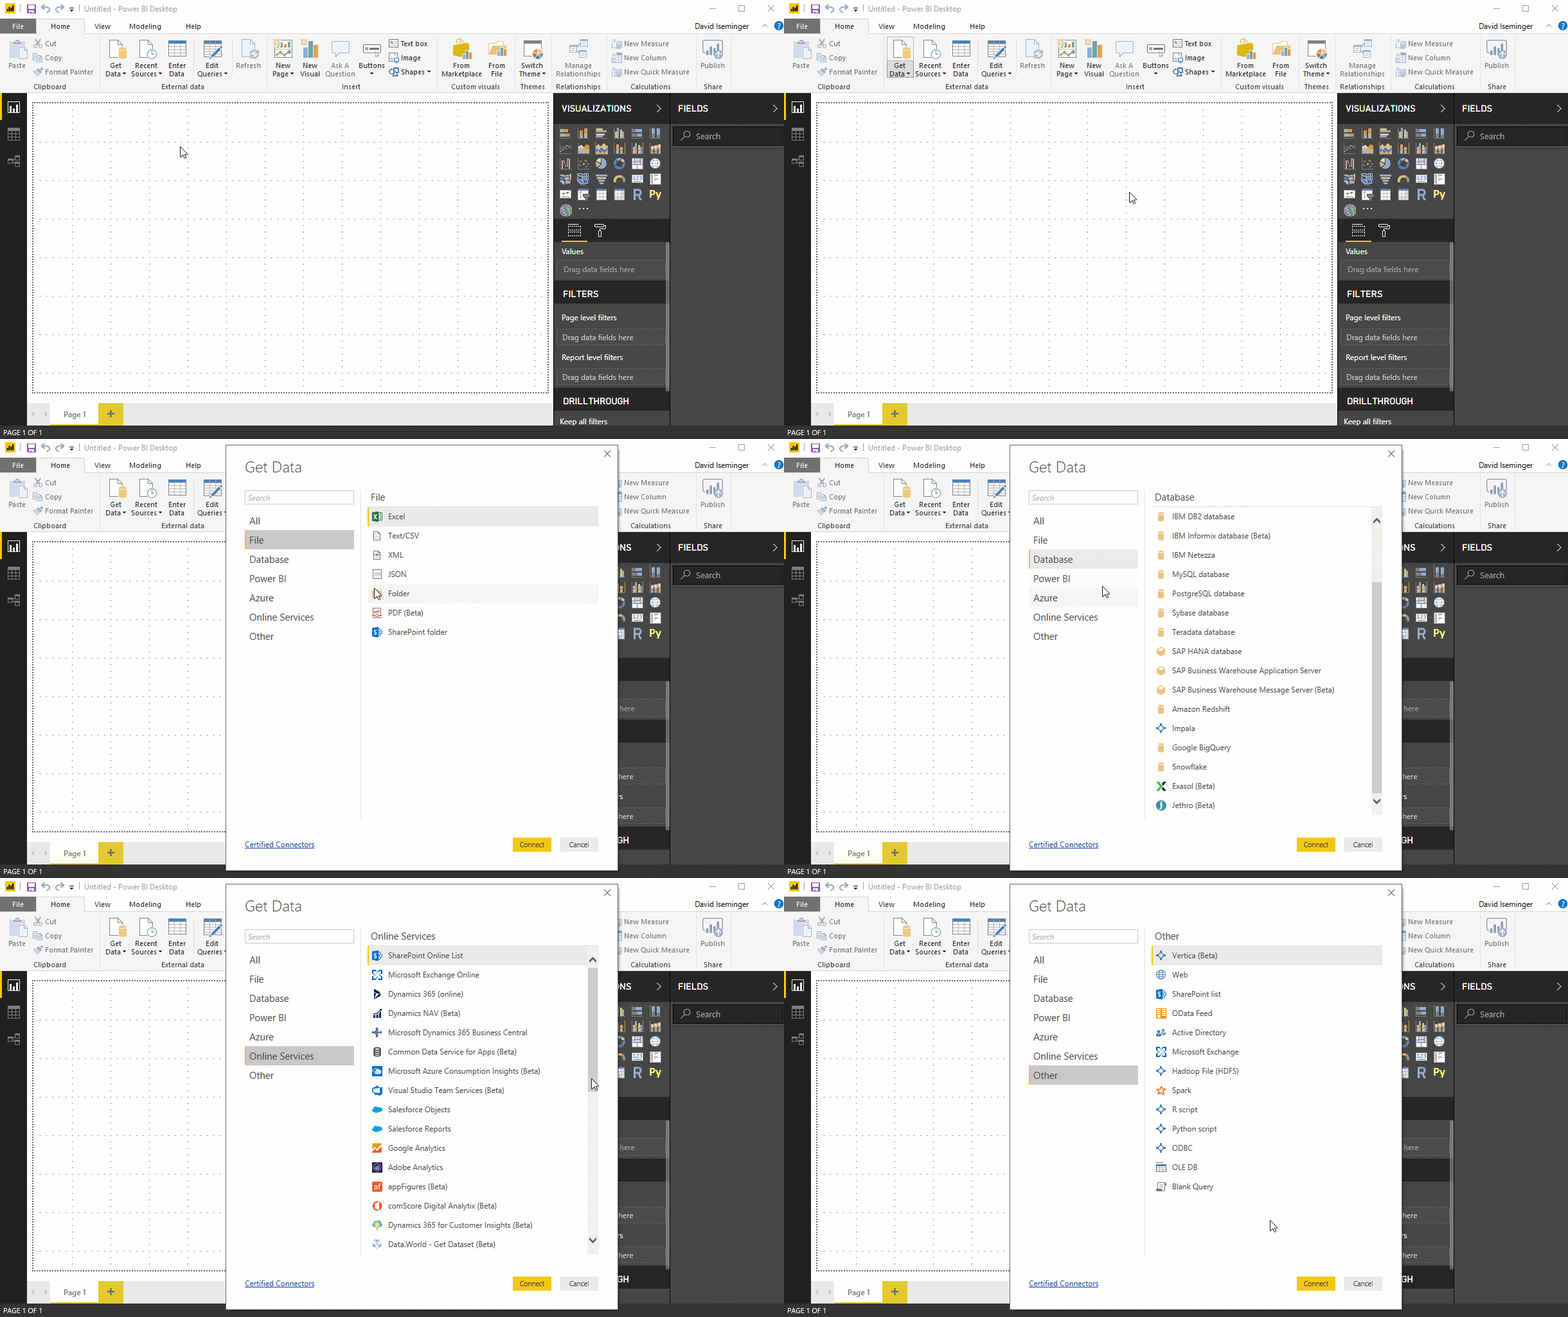
Become SQL Certified
4. Connecting to SQL Server
Let us walk through an example depicting how to connect SQL server database to Power BI Desktop and then use it to analyze the database.
Sample Database
For the demonstration purpose, we will be using a publicly accessible SQL Server instance on AWS and a database which has been created based on the Superstore dataset.
This dataset contains information about products, sales, profits, etc. and our aim as Data Analysts is to analyze the data and find critical areas of improvement within this fictitious company. This SQL server instance has been hosted by Ken Flerlage.
Accessing the sample database
- Install the SQL Server Management Studio(SSMS). SSMS is a free and integrated environment for managing any SQL infrastructure. With SSMS one can deploy, monitor, and upgrade the data-tier components used by your applications, as well as build queries and scripts.
- Once downloaded and installed on to your system, you will see the following screen asking for specific credentials.
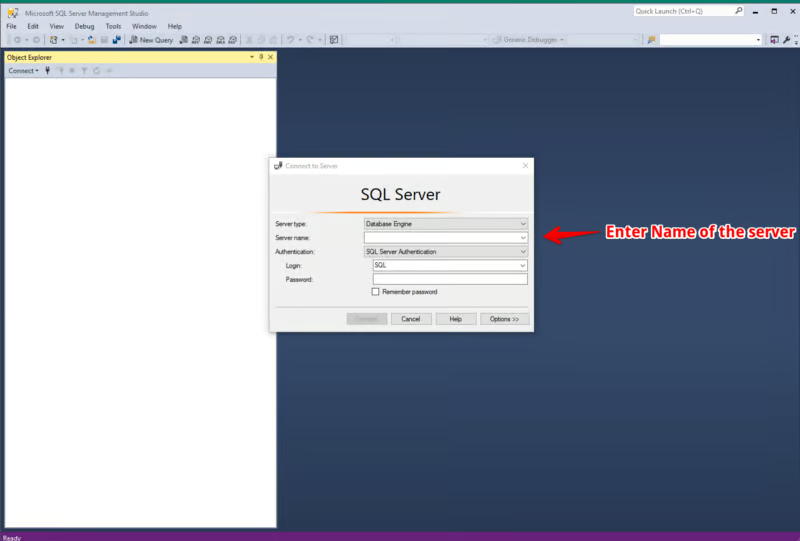
Enter the following credentials:
Server Name: ec2-52-14-205-70.us-east-2.compute.amazonaws.com
Authentication: SQL Server Authentication
Login: SQL
Password: SQL
You will now be granted a ‘Read Only’ access to the ‘SuperStoreUS’ database.
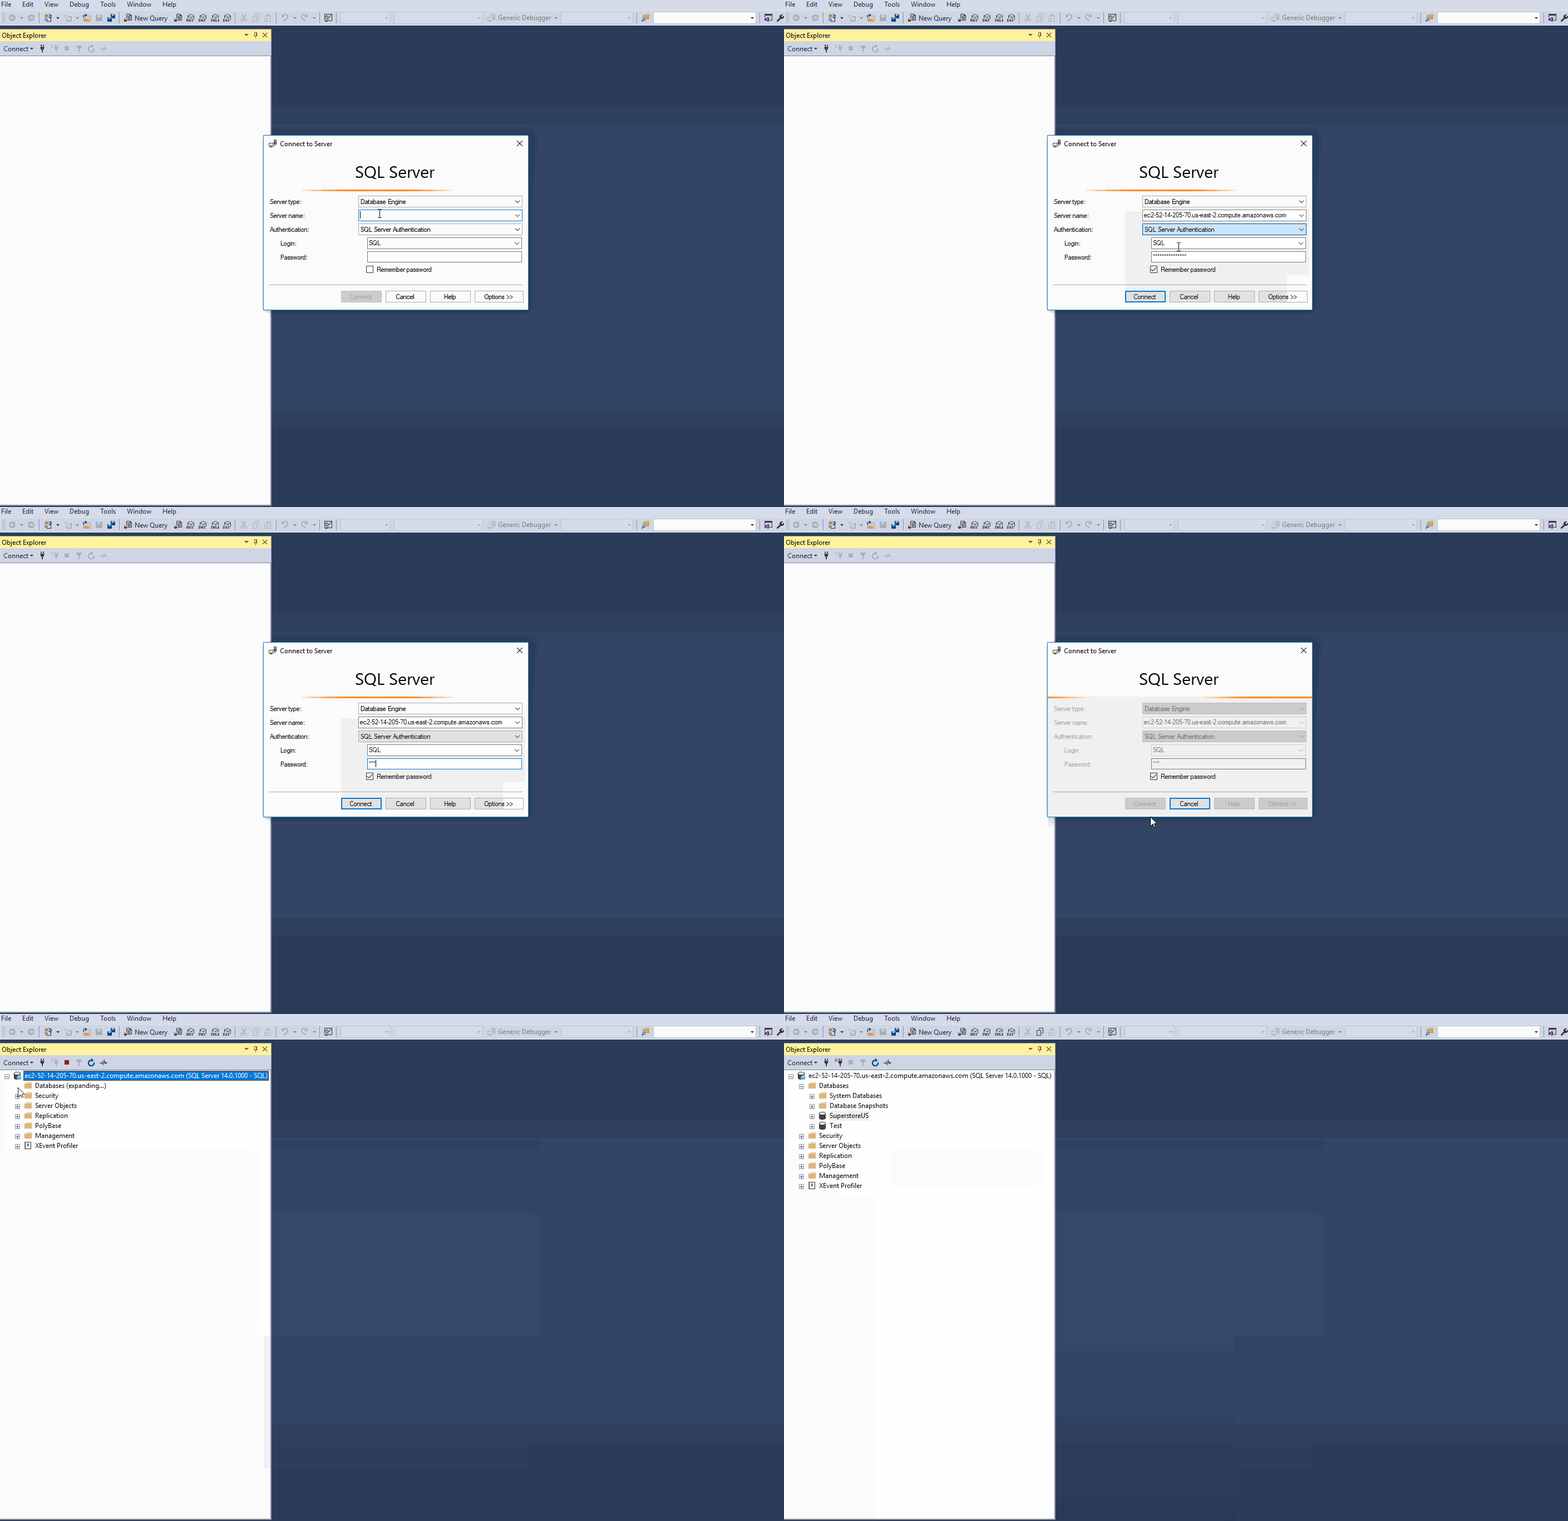
For our example, ec2–52–14–205–70.us-east-2.compute.amazonaws.com is the name of the instance, SuperstoreUS and Test are the databases, and Orders, Customers etc. are the tables within the SuperstoreUS database. Thus there can be multiple instances, and each instance can further contain numerous databases which can also have multiple tables.
5. Importing SQL data into Power BI
Power BI Desktop organizes the data into queries. This means all the data is laid out into a table like structure.
Setting up the connection
Open the Power BI Desktop and navigate to the start screen. Here the Get Data tab pane offers a lot of choices in terms of the data sources that can be connected to Power BI Desktop. We will connect to the SQL Server.
On Clicking the SQL Server option, a new screen will open up which will ask for the Server to which we want our Power BI Desktop to be connected. Enter the details and its done.
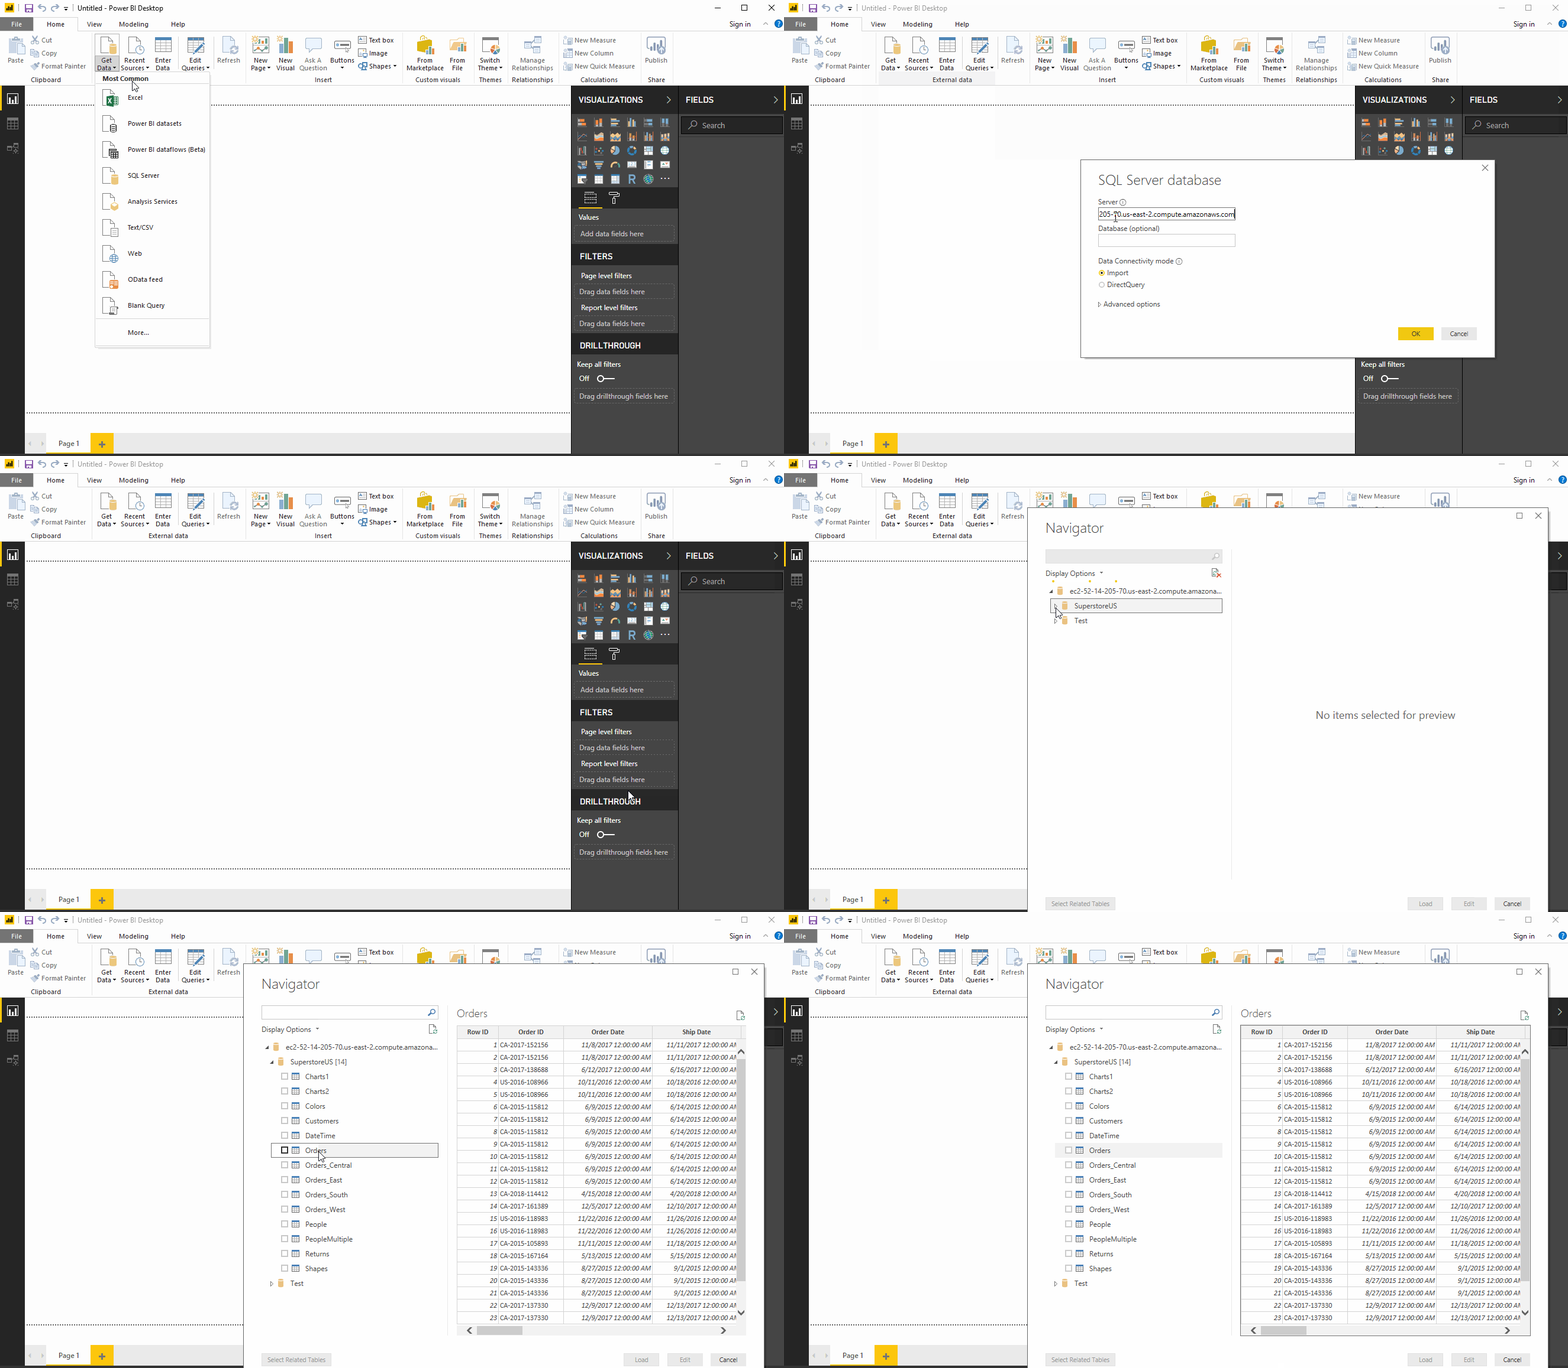
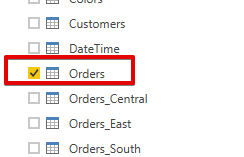
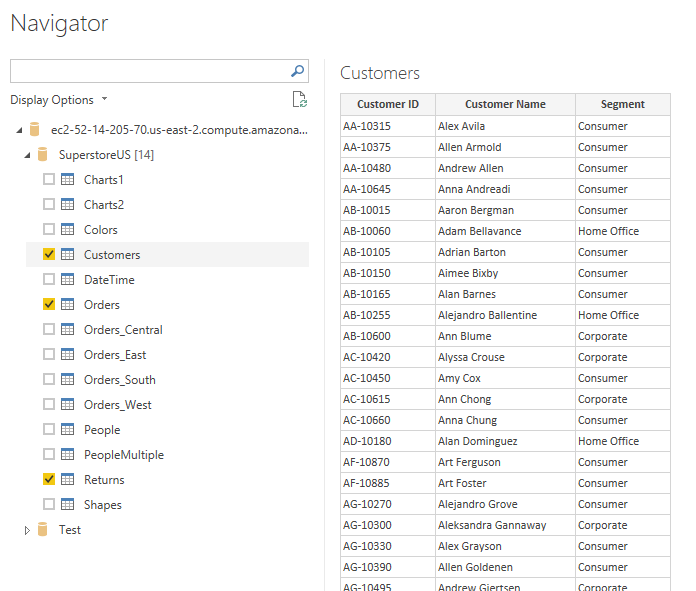
We can now click on the desired table and view its contents. To load a particular table, simply tick the checkbox next to it and load it.
Data Connectivity Modes
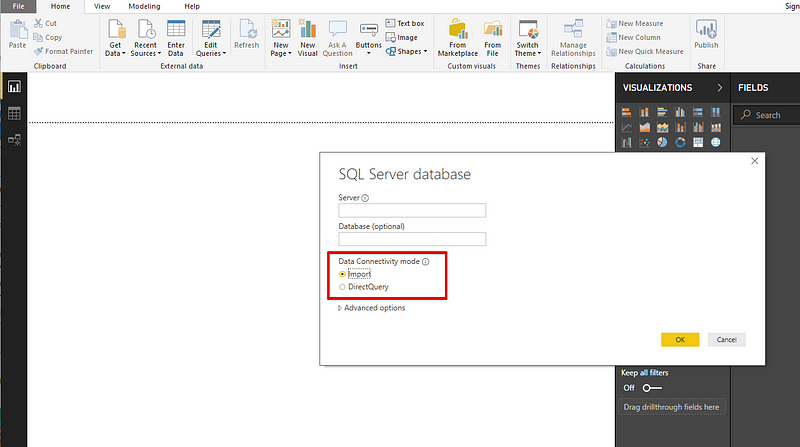
SQL database can be connected to Power BI Desktop in two ways, both the options which appear on the main screen.
Import
As the name suggests, import method ‘imports’ the selected tables into Power BI Desktop. Power BI then uses this imported data for creating a visualization or doing any manipulations. To see any changes in the underlying data, we need to refresh the data which imports the entire data set again.
DirectQuery
If DirectQuery is used as an option, no data is imported or copied into Power BI Desktop. While we create or interact with data through visualizations, Power BI Desktop queries the underlying data source, which means we are always working with the current data. However, this method provides limited options as to data manipulation, unlike the import method.
Here is a link that goes in depth regarding the Direct Query method.
6. Query Editor
All the selected tables will be loaded into the Power BI Desktop and will be displayed as individual datasets in the Data view.
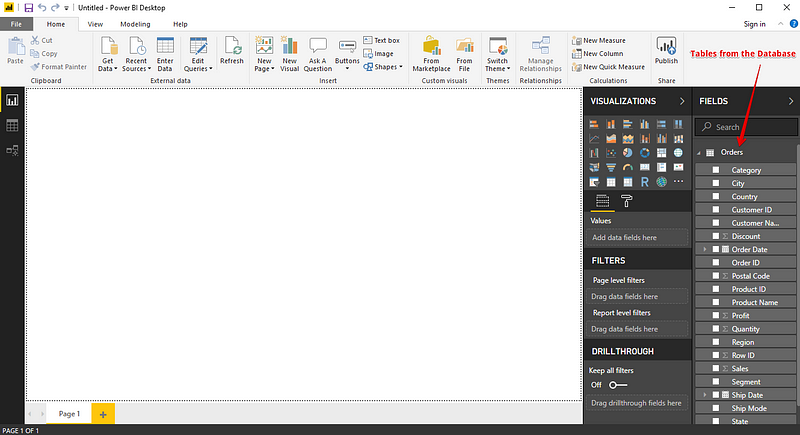
From here, we can modify our datasets. For this, we will take the help of the Query Editor. Query editor can be used for modifying datasets irrespective of their data source. We can do manipulations like renaming a dataset, removing a single or multiple columns, etc. in the query editor.
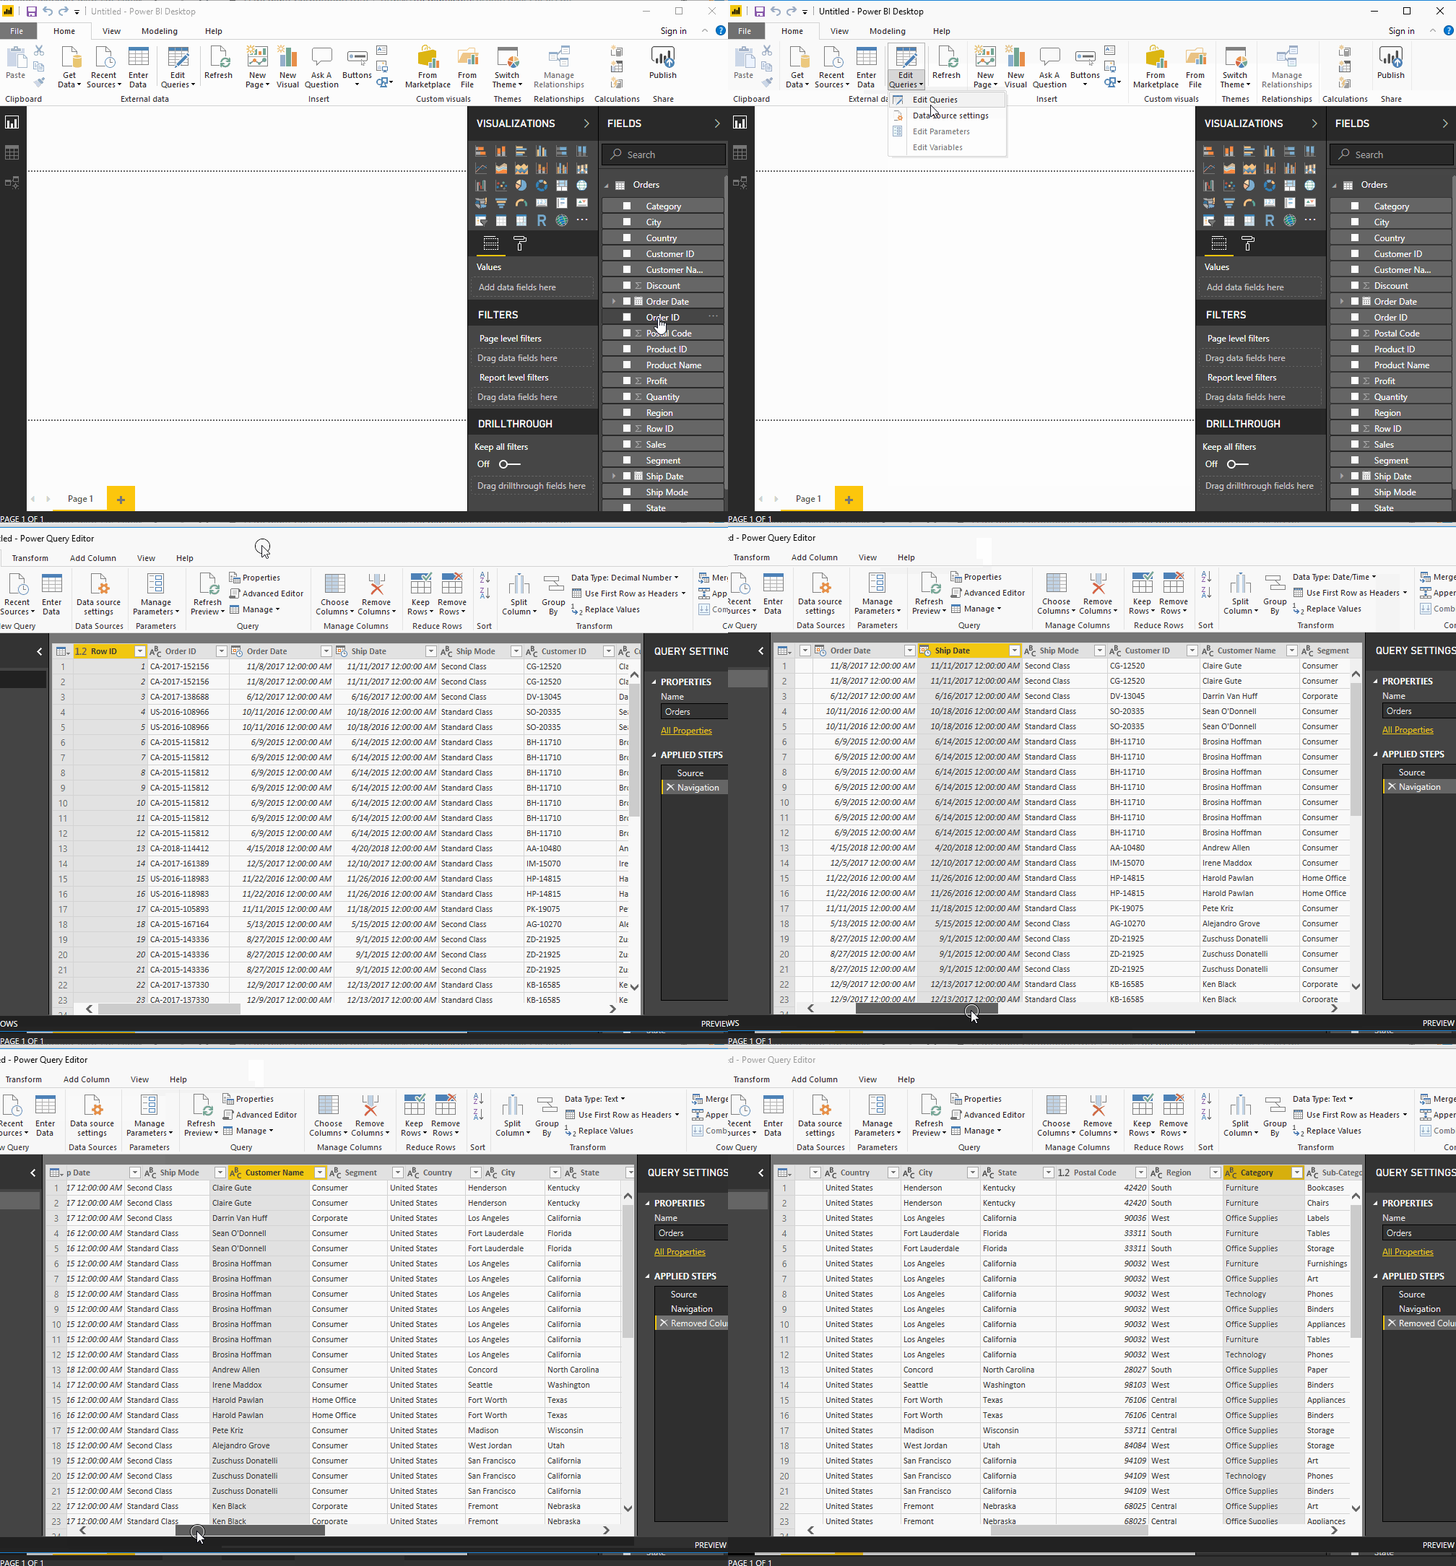
The Left pane displays the number of active queries while the right pane is called the Query Settings pane and displays all the steps associated with a query.
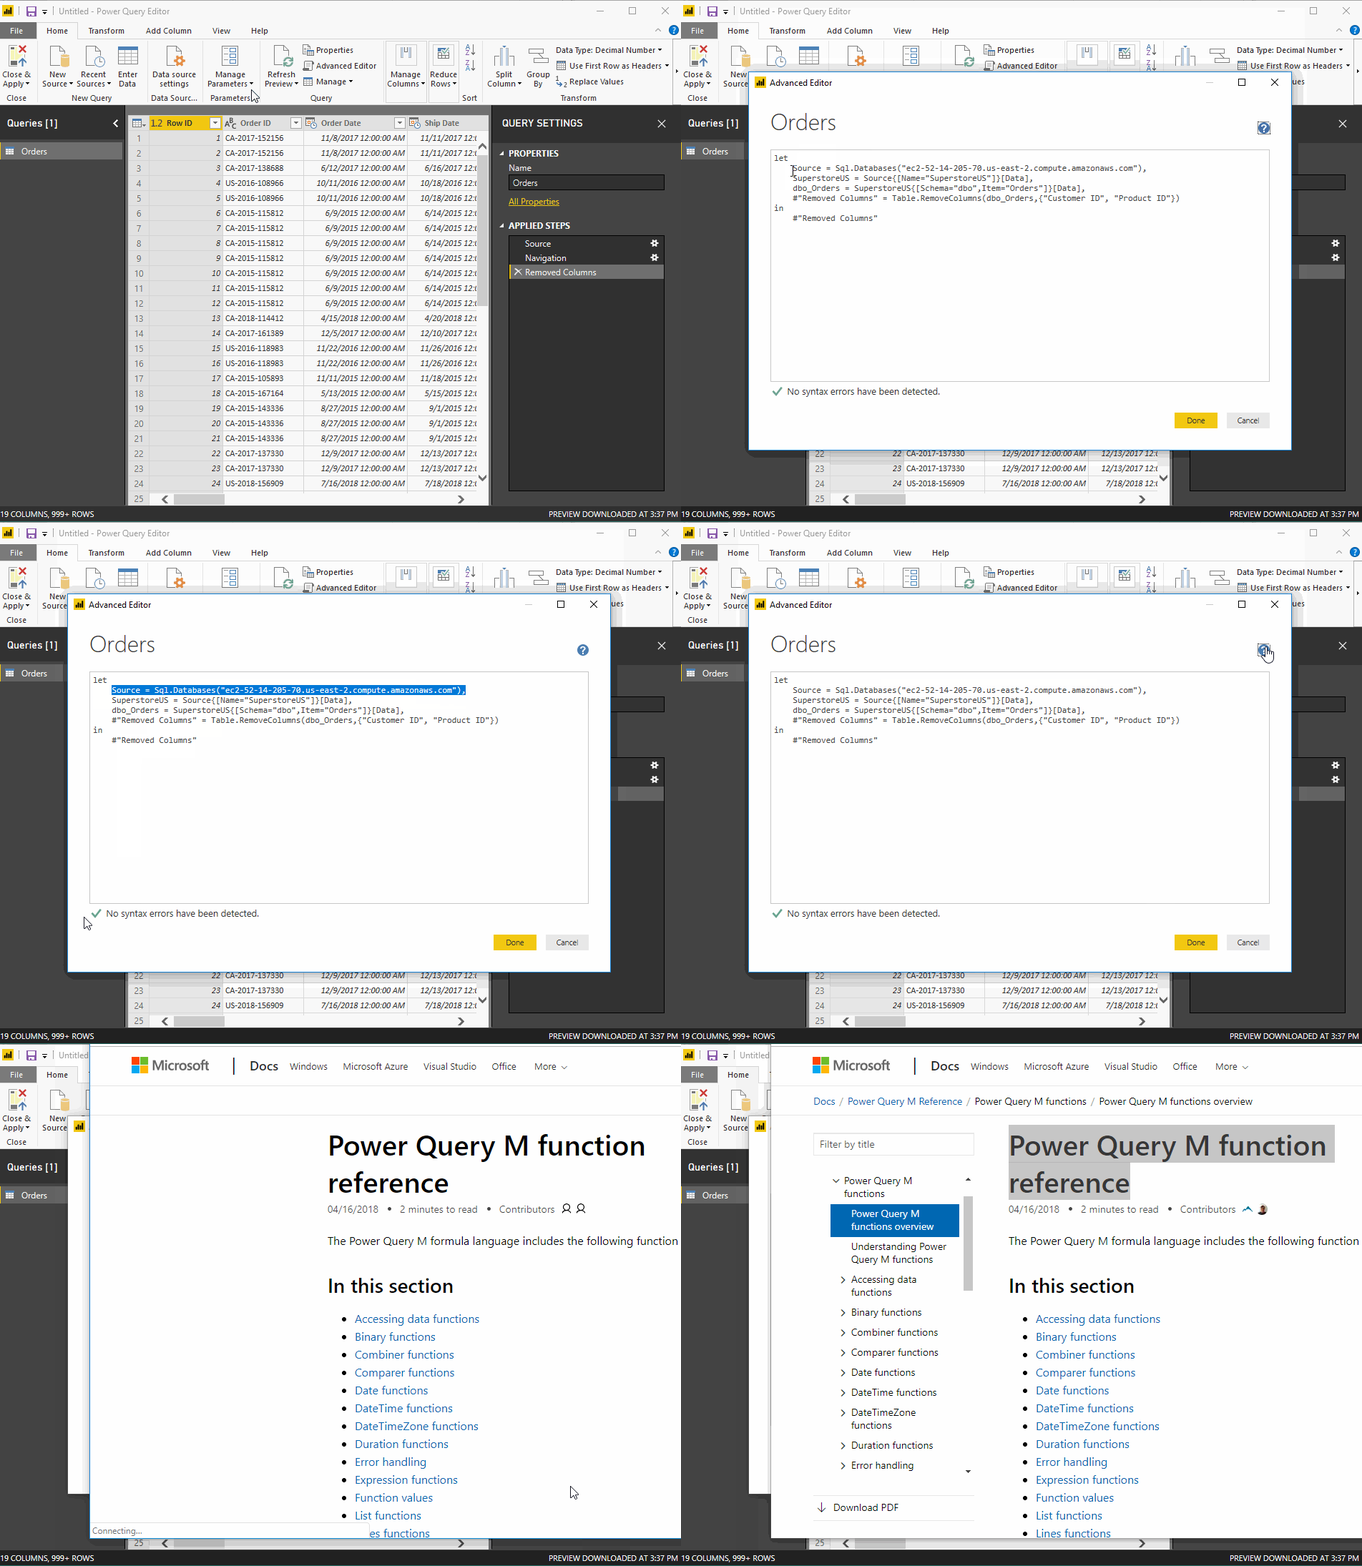
The Advanced Editor
The Advanced Editor displays the code for the query that is being executed against the data source. The syntax corresponds to M, the Power Query Formula Language. One can also create their own code.
Saving your work
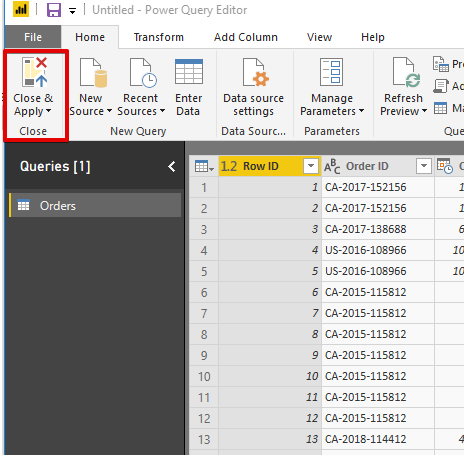
After having performed the necessary modifications in data through the query editor, select Close & Apply from Query Editor’s File menu. This will apply the changes to the data in the Power BI Desktop.
7. Merging Datasets
Merging datasets comes in handy when we want to combine one or more datasets into one. This merging is also facilitated through the Query Editor. This time we will load in three tables from the SuperstoreUS database. The tables are Orders, Customers, and Returns.
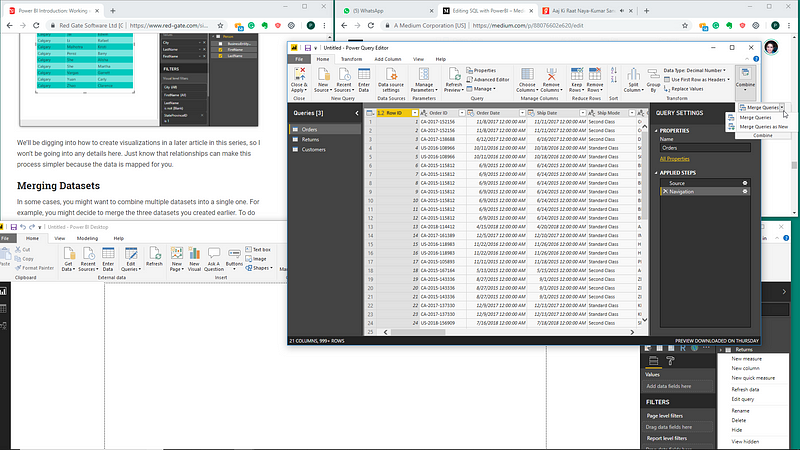
The Fields column is populated with the three selected tables. Now, click on the Edit Queries button and navigate to Combine option, where the dropdown will expose the Merge option. We shall use the create a new query by merging existing queries.
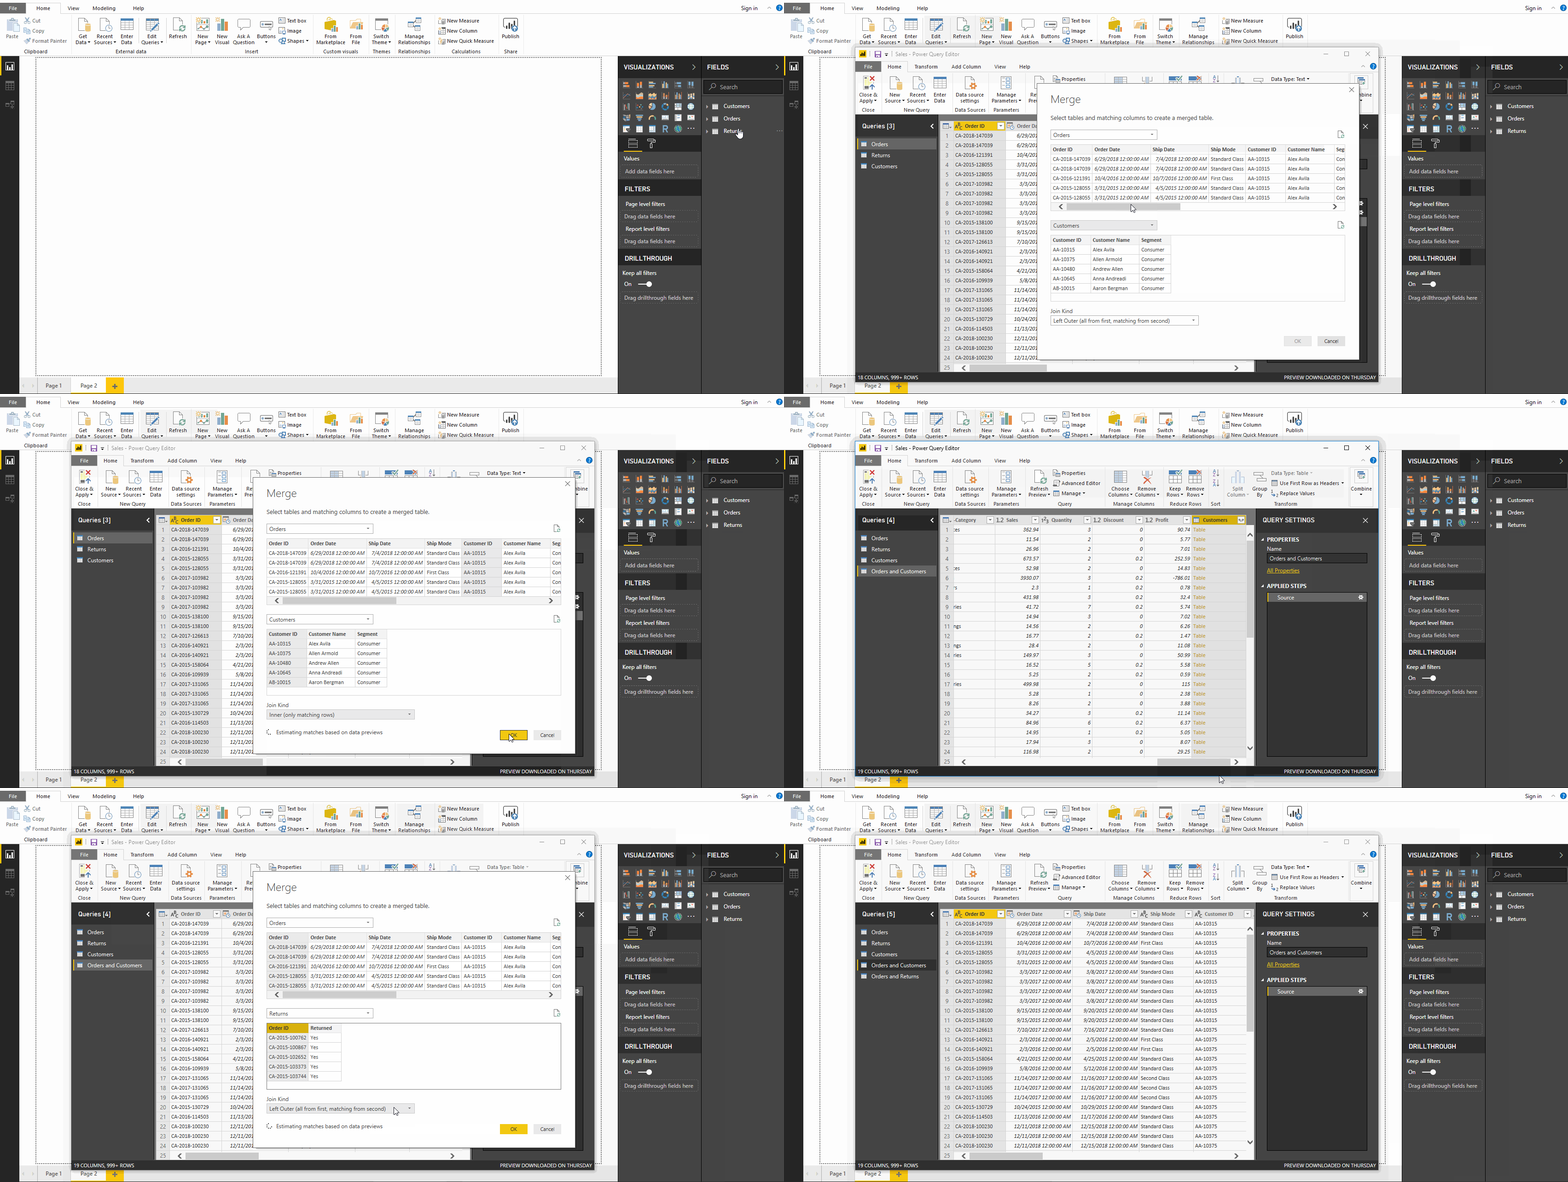
The Merge dialog box opens up (as shown in the following figure), and we select the tables to be merged and the type of join we want. We need to select columns which are common to both tables.
Let’s create a new query and name it as Orders and customers. We will combine the Orders and Customers table through this query.
This new query contains all the primary columns from the orders’ table and relationship columns from the customers’ table. Delete all the relationship columns except the last one, which represents the Customers query. Then select columns from Customers query to add to the new merged query.
The following demo will make the process more clear.
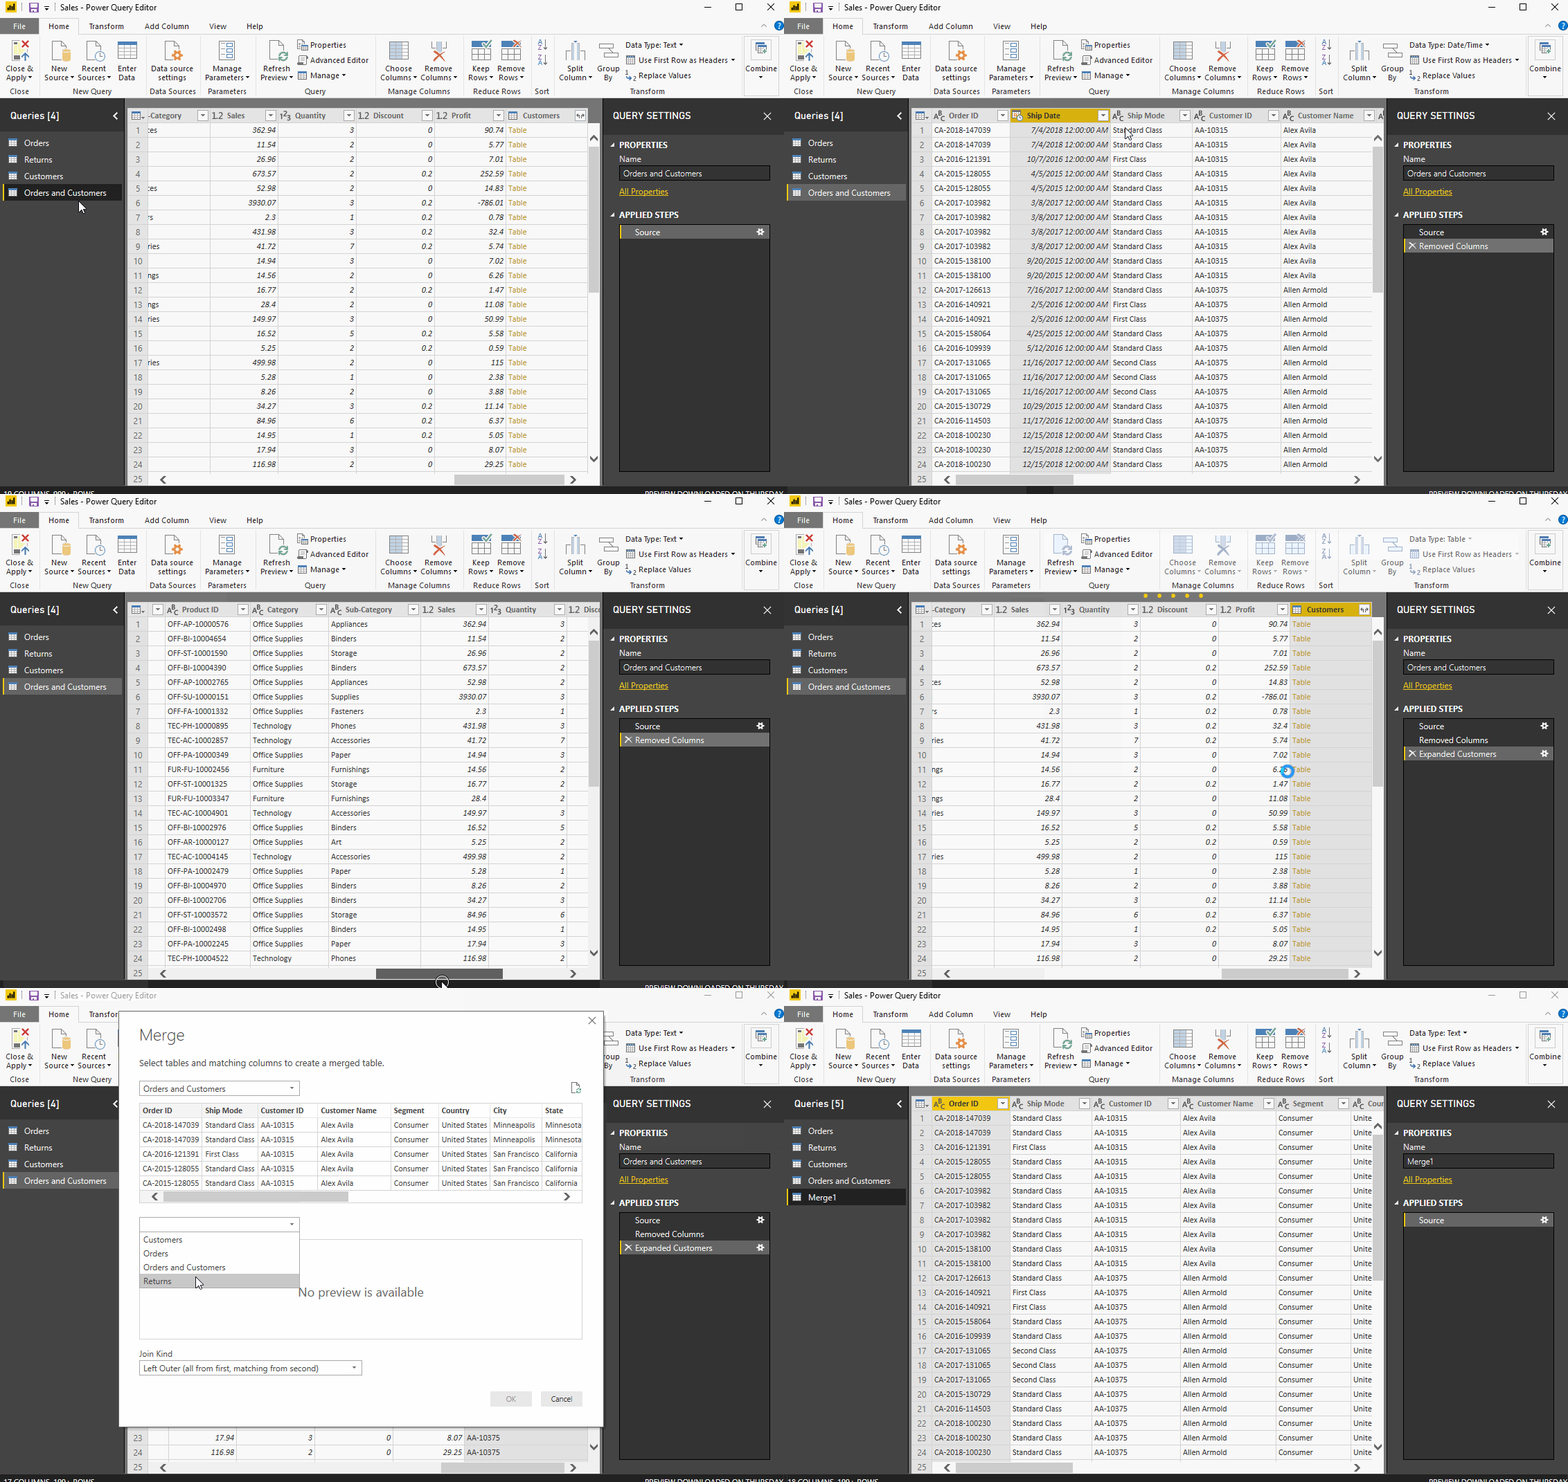
This merged query consists of a single database with all the desired columns. We can now easily work with this single database instead of working with multiple data sources which can lead to confusions.
8. Building & Publishing a Dashboard
Once we have the dataset ready with all the manipulations done, we can proceed for the Dashboard creation process. A Power BI dashboard, also known as canvas, consists of many visualizations on a single page which helps to tell a story. These visualizations called tiles are pinned to the dashboard from the reports.
Let’s now try to understand what insights we can get using superstore data set (Source: Power BI Dashboard):
- Profit by States
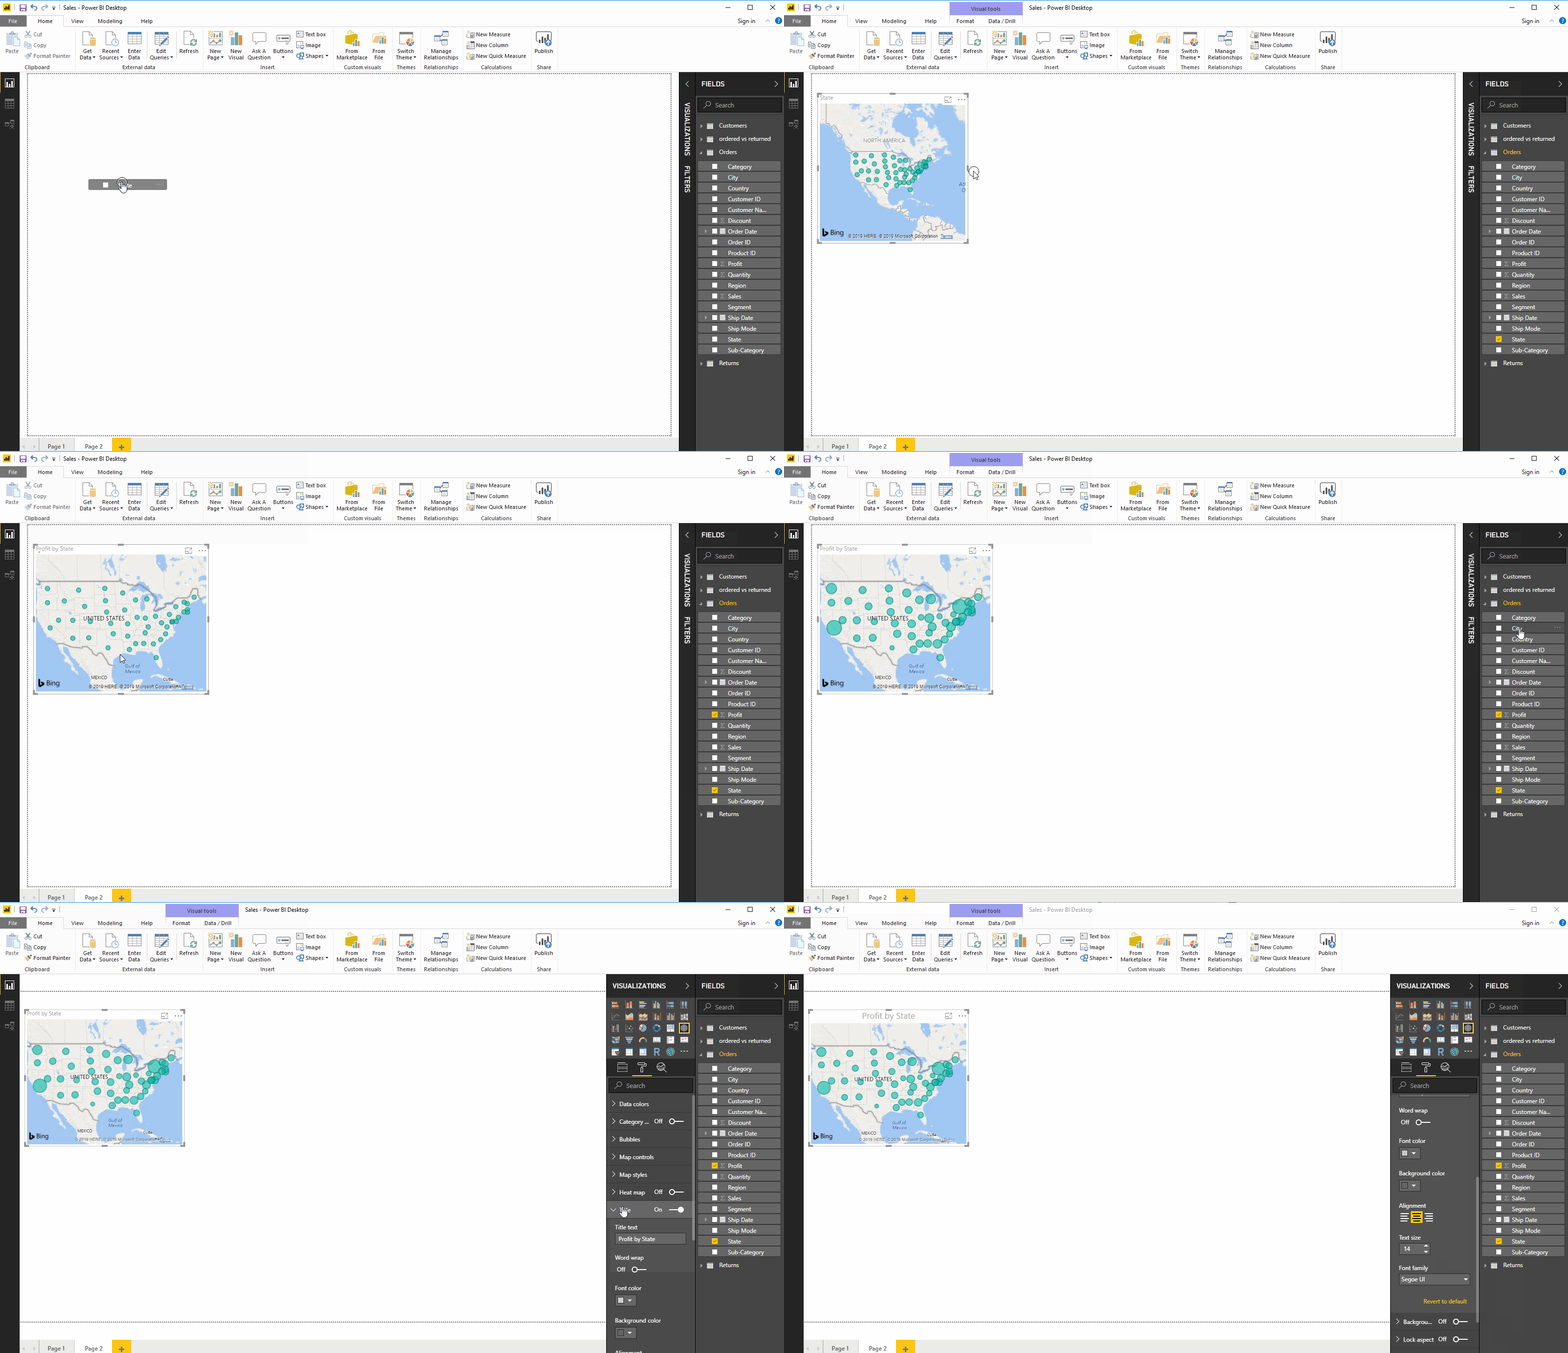
- Sales & Profit by segment
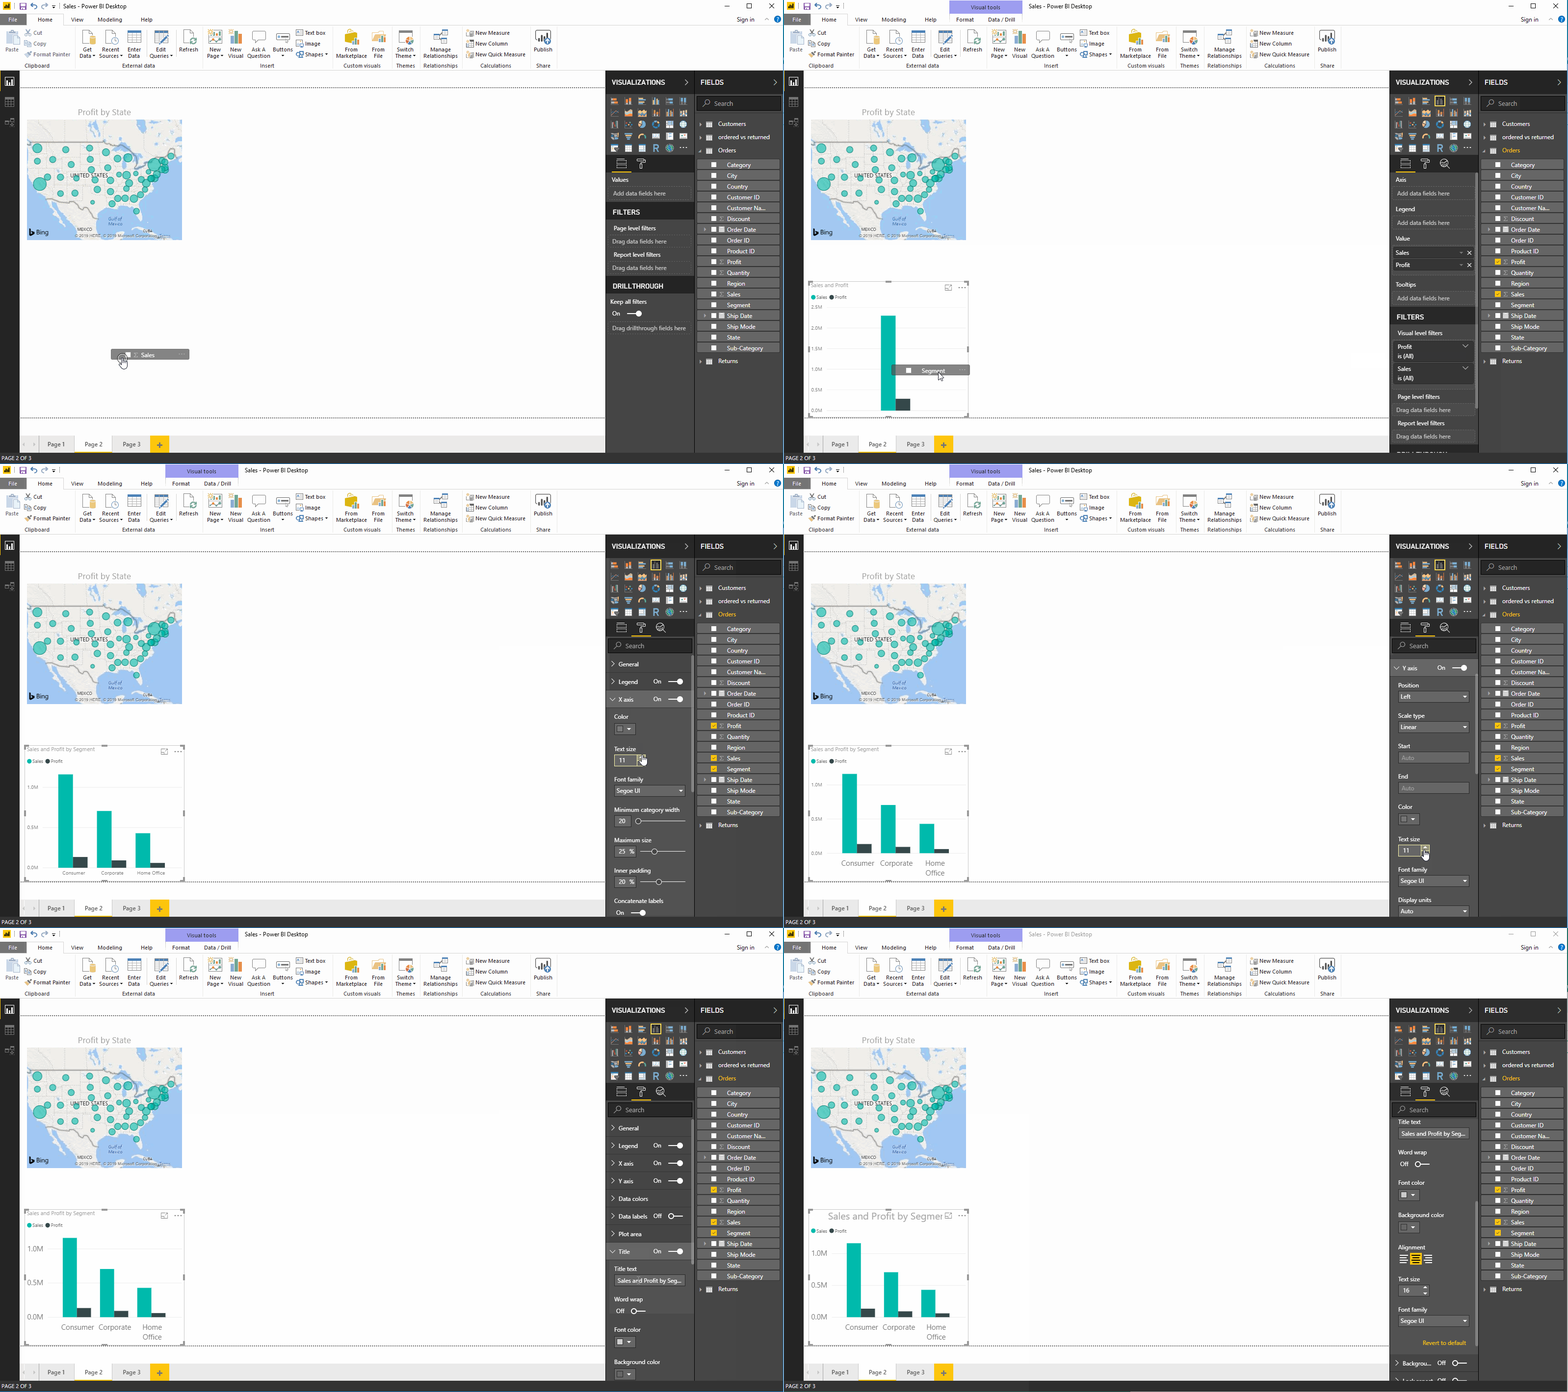
- Sales & Profit by Region
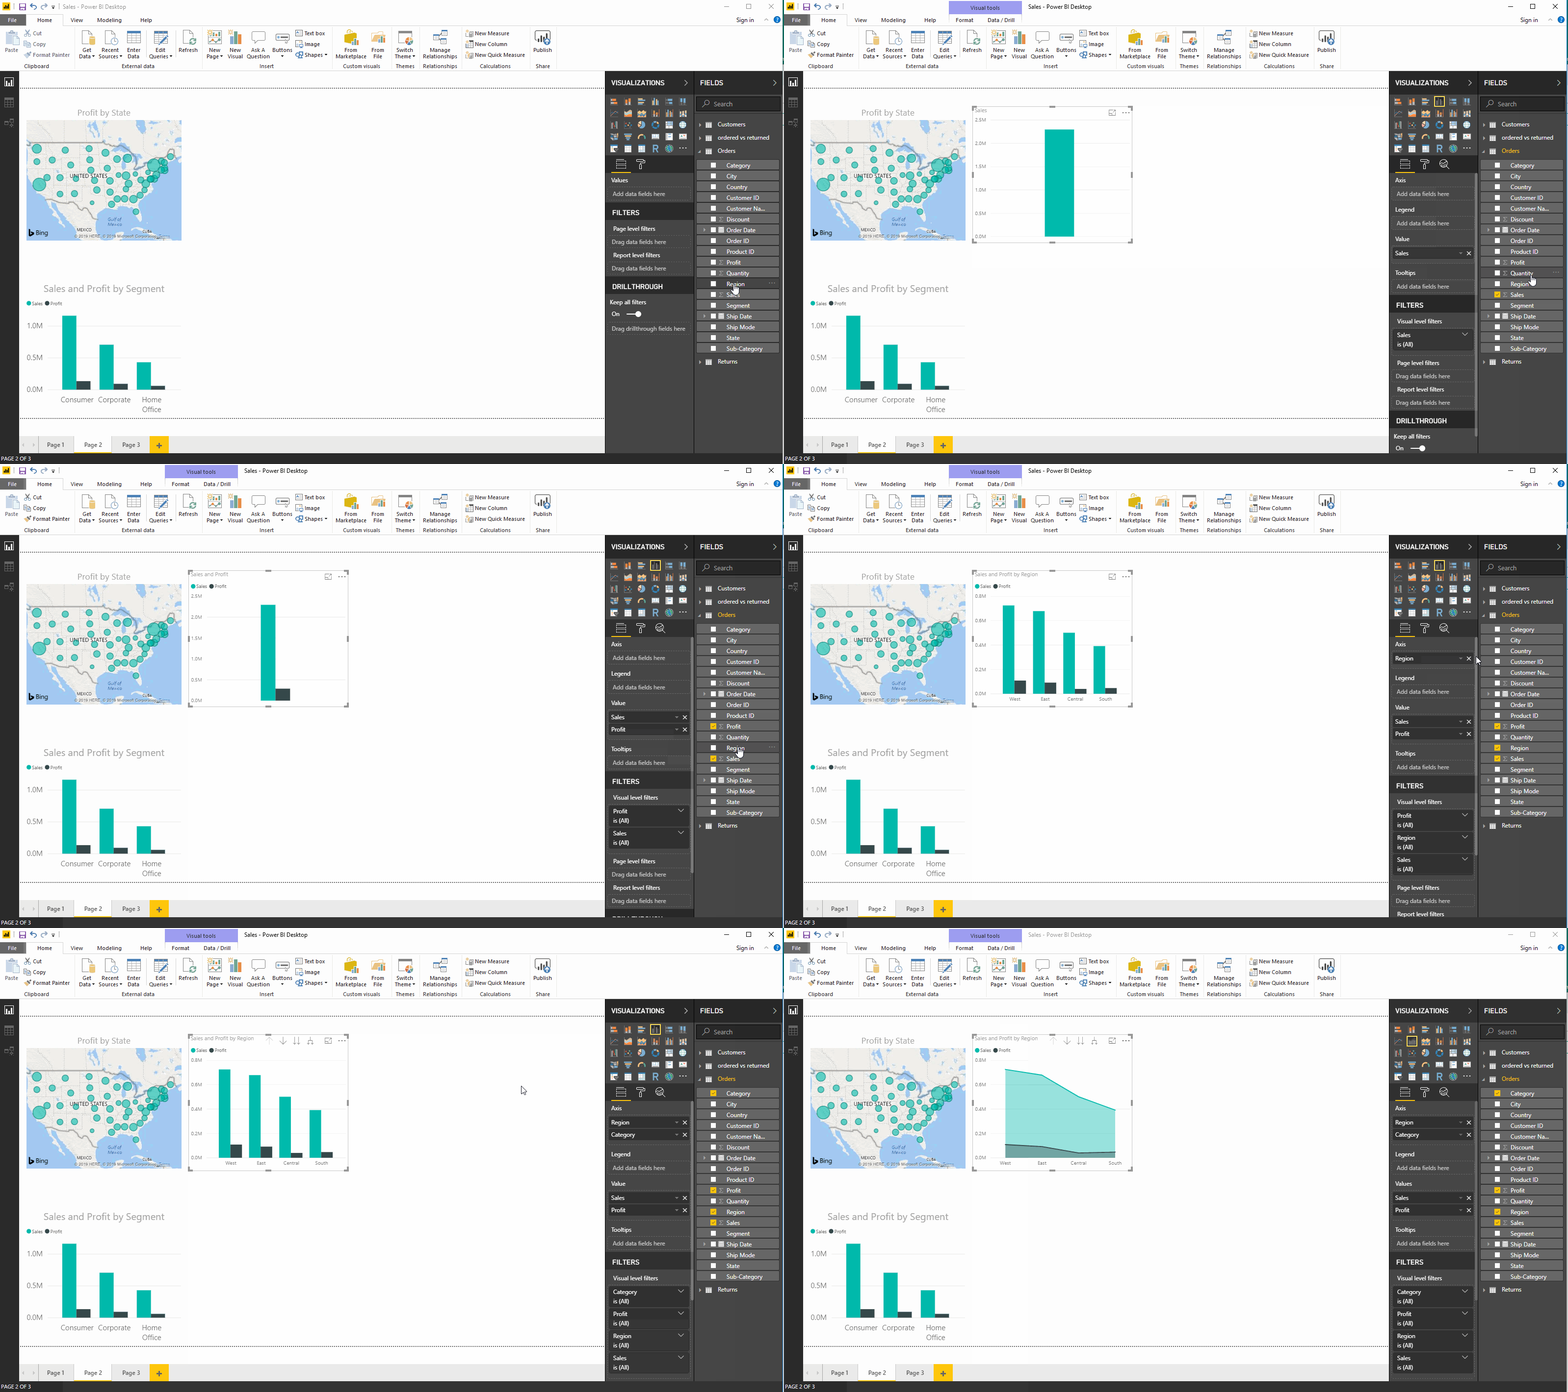
- Sales by Sub-Category
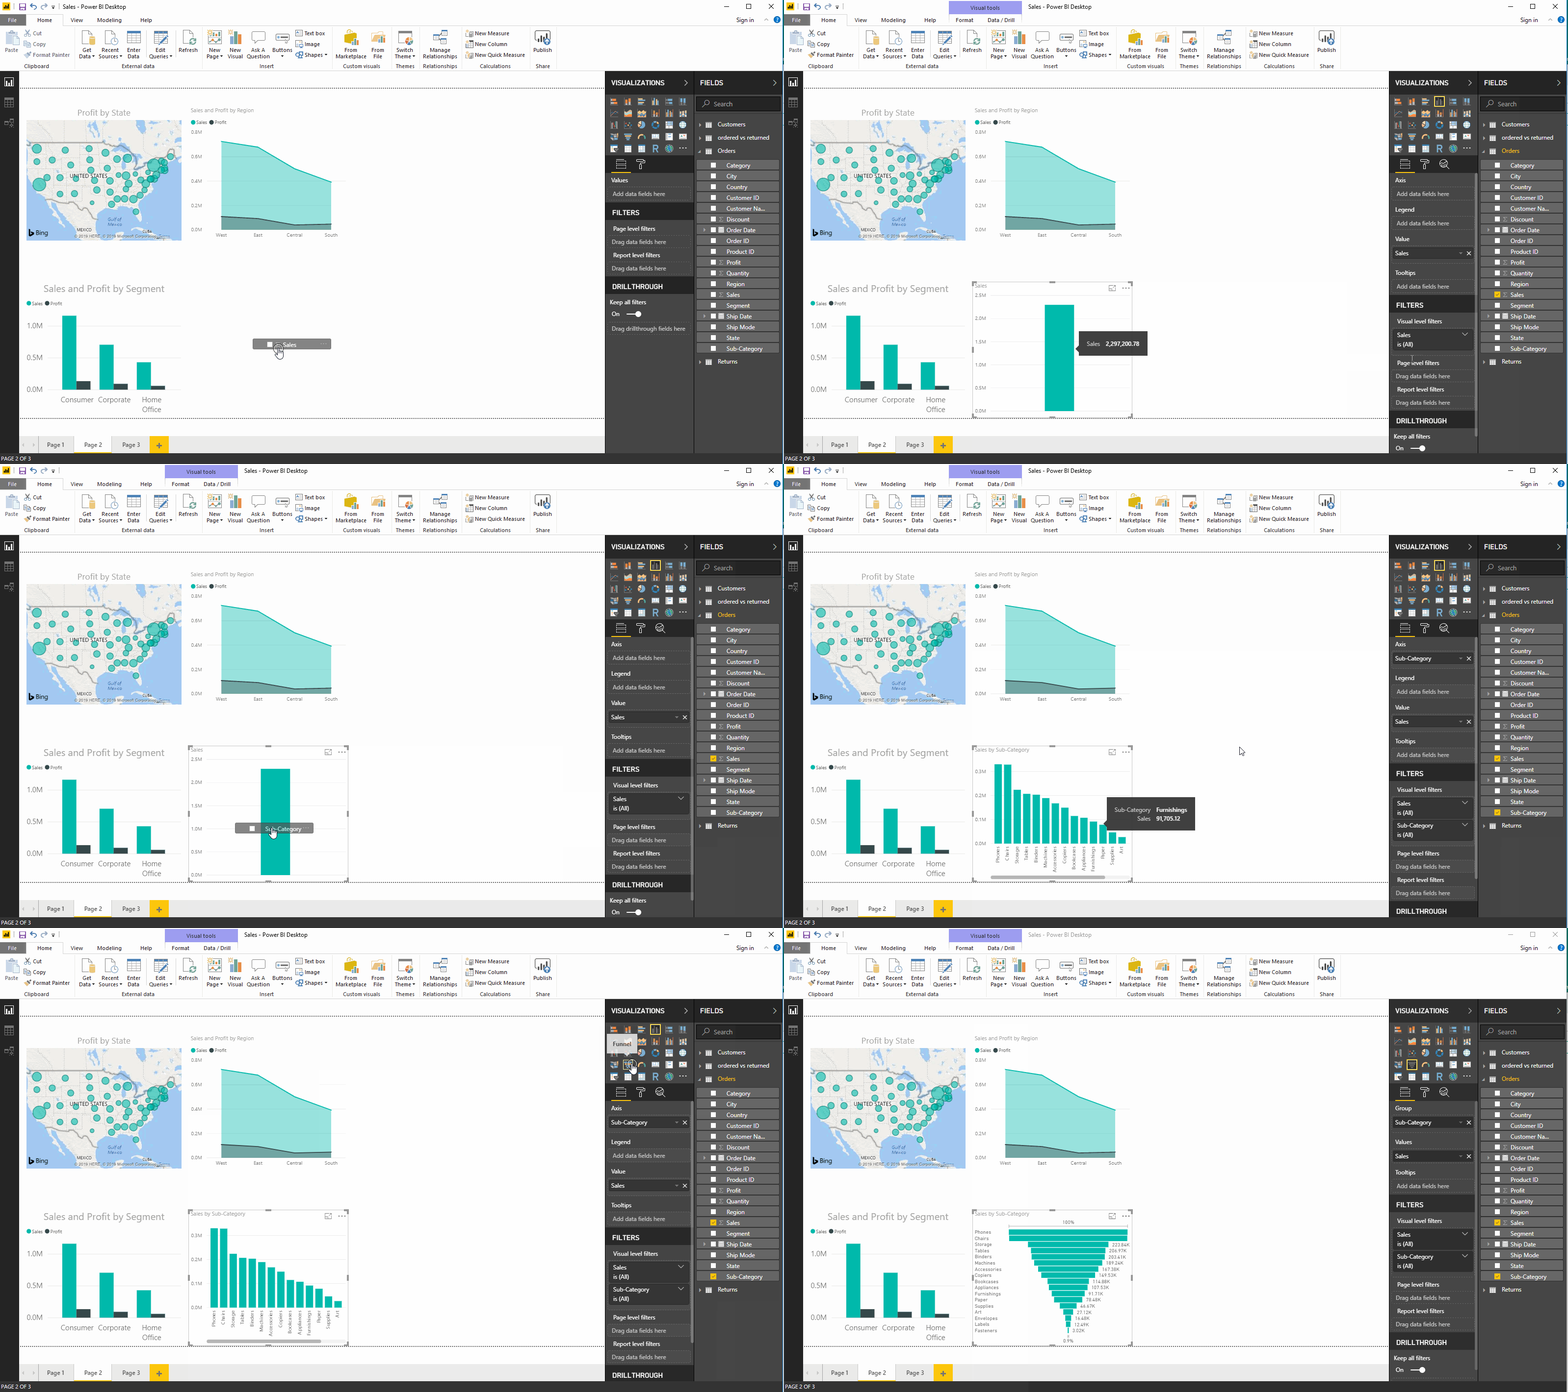
- Profit by region
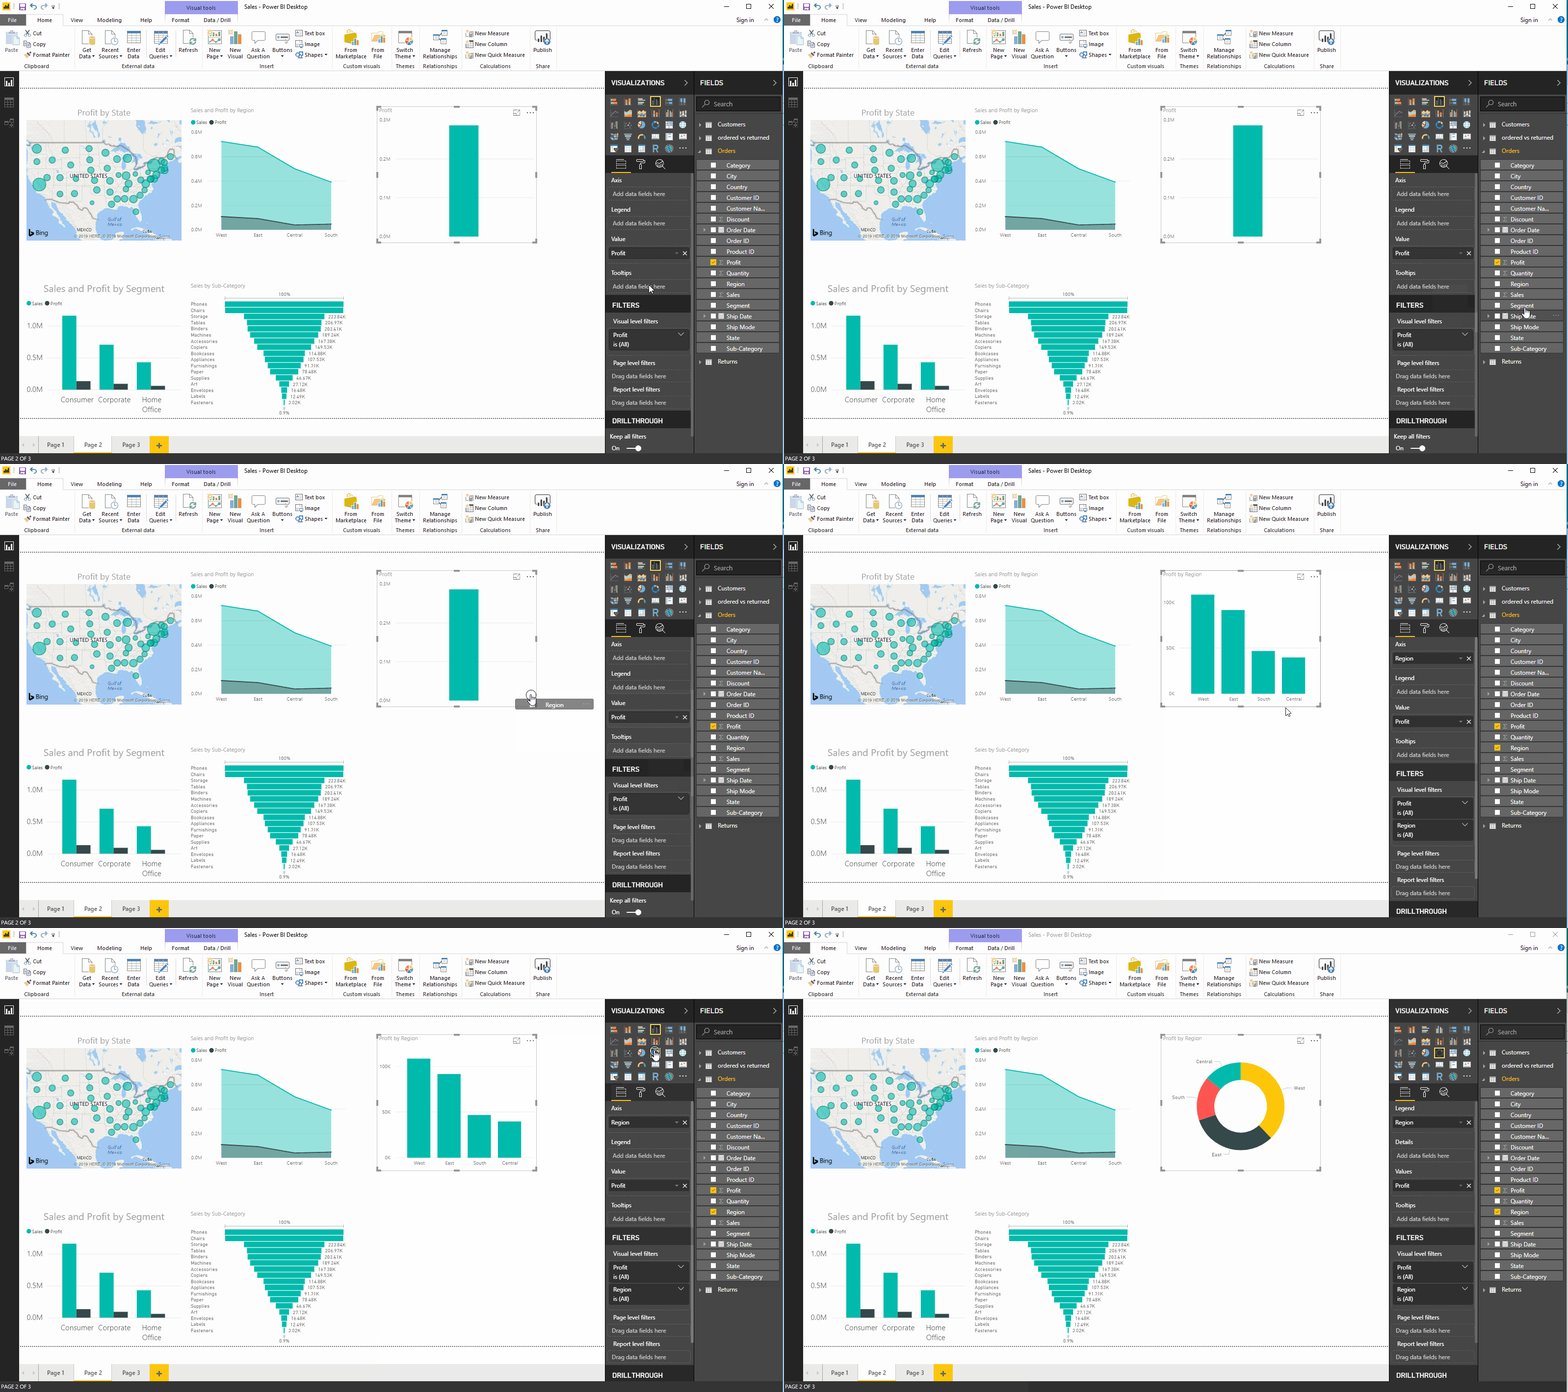
- Quantity
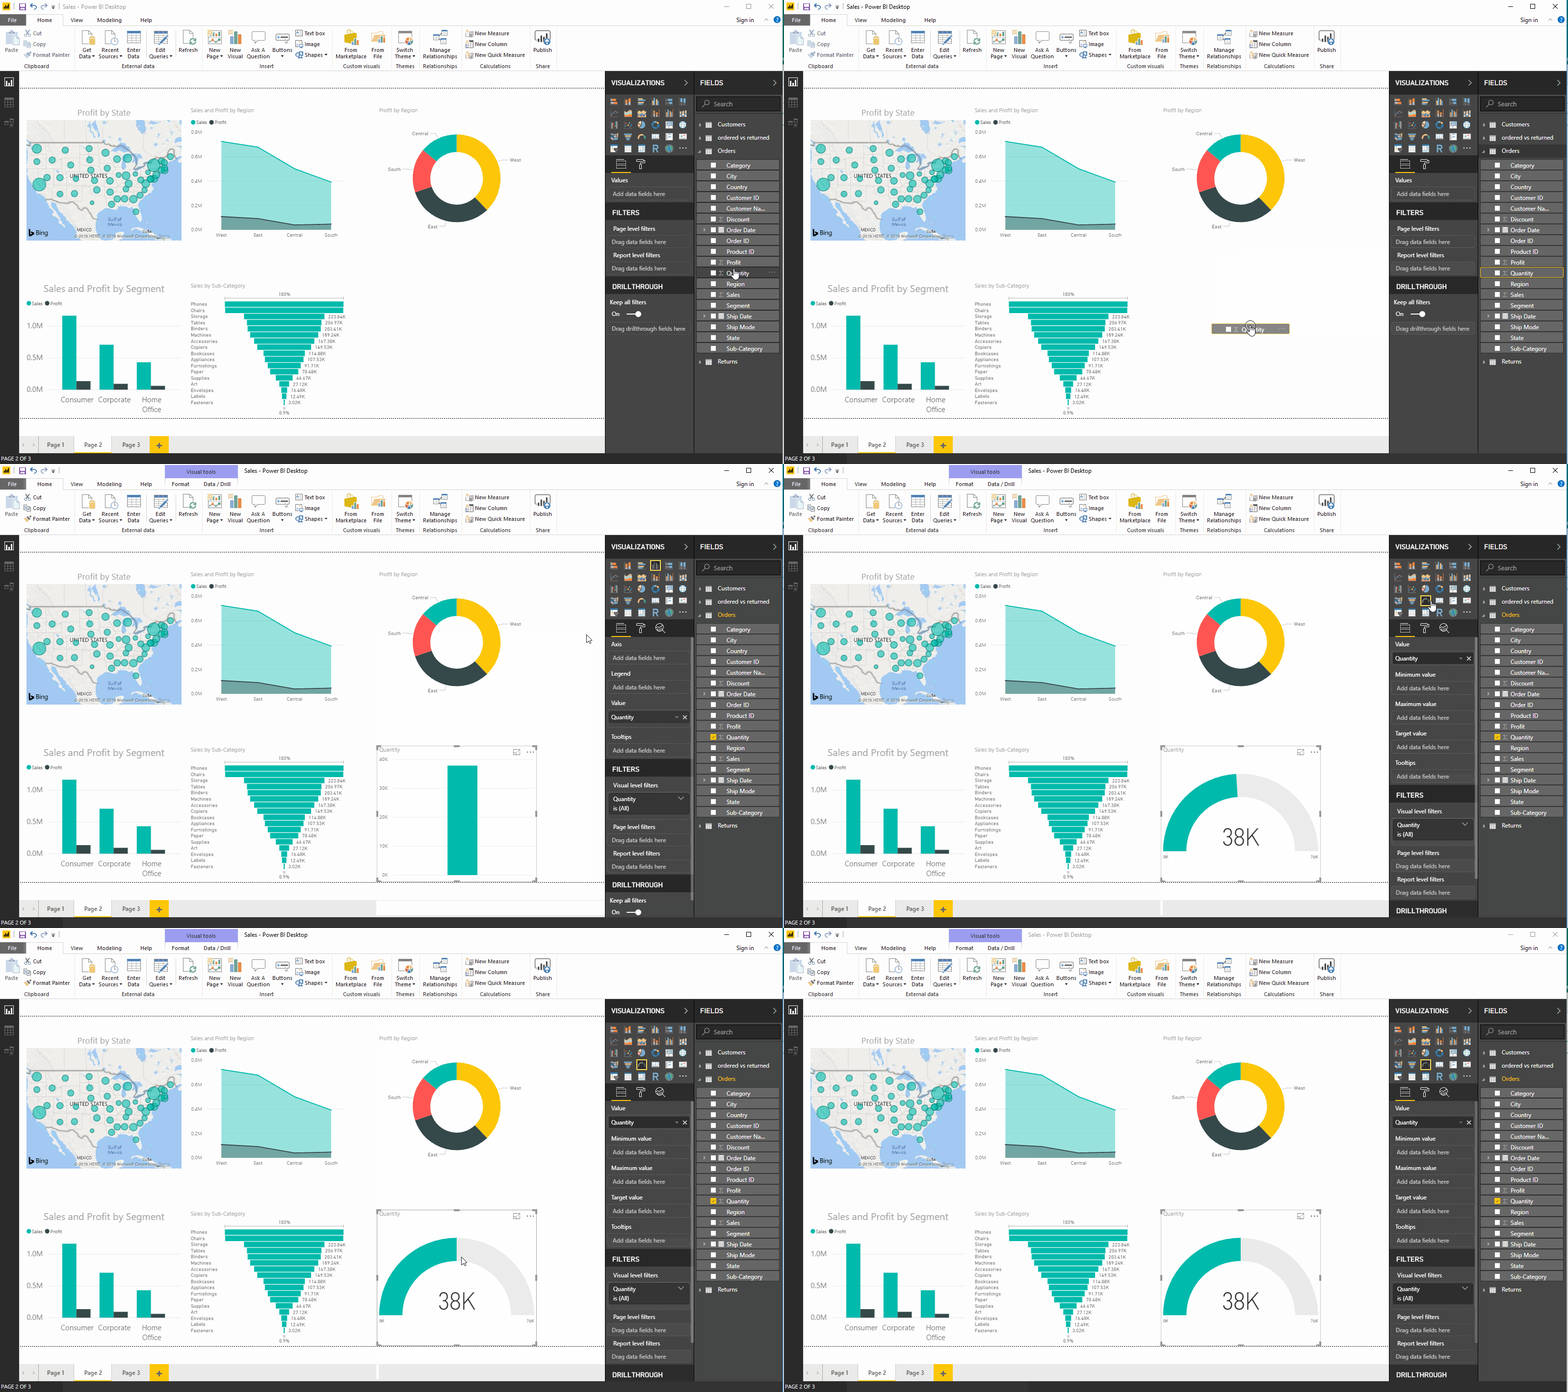
After formatting the size, appearance, and color, we will get a dashboard which resembles the one below.
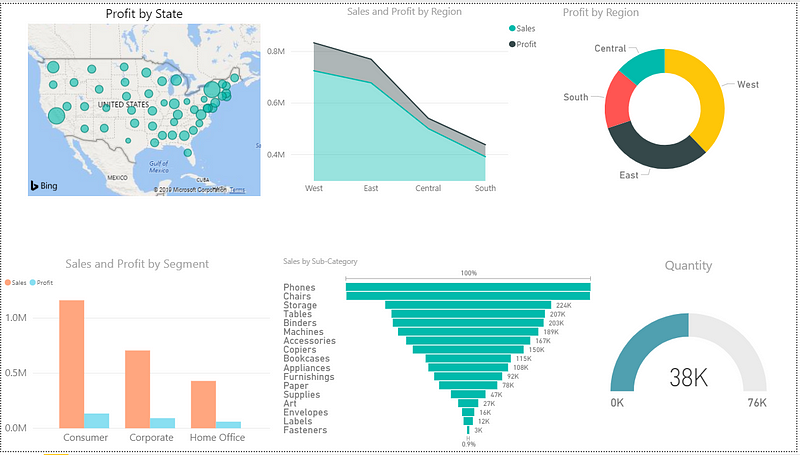
Superstore Dashboard
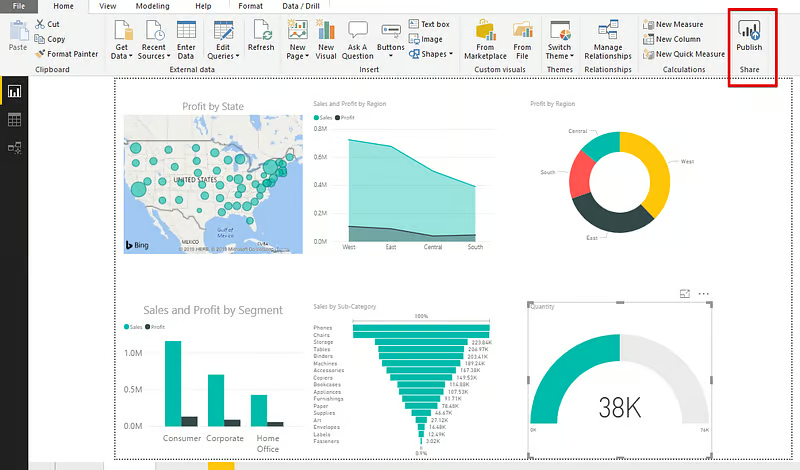
Publishing
Data is only useful when it can be shared among people or organization. The generated Dashboard or reports can also be shared by publishing it to the Power BI Service. We can then use the Power BI Apps to view or interact with the Dashboards/Reports.
9. Conclusion
Using SQL and Power BI together takes the data analysis to the next level. We can easily connect the SQL Server to Power BI and extract the data directly into it. Power BI enables the users to toggle connections with a click to apply in-memory queries to a larger dataset. SQL is a pretty useful tool and when leveraged with the expertise of Power BI can help to make the analysis more powerful and insightful.

