
Course
Data Analysis in Excel
3 hr
143.2K
You give it three things:
Let's see it in practice.
You run a small business selling notebooks. Your current revenue is $25,000, but your target is $50,000. The price is fixed at $25, so you need to find out how many units you need to sell.
Here's how to do it:
Go to Data > What-If Analysis > Goal Seek
In the Set cell, click on cell B4 (your revenue formula cell)
In the To value, type 50000
In By changing cell, select B2 (Units Sold)
Click OK
Goal Seek adjusts B2 from 1,000 to 2,000 units — the exact number needed to hit $50,000 in revenue at $25 per unit.
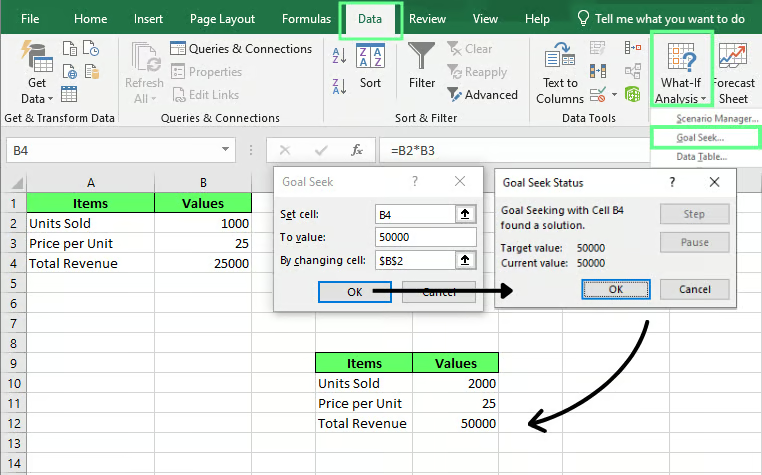
Using Goal Seek to achieve a specific result. Image by Author.
Scenario Manager is a What-If Analysis tool that lets you save and switch between multiple sets of input values in the same spreadsheet. Each saved version is called a scenario.
You can create as many as you need and switch between them instantly to compare results.
It is helpful when you want to plan for best-case, worst-case, and expected-case outcomes without keeping three separate files.
You give it three things:
Let's say you're planning quarterly sales for your notebook business.
Suppose your current profit is $15,000. You want to model three scenarios: best case, worst case, and expected case.
Here's how to create a scenario:
Go to Data > What-If Analysis > Scenario Manager
In the Scenario Manager dialog box, click Add
In Scenario name, type Best Case.
In Changing cells, select B2:B4.
A Scenario Value dialog box will appear. In the given fields, enter these values:
B2 = 2000,
B3 = $30
B4= $10
Click OK.
Repeat these steps for the remaining two scenarios using the values below:
|
Scenario |
Units Sold |
Price per Unit |
Cost per Unit |
|
Best Case |
2,000 |
$30 |
$10 |
|
Expected Case |
1,000 |
$25 |
$10 |
|
Worst Case |
500 |
$20 |
$10 |
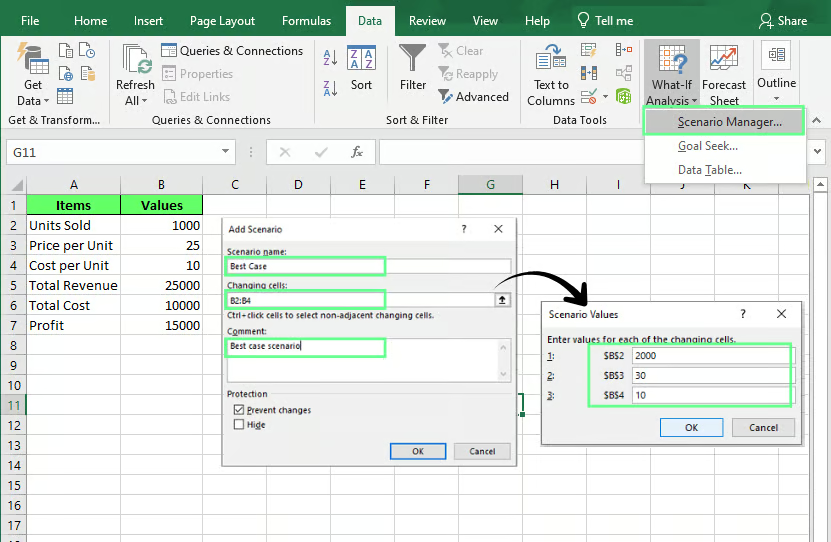
Create a scenario with three cases. Image by Author.
To switch between scenarios, select one from the list and click Show. Excel swaps the values instantly, and your profit updates.
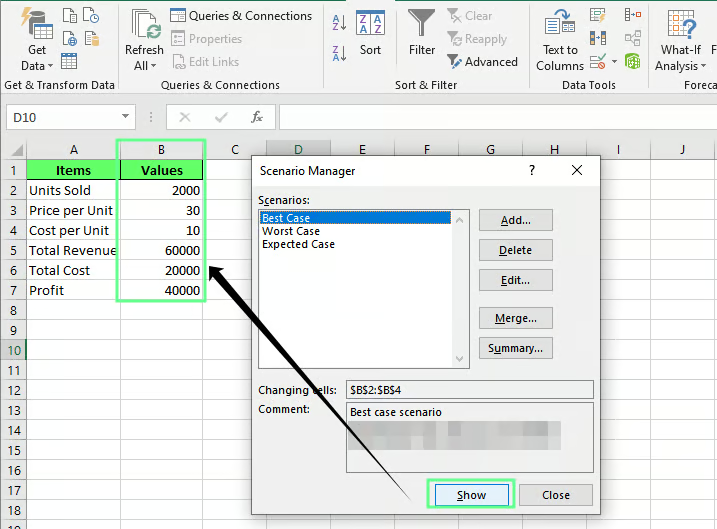
Click Show to see the values of each scenario. Image by Author.
Select any scenario from the list and click Edit. You can rename it, change which cells it covers, or update the values. Nothing changes in your spreadsheet until you click Show
Scenario Manager can also create a report that compares all saved scenarios side by side.
To generate a scenario report:
Inside Scenario Manager, click Summary
In Scenario Summary, choose Scenario Summary
In Result cells, select B7 (your profit cell)
Click OK
Excel generates a summary table on a new sheet showing all three scenarios side by side
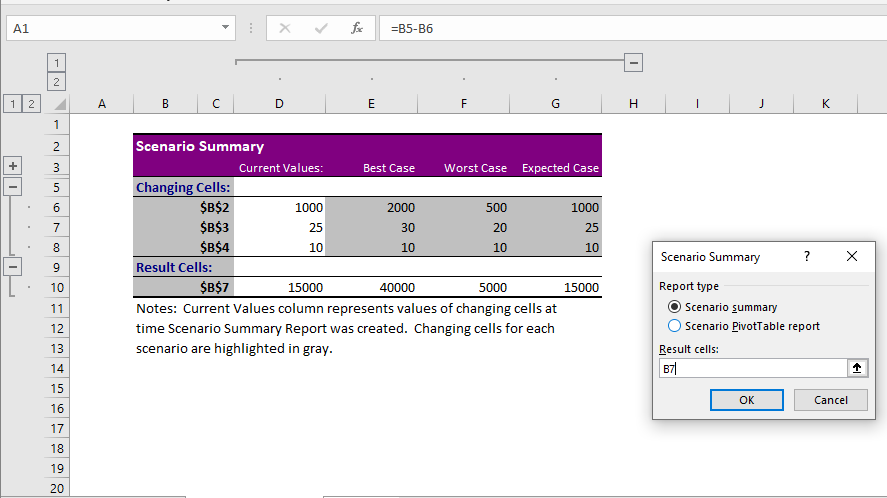
Generate a scenario summary report. Image by Author.
Data Tables automate repeated calculations across a range of input values. Instead of changing an input manually, recording the output, and repeating, you define the range once, and Excel fills in every result at once.
You give it three things:
A One-Variable Data Table tests how changing one input affects a formula result.
For example, you have a loan payment formula and want to see how the monthly payment changes at interest rates from 5% to 10%.
To create a One-Variable Data Table:
E1, directly above your first rate, not next to the column header, I enter =B5. If E1 is left blank, or the formula reference goes in a different cell, the data table will run but return all zeros instead of payment values.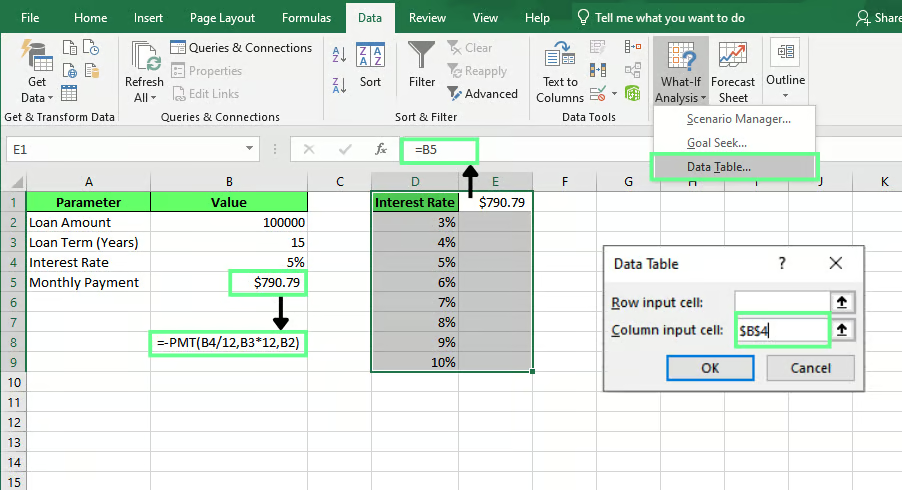
Create a One-Variable Data Table. Image by Author.
Next, select the full range D1:E9 (including E1)
Go to Data > What-If Analysis > Data Table
Leave the Row input cell blank
In the Column input cell, select B4 (interest rate)
Click OK.
Excel fills the table with the calculated results for each input value. Notice how the payment doesn't increase evenly. The jump from 3% to 4% is $49, but from 9% to 10% it's $61. Interest rate changes hit harder the higher they go.
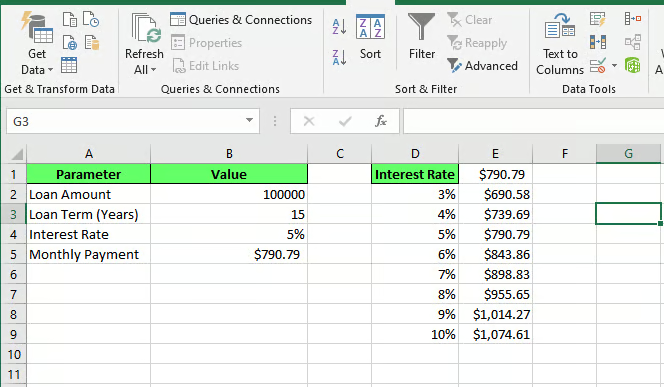
Calculated results for each input value. Image by Author.
A two-variable data table tests how changing two inputs at the same time affects a formula result.
For example, a pricing model might depend on both product price and units sold. A two-variable data table can show profit across different price points and sales volumes in one view.
First, set up the dataset.
Look at the dataset I am using:
In cell D1, enter =B5. This is the formula reference, and it must go in the top-left corner of the grid, not next to a label
Across row 1, starting from E1, list the units sold values you want to test: 500, 1000, 1500, 2000
Down column D, starting from D2, list the price points you want to test: $20, $25, $30, $35
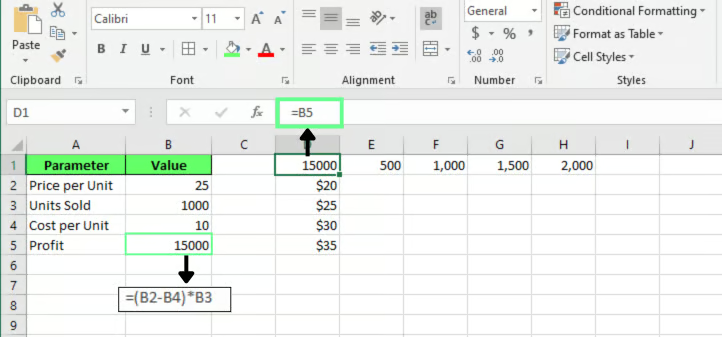
Set up a dataset for Two-Variable Data Table. Image by Author.
To create a Two-Variable Data Table:
Select the full range D1:H5.
Go to Data > What-If Analysis > Data Table
In the Row input cell, select B3 (units sold)
In the Column input cell, select B2 (price per unit)
Click OK.
Excel fills in the profit for every price and units sold combination
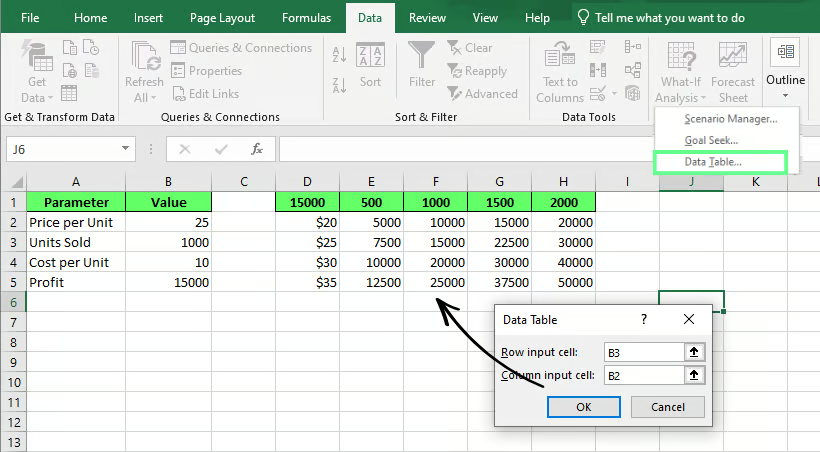
Calculated results for input value. Image by Author.
Two-Variable Data Tables are especially helpful when one assumption alone does not tell the full story. Price might look good on its own, but profit also depends on how many units customers actually buy. That second variable is where the model gets more useful.
Goal Seek, Scenario Manager, and Data Tables all belong to Excel's What-If Analysis toolkit, but they solve different problems.
Here is a quick comparison between them
|
Goal Seek |
Scenario Manager |
Data Tables |
|
|
Definition |
Finds the input value needed to achieve a specific result in a formula |
Stores multiple sets of input values as named scenarios and lets you switch between them |
Calculates a formula's result across a range of input values automatically |
|
Question it answers |
What input gets me this result? |
How do these situations compare? |
How does this change across a range? |
|
Solves for |
One target outcome |
Multiple assumption sets |
A range of values |
|
Number of Inputs |
One |
Multiple |
One or two |
|
Output |
Single value |
Side-by-side comparison |
Full grid of results |
|
Use it when |
You know the target, not the input |
You want to store and switch between named cases |
You want to see many outcomes at once, not just one |
What-If Analysis and Solver both help us explore different outcomes in Excel, but they solve different types of problems.
For example, a loan applicant might use Goal Seek to determine the loan amount that results in a $500 monthly payment. But a manufacturing company might use Solver to determine the production mix that generates the highest profit while staying within labor and material limits.
Note: Solver isn't part of the standard What-If Analysis tools. It's a separate add-in. On most versions of Excel, you'll need to turn it on manually in Excel Options before it shows up on the Data tab.
Here are some best practices to follow when working with What-If analysis:
Store input values in dedicated cells and reference those cells in your formulas. Avoid hardcoding numbers directly into calculations.
For example, this formula is difficult to update:
=(50*1000)-10000But this version is much easier to maintain:
=(B2*B3)-B4When assumptions change, you only update the input cells rather than edit formulas throughout the workbook.
Scenario names should immediately tell readers what they represent. "Scenario 1," "Scenario 2," and "Scenario 3" tell you nothing six months from now. Name them for what they actually represent, such as "Best Case: 15% Growth."
What-If Analysis is only as reliable as the inputs being tested. Before running an analysis, check that:
A revenue forecast based on a 500% sales increase might be technically correct but still useless for decision-making.
A model that makes sense to you today won't necessarily make sense to you or anyone else in three months.
A short note next to each assumption, even just "based on Q3 actuals," saves a lot of guessing later. Documenting them helps others understand where the numbers came from and makes future updates much easier.
Most What-If Analysis issues come from worksheet setup rather than the tools themselves. If Goal Seek, Scenario Manager, or Data Tables produce unexpected results, then check a few common problem areas; it usually solves the issue.
You change an input, and nothing happens. Usually, this means Excel's calculation mode was switched to manual somewhere along the way.
To fix it: go to Formulas > Calculation Options and make sure it's set to Automatic. If it already is, press F9 to force a recalculation.
What-If Analysis tools depend on accurate cell references. If the wrong cells are selected, the results will be incorrect even though Excel completes the calculation successfully.
For example, Goal Seek may change the wrong input cell. A Data Table may reference the wrong row or column input cell. Scenario Manager may store values for the wrong cells.
To fix it: Review your input cells before running the analysis, double-check what's selected in each tool's dialog box, and use descriptive labels so it's obvious what each cell actually represents.
Many users expect Goal Seek to solve problems involving multiple changing variables. It can’t. Goal Seek only changes one input cell at a time to reach a target value.
For example, Goal Seek can determine the sales volume needed to generate $15,000 profit. It can’t simultaneously adjust sales volume, price, and costs to reach that target.
To fix it: Use Goal Seek when only one variable needs to change.Use Scenario Manager or Solver when multiple variables are involved.
Scenario Manager technically allows up to 32 changing cells per scenario, but just because you can doesn't mean you should.
Past four or five variables, scenarios get hard to compare and even harder to explain to someone else. If your model needs that many moving parts, it's probably time to restructure it rather than cram it all into one scenario.
Every spreadsheet has assumptions in it somewhere. It could be a growth rate, a price, or an interest rate.
What-If Analysis doesn't remove those assumptions. It shows you what happens if they turn out wrong, which is most of what good decision-making really comes down to.
If you're new to this, don't start with a model that has five variables and three nested scenarios. Build something small first, like one input, one output, one Goal Seek, and get to know how the input and the result move together. The complex stuff can come later, once the basics make sense.
Learn Excel with DataCamp
Course
Course
Course
blog
Laiba Siddiqui
5 min
blog
Laiba Siddiqui
11 min
Tutorial
Arunn Thevapalan
Tutorial
Javier Canales Luna
Tutorial
Laiba Siddiqui
Tutorial
Jess Ahmet