Data processing, analysis, and visualizations were done using R and its corresponding packages. Notebook and pertinent files used can be found here.
According to the Merriam-Webster dictionary, data is factual information used as a basis for reasoning, discussion, or calculation. By this definition, data is basically any piece of collected information that can be used and further processed and analyzed to gain insights. It is commonly associated with computers as data is normally produced and stored in a computer, yet data has been around much longer than we might imagine.
History of Data
The earliest example of humans storing and analyzing data dates back to 18000 BCE, when it was discovered that prehistoric humans were using tally sticks, as a means of carrying out rudimentary calculations. These Paleolithic tribespeople marked notches on sticks and bones to keep track of their activities, such as trading and monitoring supplies. By 2400 BCE, the abacus, a device used in performing calculations, was invented in Babylon.
Throughout history, constant development of data collection, processing, and analysis was seen through numerous writings in stone tablets, clay, papyrus, wood, and paper scrolls. Eventually, as more forms of data were discovered, the need for processing, collecting, storing, and analyzing it also evolved.
As human society became more advanced, so did its requirement for processing data. In the 1800s, the census started taking place in the United States. The number of data points in the census grew exponentially to the point that the U.S. Census Bureau estimated that it would take years or even decades to collect and analyze all the data in the census. This was largely problematic since compiling and analyzing the current census data would only be completed when the next census was about to start or had already started. Fortunately, a young engineer and inventor named Herman Hollerith developed the Hollerith Tabulating Machine–an electromechanical tabulating machine which reduced the time needed to collect and analyze census data from years, to just mere months. Because of this, Hollerith is regarded as the father of modern automatic computation and would later become known for founding IBM.
Fast forward to the 1900s, and the invention of the computer. With the advent of a more powerful computing machine comes a more sophisticated requirement for data storage. Fritz Pfleumer, a German-Austrian engineer, invented a method of storing information magnetically on tape. Some principles of his invention are still being used today for digital data storage. In this era, the term “business intelligence” gained popularity as the need for emerging software, and systems for analyzing commercial and operational performance, quickly rose.
The revolution of data truly changed when Tim Berners-Lee created the World Wide Web, also known as the Internet, in 1989. This led to automated information sharing between people all over the world. This means that today more data is being shared, created, and stored, leading to new ways for collecting, using, and analyzing data.
Transition to “Big Data”
Due to the incredible amount of internet growth in the 1990s and the steady development of personal computers and computing devices in general, the number of devices online (and consequently the amount of data created) grew quickly.
While the idea of Big Data had been around even before the 1990s, it was only in 2005 when Roger Mougalas officially gave it a label. He described it as “a large set of data that is almost impossible to manage and process using traditional business intelligence tools.”
Big Data is a term used to describe the large volume of data–both structured and unstructured–that overwhelms organizations on a day-to-day basis. It encompasses the volume of information, the velocity or speed at which it is created and collected, and the variety or scope of the data points being covered.
Given the size and complexity of Big Data, the process of collecting, organizing, and analyzing it to discover patterns and other useful information has become part of helping a lot of organizations to make their business decisions. In turn this has given rise to data science–an interdisciplinary field which uses scientific methods, processes, algorithms, and systems from a large volume of data, to uncover patterns and enable business leaders to draw informed insights.
What Data Science Roles Are There?
According to IBM, data science is a multidisciplinary approach to extracting actionable insights from the large and ever-increasing volumes of data collected and created by today’s organizations. The field typically requires computer science and pure science skills as data scientists apply scientific methods in their approach, and use predictive analytics and artificial intelligence to extract insights from the data. See our full guide on 'what is data science' for a more indepth definition.
Nowadays, “data science” is often used by businesses and organizations as a catch-all term for the process of handling large amounts of data, whether it is preparing, cleaning, analyzing, or visualizing the data to reveal patterns. These are just some of the data science careers one can pursue:
-
Data Scientist
Data scientists need to be able to apply mathematics, statistics, and the scientific method; use multiple tools and techniques for cleaning and preparing data; perform predictive analytics and artificial intelligence; and explain how these results can be used to provide data-driven solutions to business problems. They require much more technical skills than data analysts. For starters, you may take data science-oriented courses like these on DataCamp: Introduction to Python for Data Science and Introduction to R.
-
Data Analyst
Data analysts collect, process, and perform statistical data analyses to arrive at meaningful conclusions for organizations. They transform and manipulate large data sets into usable forms, such as reports or presentations. They also aid in the decision-making process by looking into important patterns, and gleaning insights from the data which they can then effectively communicate to organizational leaders to aid in business decisions. These courses on DataCamp may help you kick-start your data analyst career: Introduction to SQL and Exploratory Data Analysis in SQL.
-
Data Engineer
Data engineers are responsible for preparation, processing, and managing gathered and stored data for analytical or operational uses. Like the traditional engineers, data engineers build and maintain data “pipelines” which connect data from one system to another, making information accessible for data scientists. Because of this, data engineers are required to understand several programming languages used in data science such as Python, R, and SQL. Topics related to data engineering like these are available on DataCamp: Introduction to Data Engineering and Understanding Data Engineering.
-
Data Architect
Data architects mainly design and create blueprints for data management systems that data engineers then build. Analogous to the traditional architects, data architects are the “visionaries” as they are responsible for visualizing and designing an organization’s data management framework. In addition, data architects improve the performance of existing systems, making sure they are accessible to database administrators and analysts. You may take courses related to data architecture like these that are available on DataCamp: AWS Cloud Concepts and Database Design
-
Business Intelligence (BI) Developer
BI developers are specialized engineers who use software tools to transform data into useful insights that help business decisions. They are responsible for simplifying technical information for everyone else in the company to easily understand. In short, they create and run reports containing data they find using business intelligence tools, and transform the information into more layman terms. Courses on using tools related to business intelligence such as Microsoft Power BI and Tableau are available on DataCamp such as these: Introduction to Power BI and Analyzing Data in Tableau
-
Statistician
Given that statistics is one of the main foundations of data science, many statisticians can easily transition into the data science field. Statisticians are mainly responsible for the collection and handling of data. They decide what data they need and how to collect it. Additionally, they design experiments, analyze and interpret the data, and report conclusions. You may check-out these introductory courses to statistics on DataCamp: Introduction to Statistical Modeling in R and Introduction to Statistics in Spreadsheets.
-
Machine Learning Engineer
Machine learning engineers are another group of specialized engineers who are focused on researching, building, and designing artificial intelligence (AI) and machine learning (ML) systems to automate predictive models. Basically, they develop algorithms that use input data and leverage statistical models to predict an output, while continuously updating outputs as new data becomes available. DataCamp has numerous courses related to machine learning which you may find useful such as these: Understanding Machine Learning and Machine Learning with caret in R.
A quick job search online can give you an idea as to which of the data science career paths listed above is the most in demand. The graph below shows the job openings per career path according to Indeed USA as of December 8, 2021.
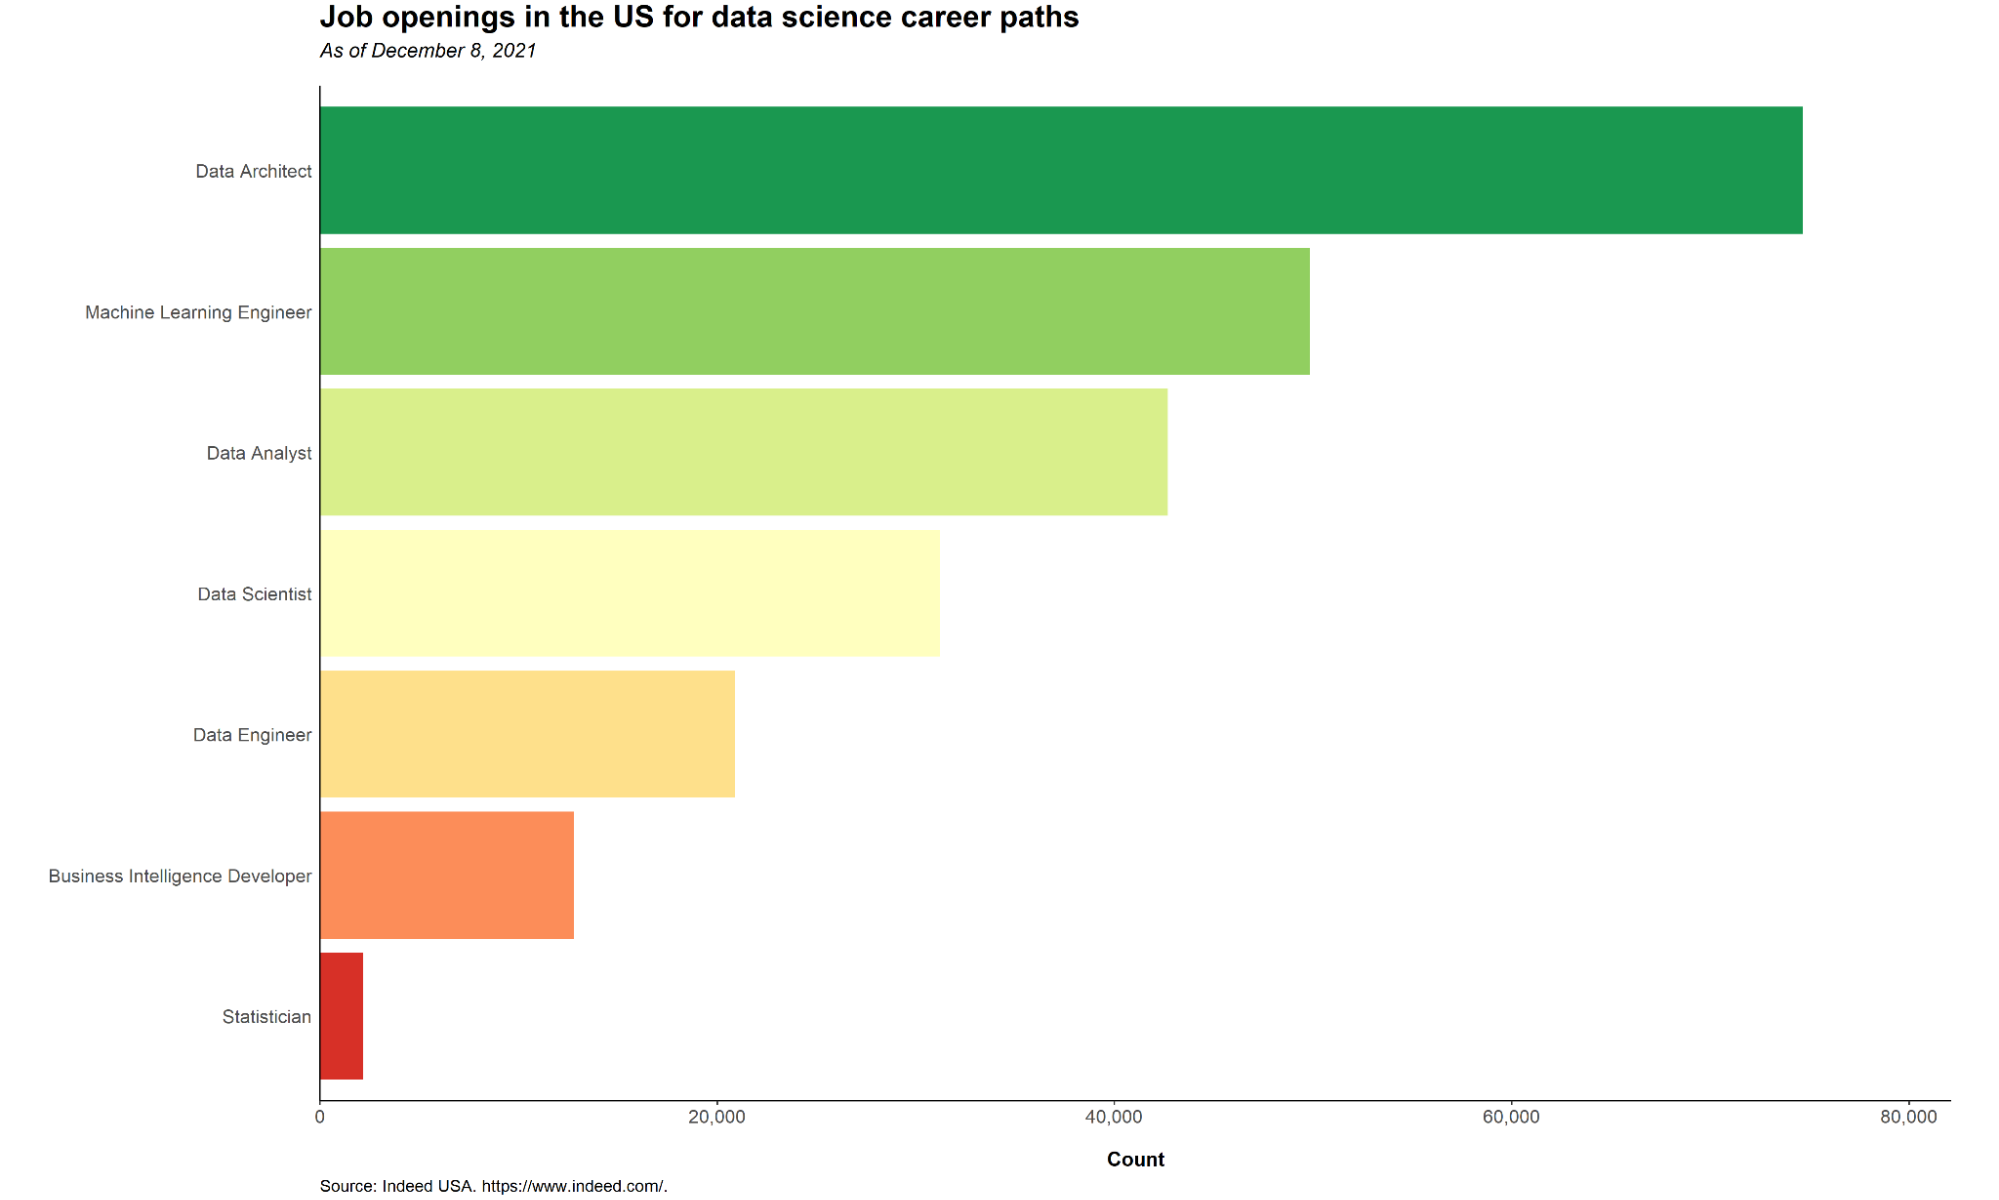
Data architect appears to be the most in demand data science career path, due to their importance in creating data management systems which the other data science professionals then use. Next on the list is machine learning engineer, given the importance of utilizing artificial intelligence to predict outcomes in a lot of tech companies.
The least in demand are statisticians, mainly because a lot of the traditional statisticians are now becoming data scientists. This trend is expected to continue given how easy it is for statisticians to move from pure statistics to data science as they already possess the fundamental knowledge needed to become a fully-fledged data scientist.
Data science is not slowing down
The field of data science rose to immense popularity in the 2010s, especially when “Data Scientist” was touted by Harvard Business Review as the “sexiest job of the 21st century.” It became so popular that the title “Data Scientist” became a ubiquitous and trendy expression. While the term “sexiest job” does sound ridiculous at first, it mostly refers to how data scientists are not only in demand, but are also expensive to hire and difficult to retain.
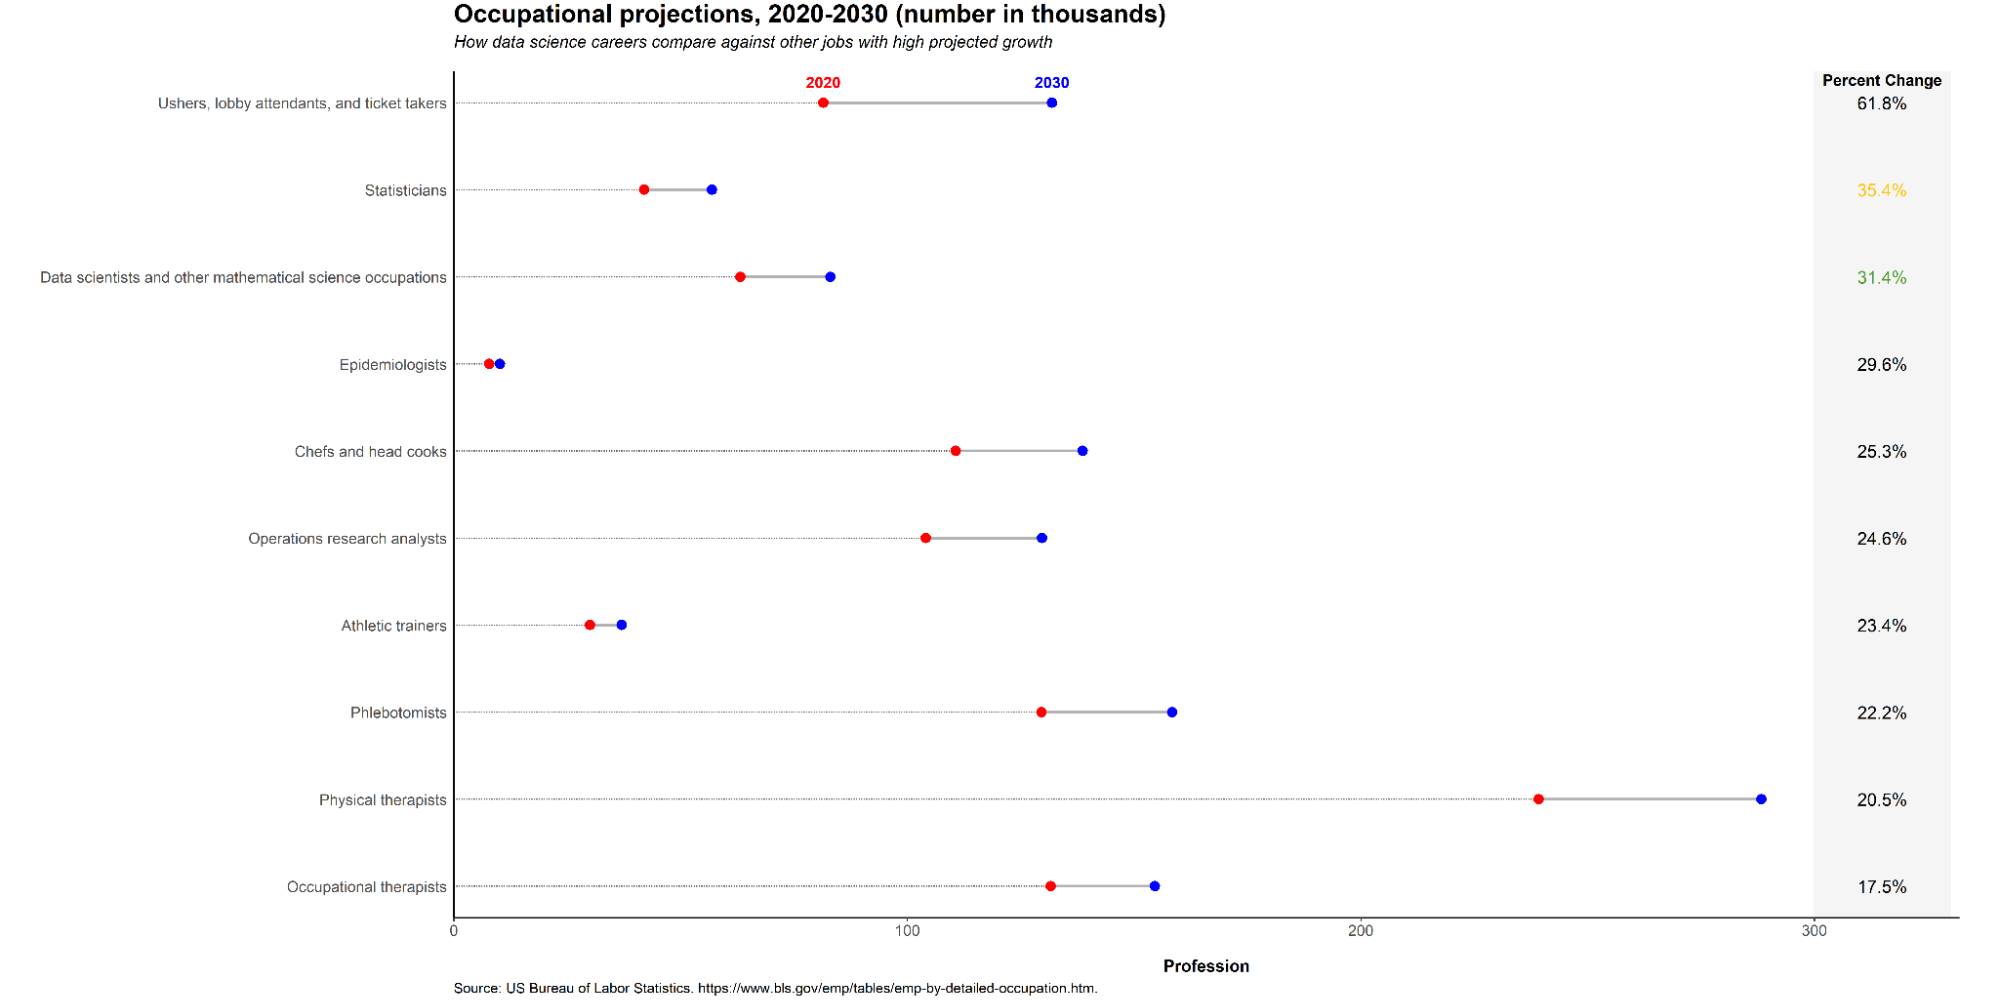
While there is no question that data science is extremely popular nowadays, the better question is, will it remain this popular in the future? Based on employment projections, that does seem to be the case. Data from the 2020-2030 Employment Projections of the U.S. Bureau of Labor Statistics shows that data science careers, which include statistics, data science, and other mathematical and science based occupations such as data engineering, will exhibit a very high growth rate in terms of percent change from 2020 to 2030. Statisticians ranked 14th overall, while data scientists and other mathematical science occupations ranked 31st overall out of 790 jobs included in the data.
While the shares of statisticians and data scientists from the total labor force are small compared to other occupations, those numbers are expected to increase in following years as the data science career path becomes more and more popular. The figure below shows how statisticians, data scientists, and other mathematical science occupations stack up against other jobs with high projected growth.
A really expensive field
One major reason why data science is popular is because it is one of the highest paying jobs in the world. The figure below shows the range of salaries for 10 different occupations–including data scientists and data analysts–in New York City. The data was obtained from Teleport, a website which aggregates data on living conditions (e.g., salaries) in different cities.
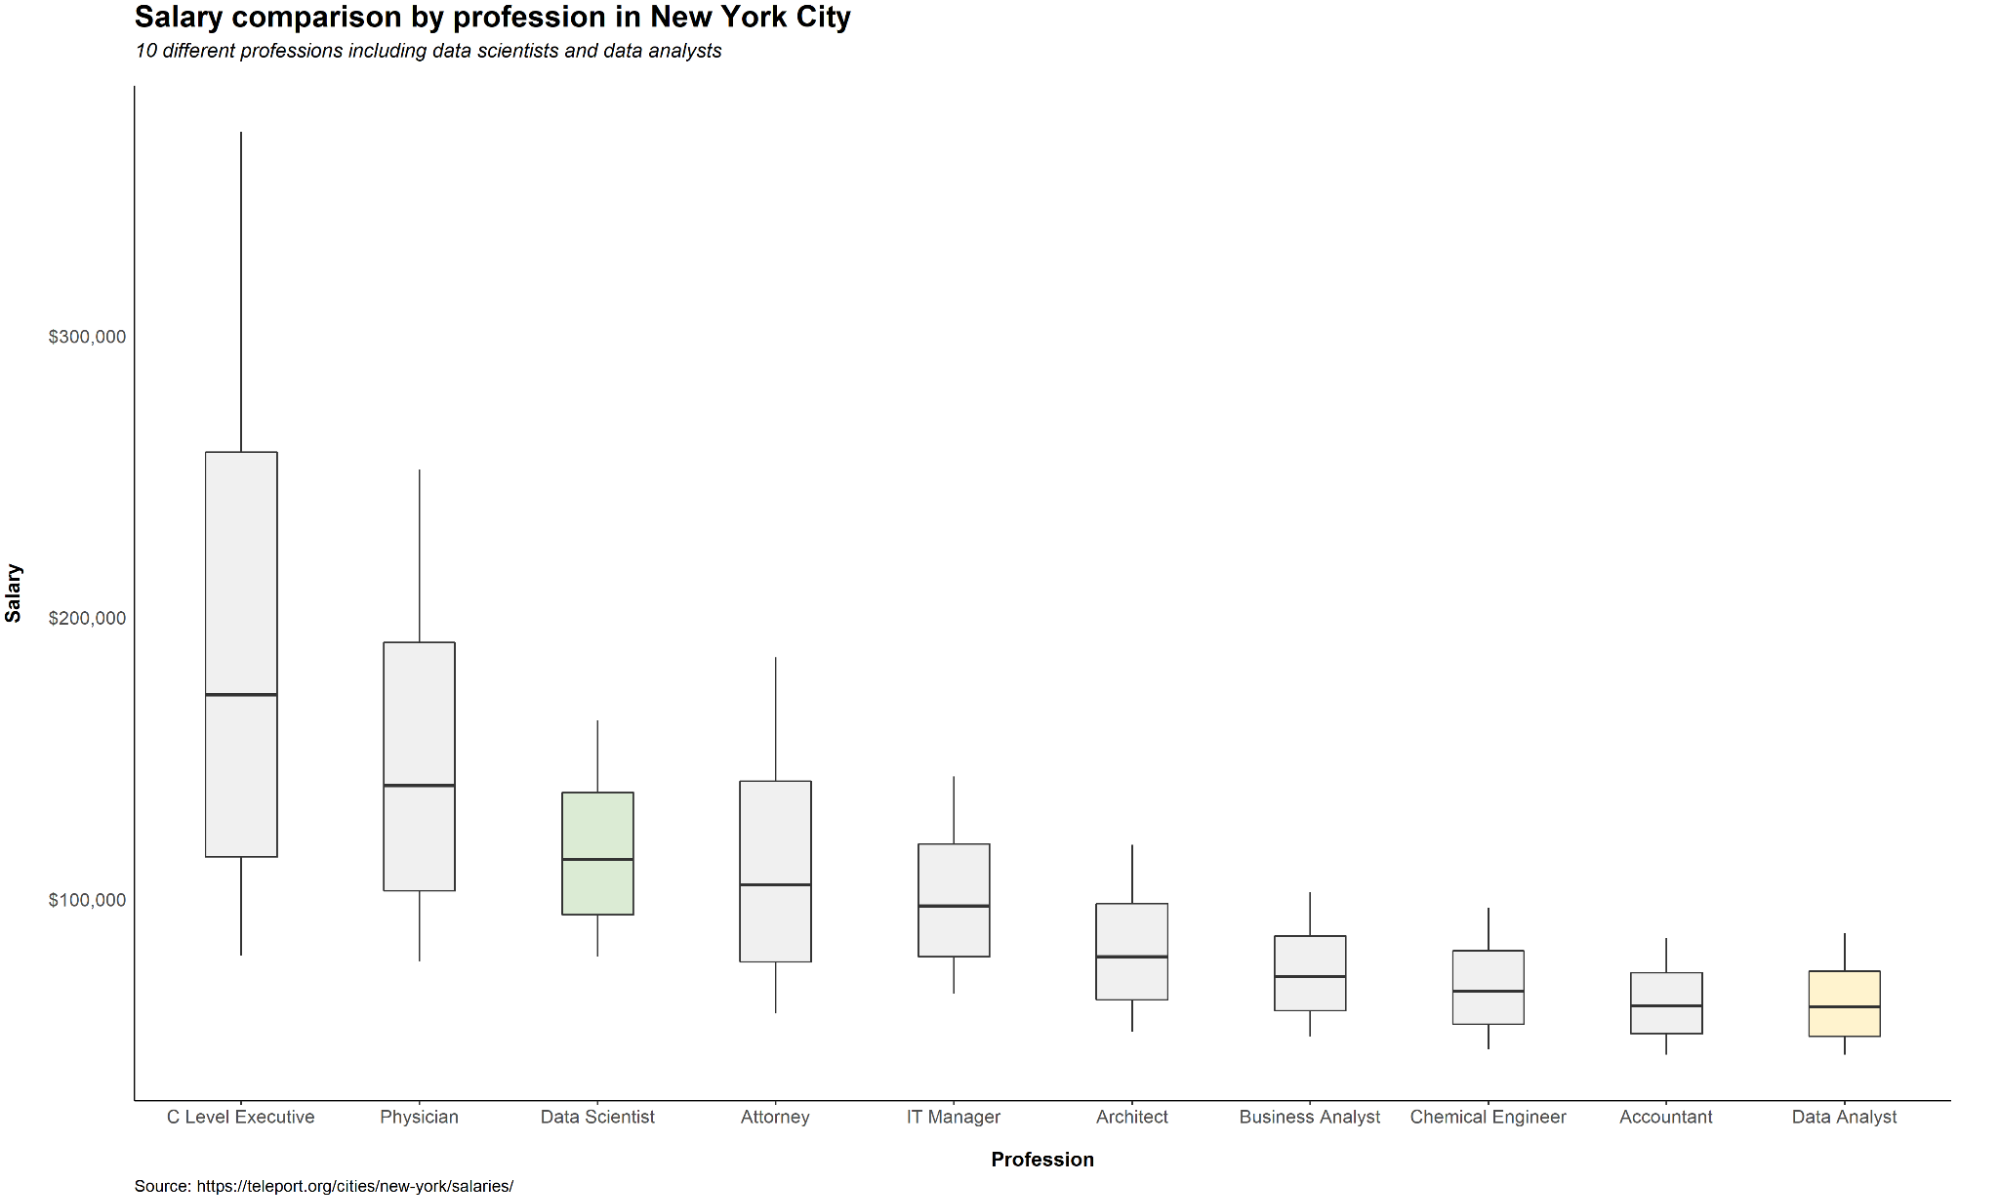
According to Teleport, data scientists had the 4th highest annual median salary in New York City at \$114,105, just behind C Level Executives and healthcare workers. In fact, in some other cities like Manila, data scientists rank as high as 2nd highest, just behind C Level Executives. This speaks volume as to how lucrative this job is. Data analyst jobs, whilst not as lucrative as data science positions, are still not to be slighted. At an annual median salary of $61,818, data analysts still earn around the average household income in New York City.
Ever growing in the job market
Another major reason why data science is popular is because of how organizations these days integrate the principles of data science in their day-to-day operations. The graph below shows the top 10 industries that involve data science in their work. The sample data of 8,000 data science oriented companies are extracted from Diffbot, the world’s largest knowledge graph.
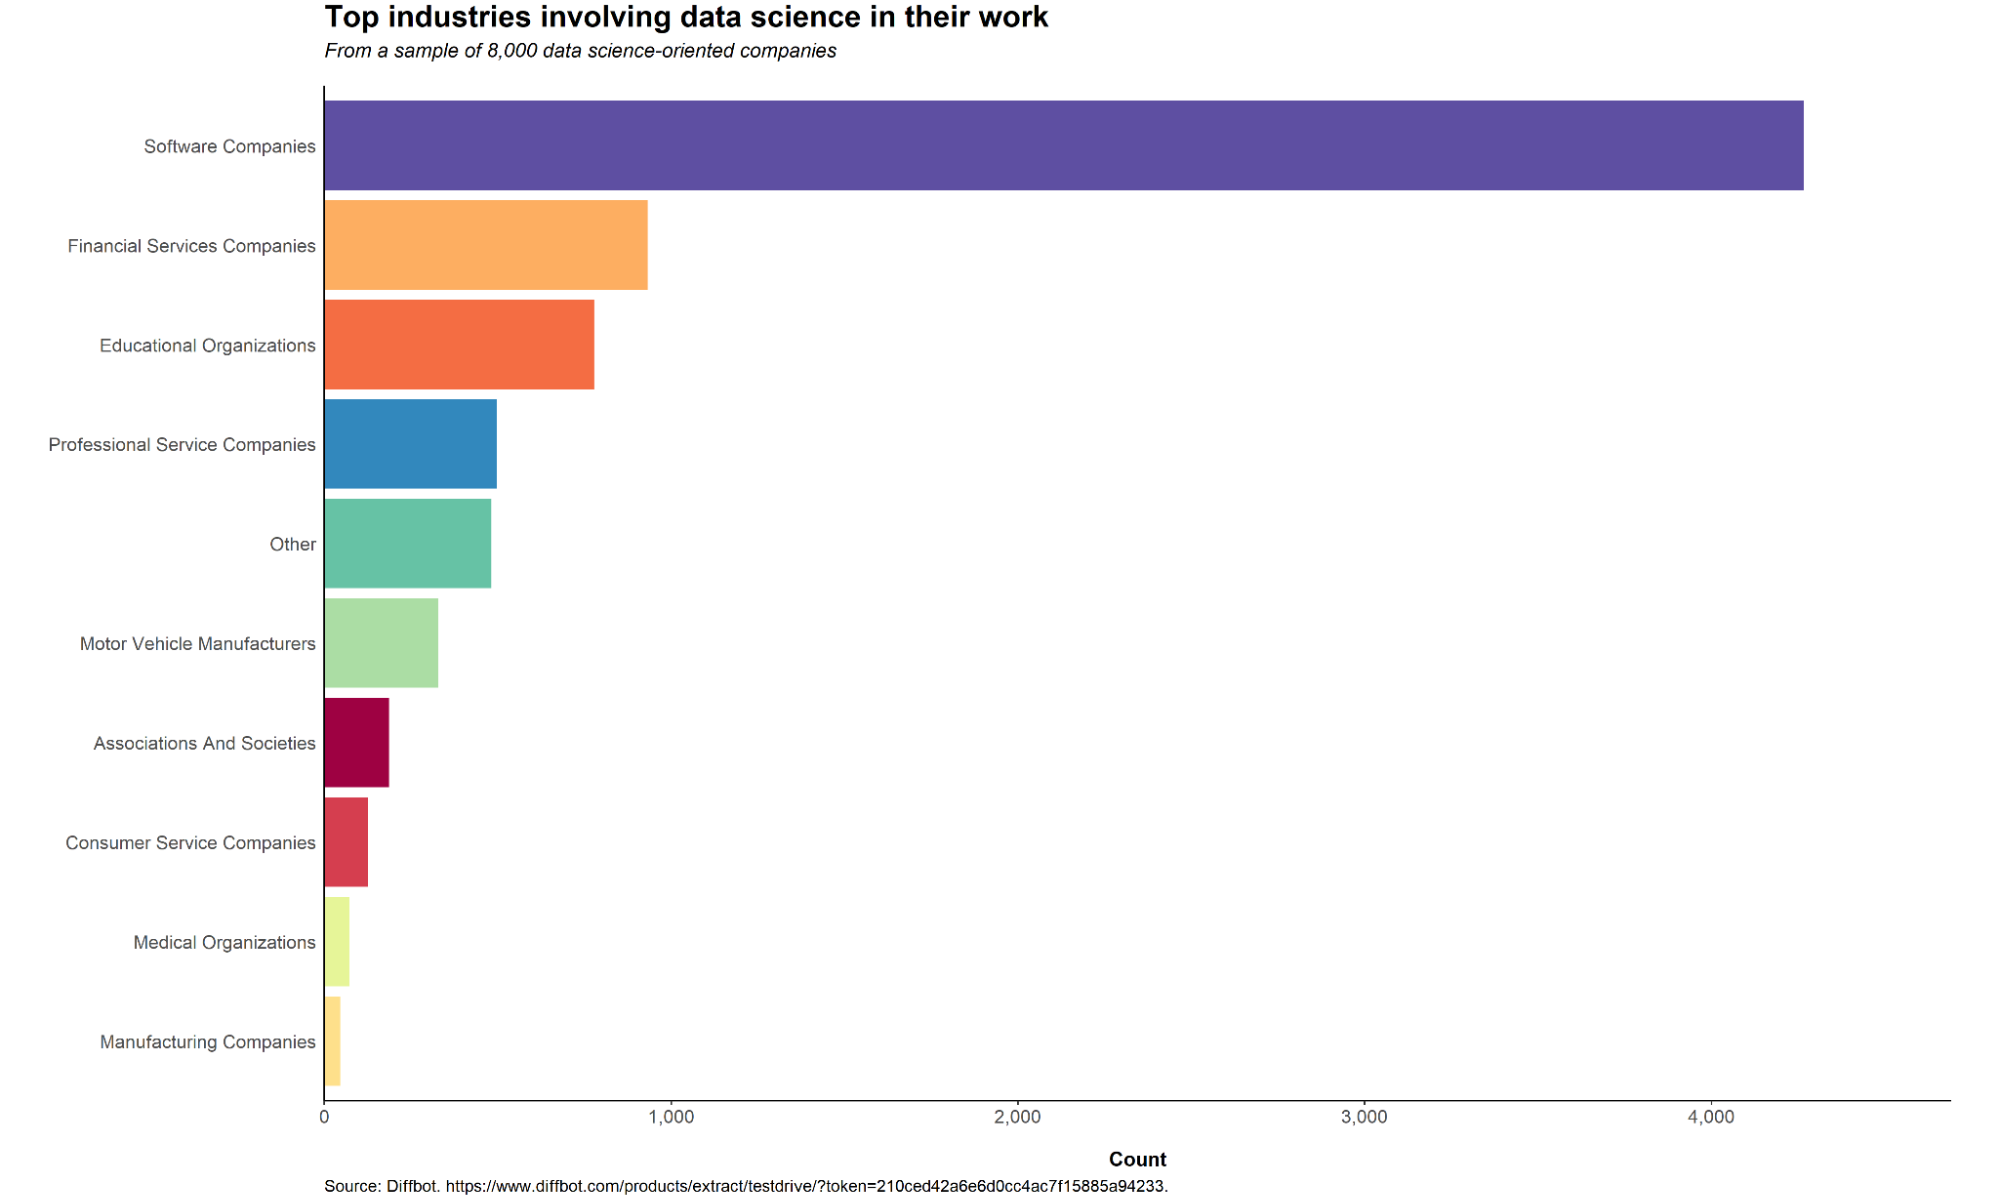
It comes to no surprise that Software Companies–including tech companies like Google, Apple, and Uber–came out on top. After all, the exceptional growth of big data was caused by the creation of the internet, which is closely tied to software and technology. Data science really is about processing a lot of information using various tools and technology.
Next on the list are financial services companies, which has been brought about by the rise of fintech companies. A portmanteau of “finance” and “technology,” fintech companies integrate technology and innovation in their services and offerings to improve their delivery to customers and disrupt traditional financial services. Since it involves handling a vast amount of data such as customer information, financial services companies saw the potential of data science tools to help streamline and optimize their processes and improve their services.
In conclusion, is it worth pursuing a career in data science?
With everything that has been explained above, the answer is a definite yes! As to which specific data science career path you should pursue, this depends primarily on your individual strengths and general interests. What is important is that any of the careers mentioned above are sure to be worthwhile.
A career path which is very lucrative and appears to show no signs of slowing down in terms of popularity, data science will continue to shape and influence how businesses and organizations operate for many years to come.