Build your data portfolio
Showcase your skills and projects in minutes.
How to Use DataCamp Workspace to Create a Portfolio
DataCamp Workspace is a tool that has been developed with portfolios in mind. Here are some steps that you can use to leverage Workspace to create a portfolio that will get you hired.
Create a new workspace
You can create an empty workspace from the Workspace dashboard or use one of our curated datasets. Workspaces can be created in either Python or R, and both have the ability to connect to SQL databases. If you don’t have access to a SQL database, Workspace has several sample databases for you to start from now offers the ability to query DataFrames and CSVs.
Begin your project
Time to start your project! Be mindful that your project helps meet the criteria in the section above and reflects your skills, interests, and abilities. In a later article, we will go into greater depth on creating a portfolio project in Workspace, but here are some general tips to get the most out of Workspace.
- Where it makes sense, include text cells to guide readers through the project.
- Ensure your code is easy to read and contains code comments that explain your process if it’s not obvious.
- Spruce up your workspace by including images, such as a header at the top of the project.
- Make use of our no-code chart cells to effortlessly create visually-appealing interactive visualizations.
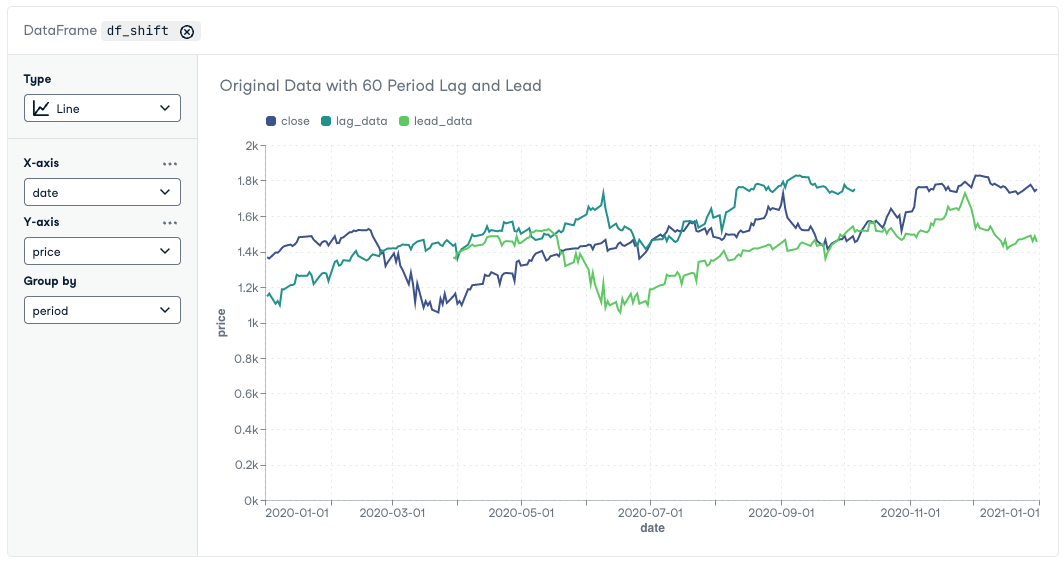
A chart rendered with a Workspace Chart Cell (link to image)
Tidy Up Your Workspace
Edit and proofread your work
Correct typos, ensure plots are clearly labeled, and ensure your workspace is aesthetically pleasing. You may want a friend or colleague to help you out. Another pair of eyes will often catch things that you miss.
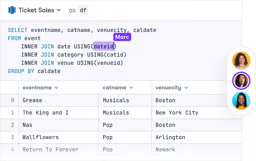
Alternatively, you can take advantage of the AI features inside Workspace to proofread your written work. Below, we have used the “Generate” button on a text cell to catch all of the typos in the cell.
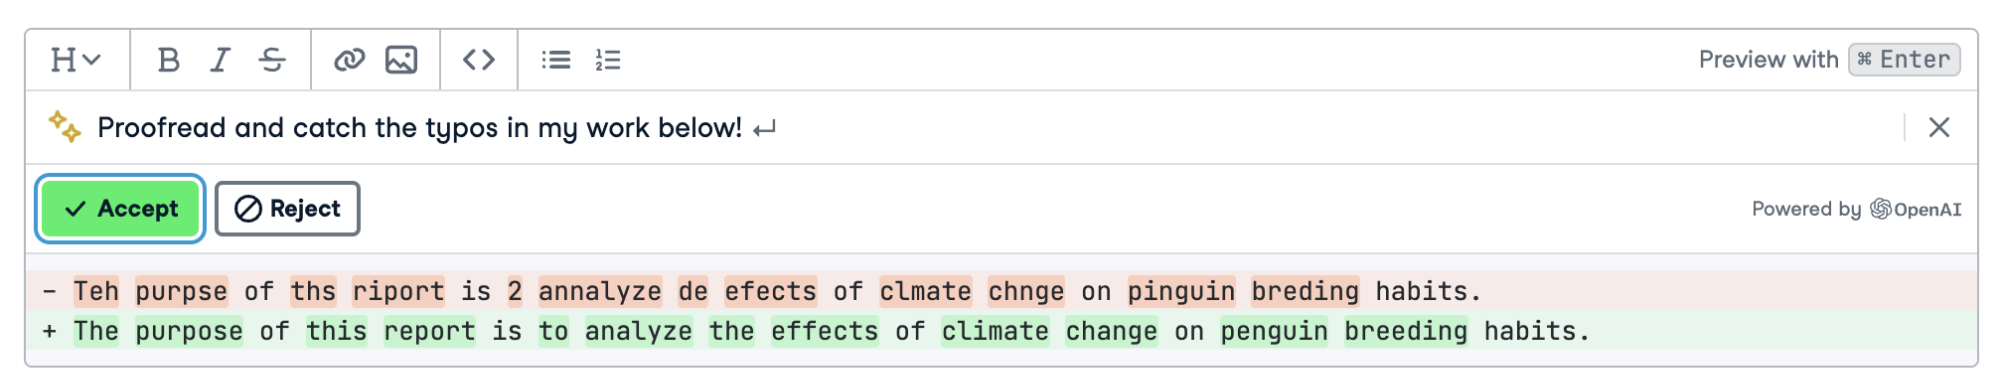
The generate text function in action! (link to image)
Format your written content
Workspace offers a wide range of text formatting tools, which allows you to do things such as add titles, headings, and lists. Headings will also generate a table of contents in your published report, allowing readers to navigate the project easily.
Hide code cells and output that aren’t integral to the report
In some cases, you may be targeting a non-technical audience. In this case, lengthy blocks of code may interrupt the flow of the report. Fortunately, with Workspace, you can use the “Hide code” and “Hide output” buttons to hide these sections in your final report. Hiding output can also be useful when you install additional packages.
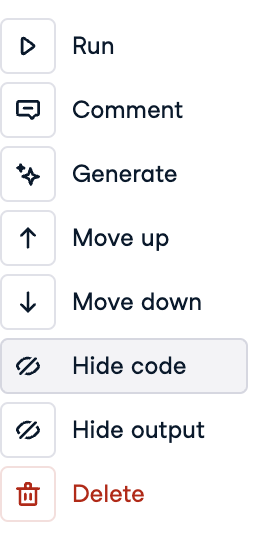
Hide code and Hide output options on a Workspace code cell
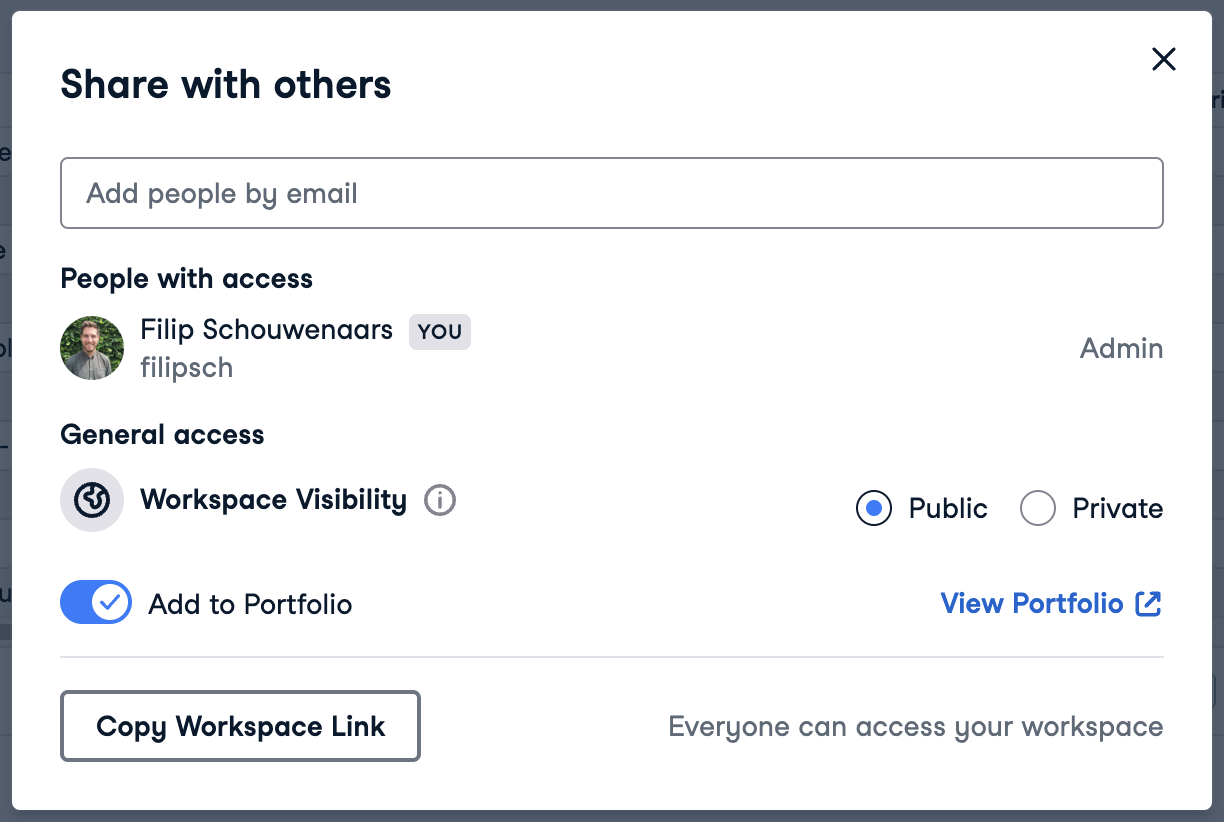
Add the workspace to your DataCamp Portfolio
Once you're ready to show your work to the world, adding the workspace to your portfolio is easy.
In the editor, click on "Share" and enable the "Add to portfolio" toggle.
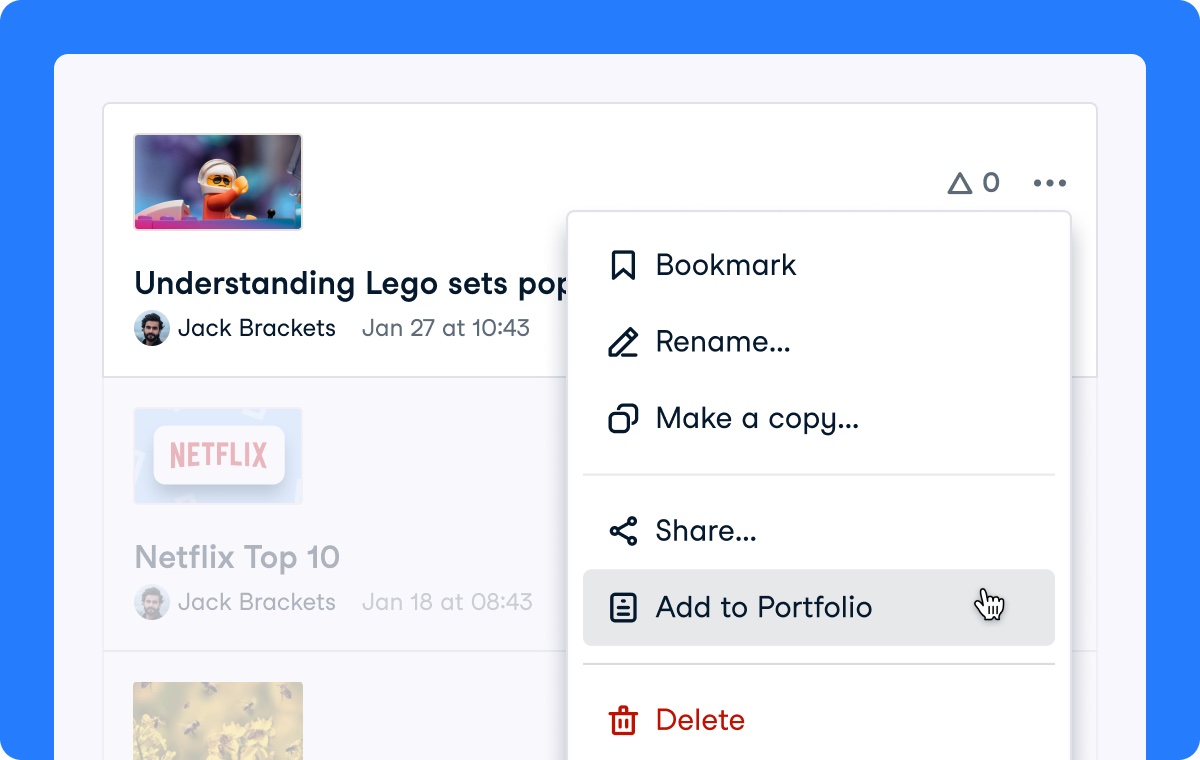
You can also add a workspace through the dropdown in your workspace overview.
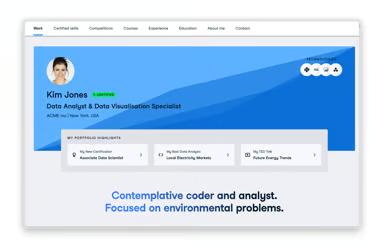
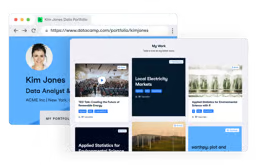
Your workspace is now available on your very own DataCamp portfolio, available for the world to see!
Next steps
In subsequent articles, we will go into greater depth. Find the second part in the series here! We cover topics such as constructing an analytics and machine learning portfolio project. In the meantime, we encourage you to explore DataCamp Competitions. Start by exploring past winning entries. There you can see how users have leveraged Workspace to build award-winning analyses that make for excellent portfolio projects.
After that, why not participate in a competition yourself? It's a great way to practice your data science skills on real-world problems, get feedback from other DataCamp learners, and start building out your own portfolio.
Additional Resources
Still want to know more about creating a great portfolio? Be sure to listen in to this DataFramed podcast where guest and author Nick Singh goes over the characteristics of a great data science portfolio.
You can also check out our recent webinar Tips for Buliding a Data Science Portfolio with DataCamp, including our own Head of DataCamp Workspace Filip Schouwenaars!
DataLab
Skip the installation process and experiment with data science code in your browser with DataLab, DataCamp's AI-powered notebook.