What is big data?
Big data is one of the buzziest words in the data space. But just how big is big? One way to think about it is in terms of volume, or the amount of data you have. Based on volume, we can define big data as data that is far more than you can store on a modern laptop or hard drive. Thus, it needs to be distributed across clusters of computers to work with, transmit, and analyze. We can extend this definition of big data to cover the three Vs: volume, velocity, and variety.
- Volume: The amount of data
- Velocity: How quickly you can move and analyze data
- Variety: The different types of data you have
Is big data the end of theory?
In 2008, Chris Anderson wrote a provocative article in Wired called The End of Theory, The Data Deluge Makes the Scientific Method Obsolete. The premise was that we had enough data to make satisfactory predictions about the world that we didn’t need theory to understand the world. Part of the impetus for such arguments was what we were seeing happen with Google—they were able to operate on huge amounts of data and then provide predictive models in the forms of data products for programmatic ad buying. Moreover, they were able to do so with sufficiently advanced predictive analytics without needing to understand or theorize about the system under study.
This was all about using captured human behavior in order to build better products and services. Google enabled those who wanted to buy an ad to easily purchase one on Google AdWords, and the model behind AdWords didn't rely on any theory behind whether someone would click or not. Google had just enough data to make a “good enough” prediction. Chris Anderson’s provocative hypothesis is that big data contains so much information that we don’t need to model the world anymore, and we don't need to understand the theory behind it or what's actually happening.
Has big data actually fulfilled its promises to us? One way to think about this is modeling it on the Gartner Hype Cycle.
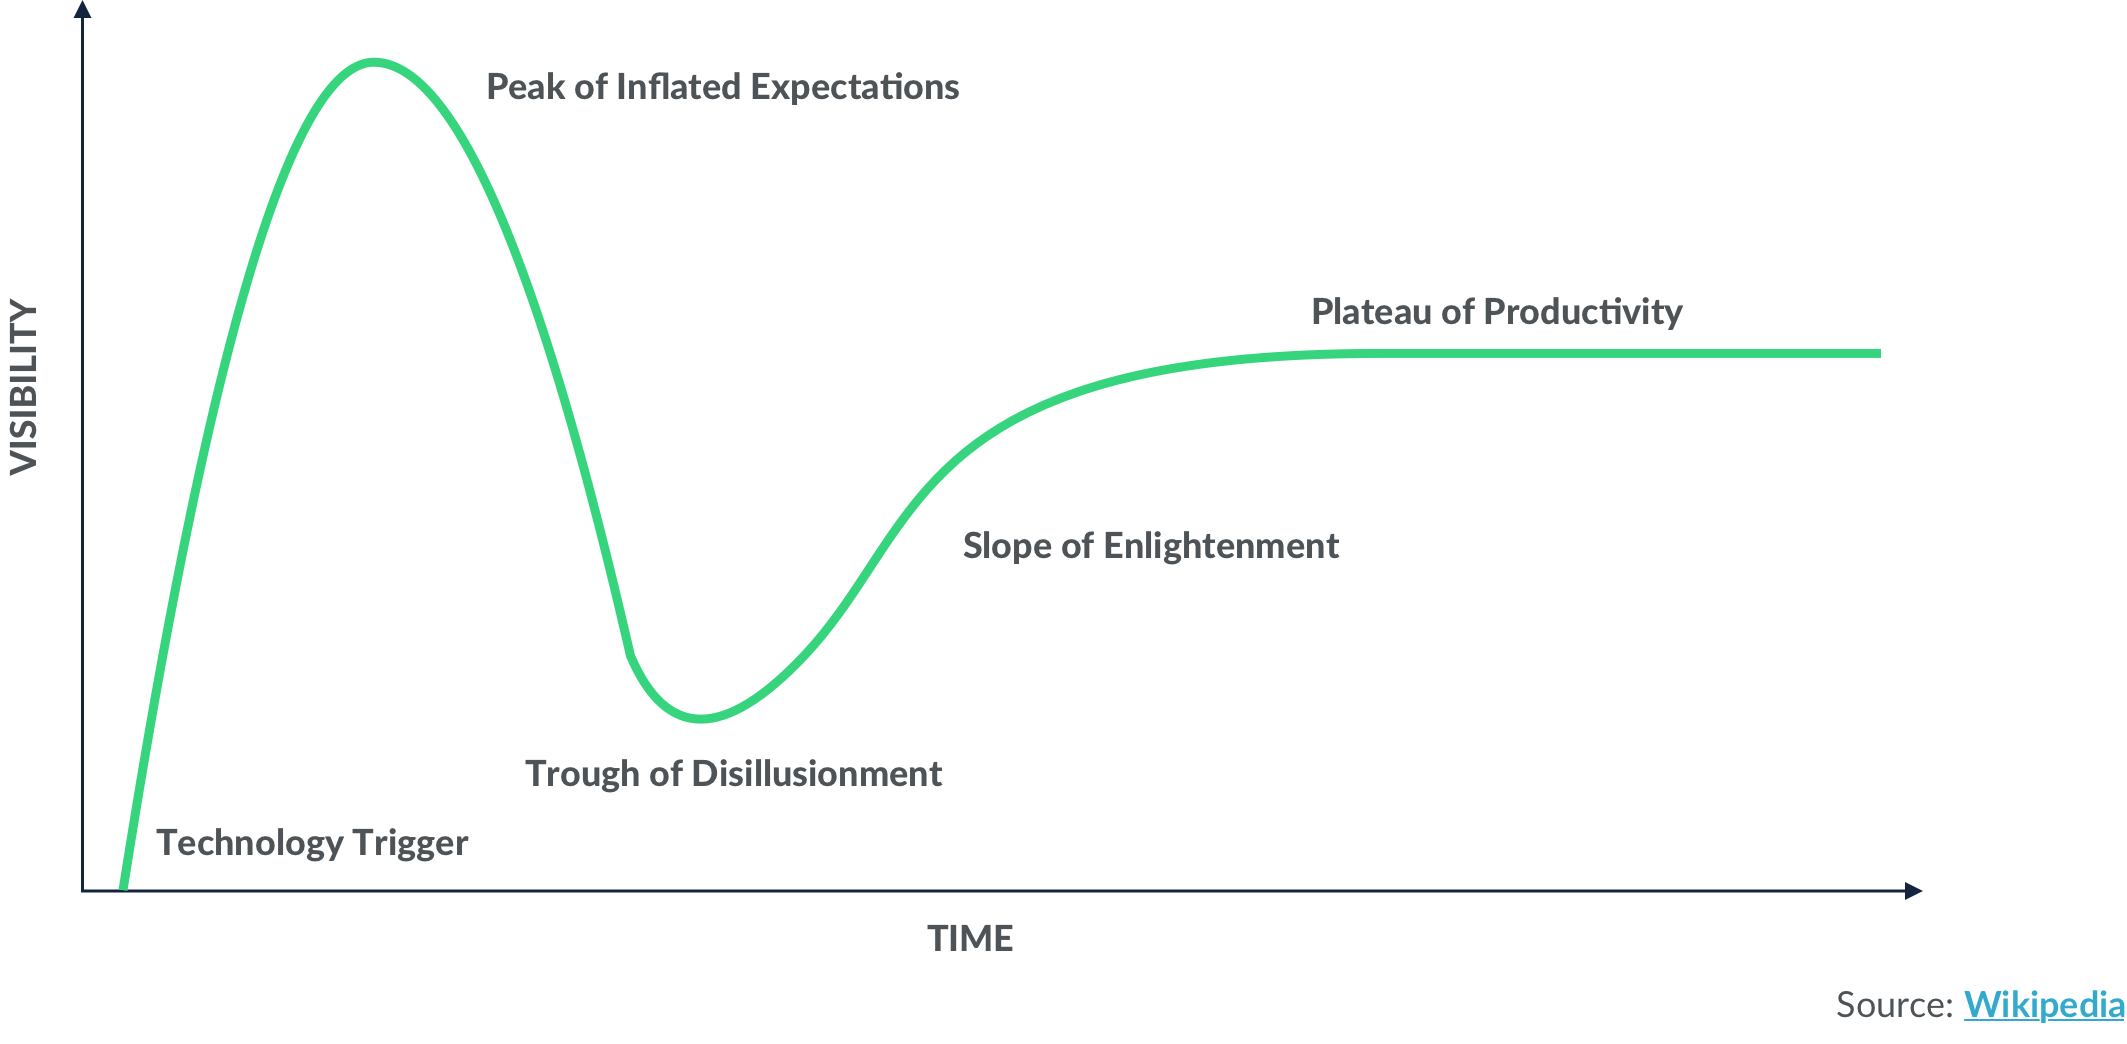
The Gartner Hype Cycle tells us about a technological innovation and the expectations around it as a function of time. We begin with an Innovation Trigger, which in the case of big data was the ability to store, transmit, and analyze large amounts of data. Then people get buzzed about it, leading to Inflated Expectations. After that, we don't see the value delivered against expectations, so we enter the Trough of Disillusionment. Only after this do we see the actual real value start to be delivered across several different verticals—and we enter the Slope of Enlightenment.
Where is big data currently in the Gartner Hype Cycle? One way to think about expectations is to see what people have searched for on Google as a function of time. Below are the Google trends for “big data” since 2004. You can see that Chris Anderson was ahead of his time—but he was wrong about big data being the end of theory due to the importance of small data and thick data.
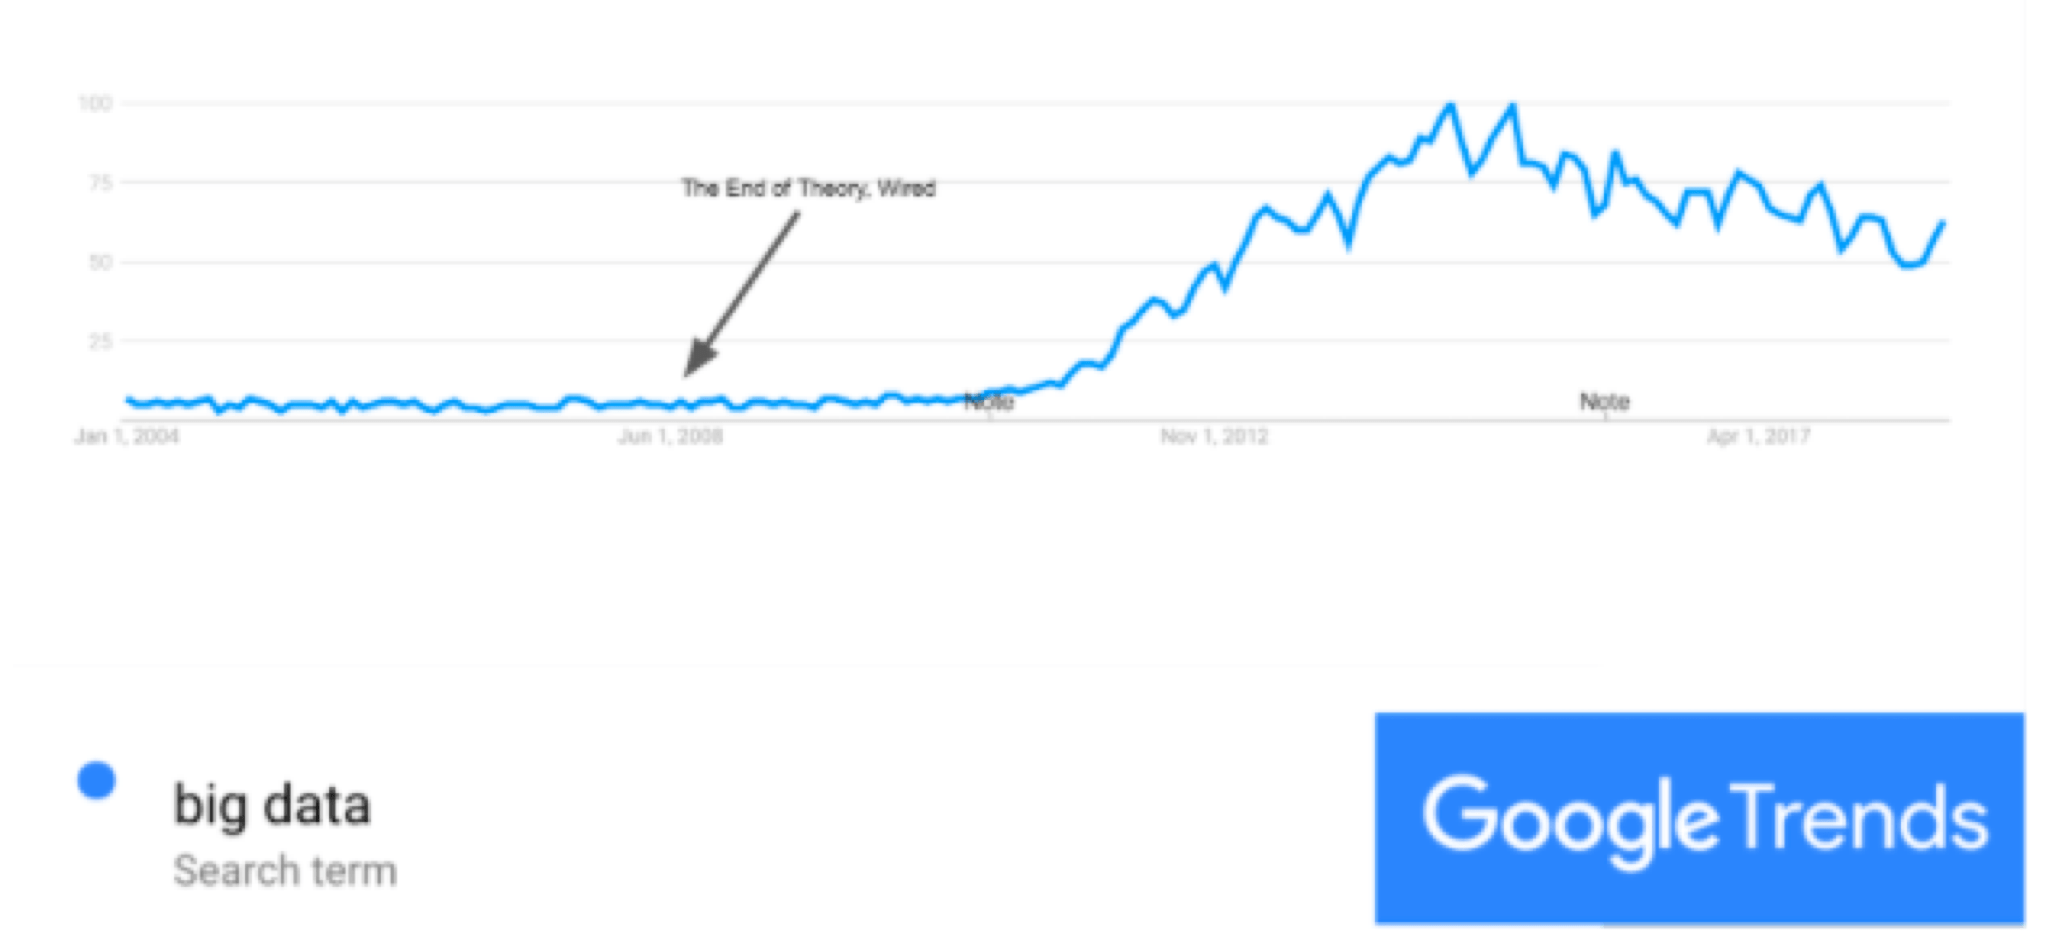
If we accept the Gartner Hype Cycle as a valid model for thinking about big data, and if we accept Google trends as a proxy for expectations, we can see that the Peak of Inflated Expectations was around 2014 and we haven't necessarily reached the Trough of Disillusionment yet.
Small data is also powerful
While a lot of the recent innovations in data science have centered on our ability to efficiently handle increasingly large volumes of data, it’s important to recognize that a vast majority of the data analyzed in the real world does fit in the memory on a modern laptop. As a business leader, you should carefully consider the needs of your data organization before deciding which tools and architectures to adopt.
I want to take you back in time to Johannes Kepler, who discovered three laws of planetary motion, and Tycho Brahe, a Danish astronomer who collected the data that Kepler eventually analyzed to build his three laws of motion, which then informed Newton's theory of gravitation. We have a huge amount of scientific knowledge developed from the data that Brahe collected, which consisted of around just 2,000 data points. This is a tiny dataset compared to datasets we talk about today, which sometimes contain hundreds of millions of data points. But the data Brahe collected was of high quality. If you have good, properly collected data, strong analytical and principled theoretical models, and a way of doing statistical modeling, you can get a huge amount out of your data.

Let’s look at another example explored in Andrew Gelman’s article, How can a poll of only 1,004 Americans represent 260 million people with only a 3 percent margin of error? Gelman takes you through the math to show that when you increase the amount of data, you get seriously diminishing returns on the reduction of the margin of error. Disclaimer: This result is true only if you have some sort of representative sampling of your population, which definitely isn't the case in polls. But statisticians now have sophisticated correction methods for non-representative samples, which they can use to learn about the voting preferences of a larger population.
Again, we see a significant result from a small amount of data, and it tells us about the nature of human behavior and human preferences. The same principle is true of business—it's about understanding and being able to predict future human behavior, especially in terms of your stakeholders. So why do we talk about big data so much when it’s not necessary? A primary reason is that it's readily accessible and so computable these days.
The bottom line is Harvard Business Review’s point in Sometimes “Small Data” Is Enough to Create Smart Products that “it's not about mountains of data, it's about small, high precision data.”
The power of thick data
Now that we’ve discussed the power of small data, I want to move onto another type of data called thick data, or qualitative data. Thin data involves numbers and tables, whereas thick data, a term from sociology and anthropology, is more qualitative and descriptive. A consulting group called ReD Associates has done fantastic work using thick data to help people build analytic models and machine learning models.
One example that I want to mention is their work in detecting credit card fraud. This is a huge challenge and machine learning has been used to detect credit card fraud in the past, using features such as the amount of transaction, the time of transaction, location, and so on. ReD Associates attempted to collect thick data to solve this problem taking a sociological approach.
To do so, ReD Associates sat down with credit card fraudsters to find out what they actually do and what their processes are like. They found a community of credit card fraudsters on the dark web and met them in real life to learn about their processes and habits.
They discovered that the point at which credit card fraudsters have the highest likelihood of getting caught is when they actually have to do something in the real world—like picking up deliveries. They’re tech savvy enough to rarely be detectable online. And fraudsters are also careful in the physical realm—they typically don’t send parcels to their own address, their work address, or their friends’ addresses. Instead, they send deliveries to addresses of properties that are abandoned or on the real estate market.
Equipped with this knowledge, ReD Associates built a credit card fraud detection model using the location that the parcel was being sent to as a feature, and joined that with publicly available data around abandoned houses and houses on the market. They observed that this model based on qualitative data obtained a significant lift in accuracy when compared with more traditional models for fraudulent transactions. This is a wonderful example of the importance of thick data and how taking a sociological approach can provide increased value. I recommend these two articles to explore how good quality data is more important than big data in further detail: The Power of 'Thick' Data and Big Data Is Only Half the Data Marketers Need.
Utilizing thick data in your analyses
Choose a data source that's valuable to your business and think about how much of this data you really need to inform decision making. One way you can gauge this is by considering the added value of increasing the amount 2X, 5X, and 10X, particularly with respect to the investment of collecting, storing, and analyzing it. Then, answer this question: What thick data could you use to enhance the quality of this data source?
Find out more about best practices to leverage data in The Definitive Guide to Machine Learning for Business Leaders.