

Creating Data Visualizations
The core power of Amazon QuickSight lies in its ability to transform raw data into visually intuitive, actionable insights.
Preparing your data
Before you can build meaningful charts and reports, it is important to ensure that your dataset is clean, accurate, and well-structured.
Amazon QuickSight provides built-in tools for basic data preparation and transformation, allowing you to shape your data before analysis.
01: Upload or connect to a data source
Navigate to the “Datasets” section and click “New Dataset.” From here, you can either:
- Upload a file (CSV, Excel)
- Connect to a data source
QuickSight supports a variety of data source options, including:
- Amazon S3: Connect to structured data stored in object storage.
- Amazon Redshift: Ideal for querying large datasets in a cloud data warehouse.
- Amazon Athena: Query data directly from S3 using SQL, without moving the data.
- Amazon RDS: Connect to relational databases hosted on AWS.
- MySQL/PostgreSQL/SQL Server/Snowflake: Connect via JDBC.
- Salesforce, Excel, and CSV files: Upload directly or set up scheduled refreshes.
The four images below take you through the process of locating the “Datasets” tab, exploring import options, and finally, viewing a dataset once it has been successfully imported:
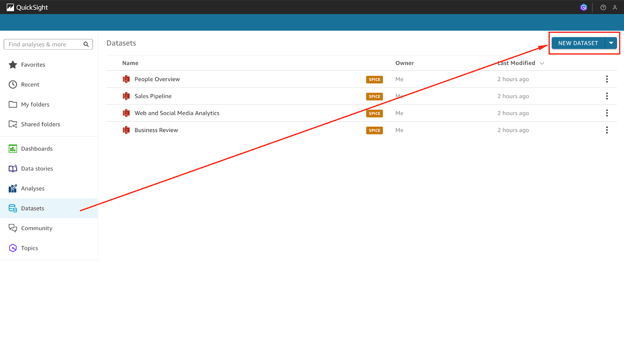
Screenshot of the QuickSight console showing the ‘Datasets’ tab.
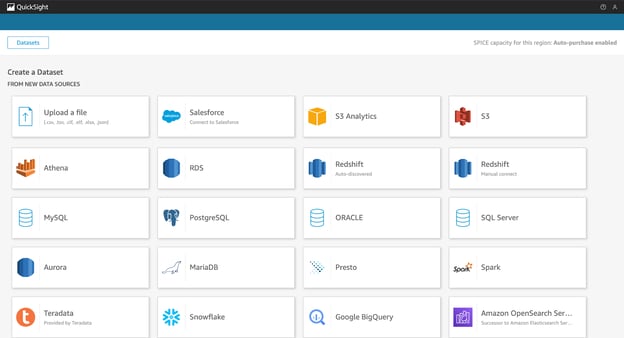
Screenshot of the QuickSight console showing the datasets import options available (part 01).
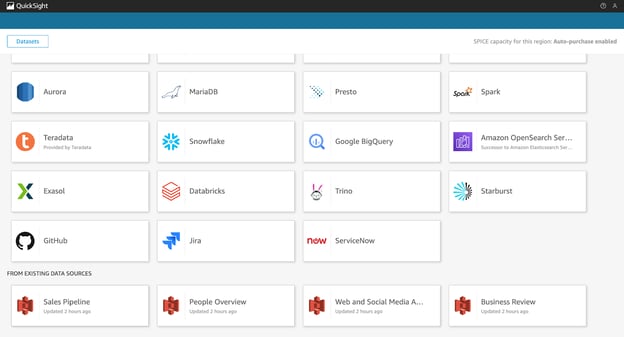
Screenshot of the QuickSight console showing the datasets import options available (part 02).
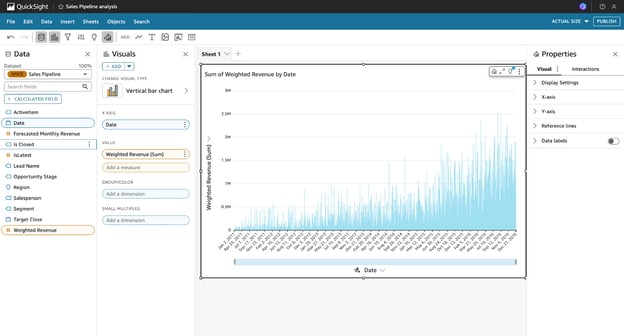
Screenshot of the QuickSight console showing the view once a dataset has been imported.
02: Clean and validate your data
QuickSight allows you to carry out limited transformations during dataset creation. These transformations include:
- Removing duplicates: Using filters or data prep tools to eliminate redundant records.
- Fixing data types: Ensuring date, text, and number fields are recognized correctly.
- Addressing nulls: Replacing or filtering out missing values.
03: Apply transformations
You can also enhance your dataset with calculated fields, filters, and simple logic to derive new insights from your data.
Here is an example:
You can create a calculated field to categorize sales values into two groups:
ifelse({sales} > 1000, "High", "Low")This formula creates a new column that classifies each record as "High" or "Low" based on sales volume.
04: Preview and confirm
QuickSight provides a preview of your data after any transformation. You can use this to confirm that values, labels, and formats align with your goals.
Once your data looks correct, click Save & Visualize to move into the analysis interface.
The images below show the process of importing a dataset from a CSV file and reviewing it in the data preparation stage:
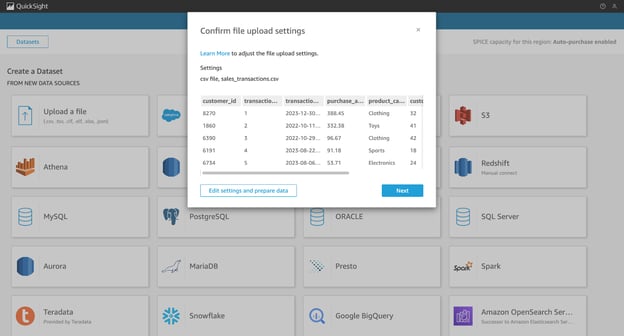
Screenshot of the QuickSight console showing the process of importing a dataset from a CSV (part 01).
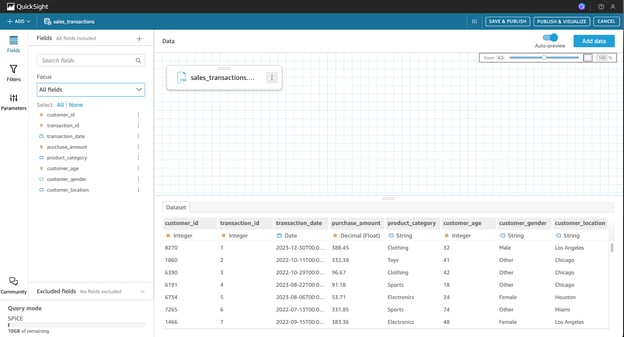
Screenshot of the QuickSight console showing the process of importing a dataset from a CSV (part 02).
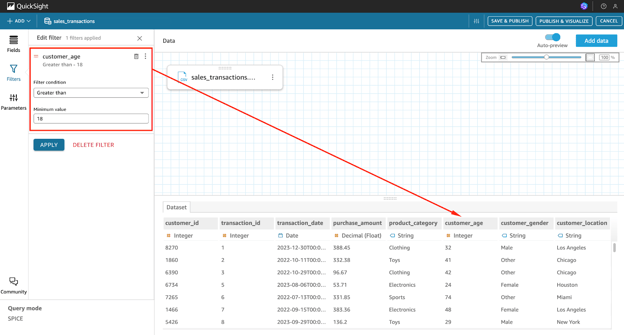
Screenshot of the QuickSight console showing the process of importing a dataset from a CSV (part 03).
Building your first dashboard
After your dataset is prepared and validated, you can begin creating your first QuickSight dashboard.
Here is how to get started:
01: Start a new analysis
Navigate to the Analyses section, click New Analysis, and select the dataset you just created or imported.
The image below shows the Analyses tab, where you begin a new analysis.
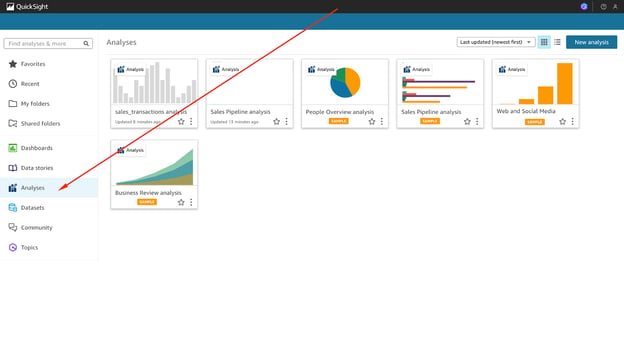
Screenshot of the QuickSight console showing the ‘Analyses’ tab.
02: Add a visual
Click Add, then Add Visual to insert a new chart into your analysis.
Choose from a wide variety of visual types:
- Bar charts, line graphs, pie charts
- Heat maps, scatter plots, tree maps
- KPIs, tables, pivot tables, combo charts
The image below shows where to access visual options within the analysis interface.
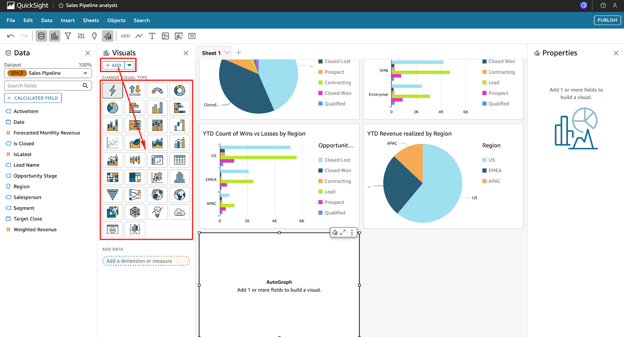
Screenshot of the QuickSight console showing the option to add visuals within the ‘Analyses’ tab.
03: Configure the visual
To configure the visual, you can drag fields to the appropriate zones:
- X-axis, Y-axis for plotting metrics
- Group by, Color, Value for segmenting and formatting
You can also use ‘filters’ to focus on a subset of the data (e.g., a specific region, time range, or category) and sort results by field or value to surface trends and outliers.
04: Customize the look and feel
To customize your dashboard, click Format Visual. You can then:
- Adjust axis titles and font sizes
- Change chart colors or apply conditional formatting
- Enable or disable legends and gridlines
05: Add narratives and ML insights (optional)
You can use “Auto-Narratives” to auto-generate insights in natural language.
You can also enable built-in ML features like “Anomaly Detection” and “Forecasting” to add predictive elements to your dashboard without building a model.
06: Publishing and sharing
Once your dashboard looks the way you want:
- Click PUBLISH.
- Name your dashboard and assign access rights to users or groups.
The images below walk through the publishing process, from naming your dashboard to setting sharing options.
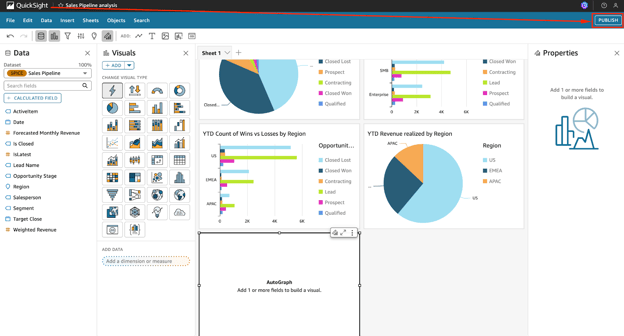
Screenshot of the QuickSight console showing the option to publish a dashboard (part 01).
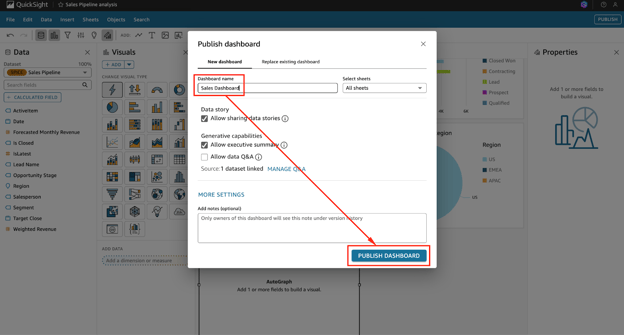
Screenshot of the QuickSight console showing the option to publish a dashboard (part 02).
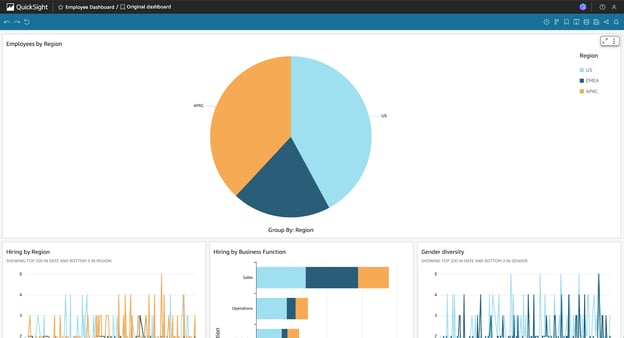
Screenshot of the QuickSight console showing the option to publish a dashboard (part 01).
It should be noted that you can also embed dashboards into internal tools or portals using QuickSight’s embedding APIs.
Advanced Visualization Techniques
Once you are familiar with the foundational features of Amazon QuickSight, it is time to explore more advanced capabilities that enhance performance and deliver predictive insights.
These include leveraging the SPICE engine and machine learning-powered features.
Utilizing the SPICE engine
SPICE, which stands for Super-fast, Parallel, In-memory Calculation Engine, is Amazon QuickSight’s proprietary in-memory engine.
It is designed to significantly improve query performance by caching data in memory, which minimizes latency and reduces the load on live data sources.
Rather than querying data directly from the source every time a visual loads, SPICE allows you to import data into QuickSight, which enables dashboards and analyses to render much faster, especially when working with large or complex datasets involving multiple joins and aggregations.
This makes SPICE ideal for dashboards that are shared across teams, accessed frequently, or based on large volumes of historical data.
To use SPICE, begin at the dataset setup stage:
- When uploading a dataset, you will be prompted to select your preferred query mode.
- Choose Import to SPICE for quicker analytics instead of Directly query your data. This instructs QuickSight to store and process the data in-memory.
- After importing to SPICE, you can configure automatic refreshes to keep the data up to date. These refreshes can be scheduled to run hourly, daily, or at custom intervals based on how frequently your source data changes.
SPICE also supports incremental refreshes, which allow you to update only the new or changed data, saving both time and compute resources.
Implementing machine learning insights
QuickSight democratizes machine learning by making it accessible to analysts and business users without requiring data science expertise. Several ML-powered features come built-in, helping you discover trends, detect anomalies, and forecast future metrics with just a few clicks.
- Anomaly detection is a powerful feature that allows QuickSight to automatically scan your data for unusual patterns or unexpected changes.
For example, if you are tracking monthly revenue across multiple regions, enabling anomaly detection on your line chart will highlight any outlier behavior, such as an unexpected drop or surge.
QuickSight provides confidence intervals and contextual explanations to help interpret the cause, in addition to flagging the anomalies.
- Forecasting in QuickSight uses historical trends to project future values. This is particularly useful for planning and budgeting.
You can activate forecasting with a single right-click on a time-series visual, and QuickSight will display future data points along with confidence bounds, making it easier to anticipate demand, sales, or customer engagement.
- Auto-narratives can also be added to your dashboards to summarize key findings in plain English.
These AI-generated text boxes automatically adapt as data changes, which offers dynamic written insights such as "Sales increased by 15% in Q2 compared to Q1" or "Anomaly detected in product returns during the holiday season."
These machine learning capabilities enhance QuickSight into a more predictive and intelligent BI solution.
Embedding and Sharing Dashboards
Amazon QuickSight offers a variety of options for securely sharing dashboards, both internally within your organization and externally through embedding into web applications.
Embedding dashboards in applications
One of QuickSight’s most powerful capabilities is the ability to embed interactive dashboards into portals, intranets, or customer-facing applications.
This is particularly useful for SaaS platforms, internal tools, or any environment where users should interact with BI content without accessing the AWS Console.
To embed a dashboard:
- Start by enabling “embedding support” in your QuickSight account settings.
- After publishing your dashboard, obtain the dashboard ID and use the AWS SDK or CLI to generate a secure embed URL.
- You will need to use the
GenerateEmbedUrlForAnonymousUserorGenerateEmbedUrlForRegisteredUserAPI call, depending on your authentication model. - You can then use the QuickSight JavaScript SDK to render the dashboard inside an HTML
<iframe>.
Security is essential when embedding dashboards:
- You should enforce row-level security (RLS) to ensure each user only sees the data they’re authorized to access.
- Embed URLs should also be signed and short-lived, using temporary authentication tokens that expire quickly.
- Use IAM roles and federated login for anonymous or third-party users when necessary.
Sharing and collaboration
QuickSight provides several features for secure collaboration among team members:
- Dashboard sharing lets you grant access to individual users or groups within your AWS account.
- You can assign different roles such as “Authors” (who can create and edit content) or “Viewers” (who can only view dashboards).
- Dashboards can be distributed automatically via scheduled email reports, making it easy to keep stakeholders informed.
- In the Enterprise edition, you can leave comments and collaborate in real time, enabling teams to build a shared understanding of the data.
The images below show how to share a dashboard for collaboration purposes.
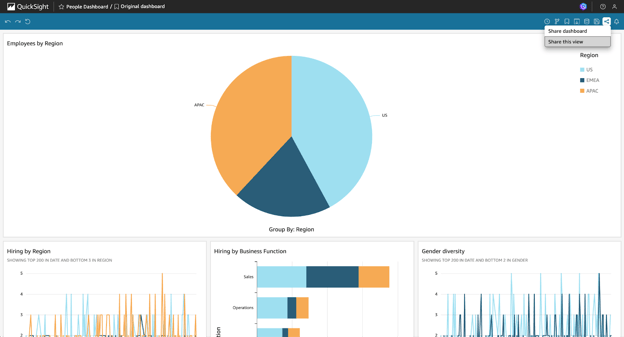
Screenshot of the QuickSight console showing the option to share a dashboard for collaboration purposes (part 01).
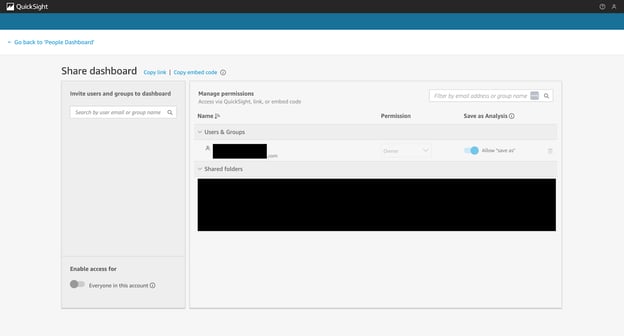
Screenshot of the QuickSight console showing the option to share a dashboard for collaboration purposes (part 02).
Security and Compliance Considerations
When working with business-critical or sensitive data, maintaining strong security controls and meeting compliance requirements are non-negotiable.
Amazon QuickSight provides enterprise-grade features that align with modern security and governance standards.
Implementing data security measures
To protect your data at various levels:
- Use column-level security to restrict access to specific fields, ensuring sensitive attributes like PII are only available to authorized users.
- Implement row-level security (RLS) to filter data based on user attributes. For example, a regional sales manager might only see data for their assigned region.
Here is a sample RLS rule using user-based filtering:
{
"region": "${user.region}"
}You can manage user attributes directly in IAM or pass them dynamically via embedded session parameters.
QuickSight also integrates with AWS IAM, which enables fine-grained access control.
All data is encrypted at rest and in transit using AWS KMS, which ensures compliance with enterprise and industry security standards.
Compliance and governance
QuickSight’s Enterprise edition supports a range of governance features:
- AWS CloudTrail logs every action performed in QuickSight for auditability.
- Use Amazon Macie and GuardDuty to monitor data exposure and security threats.
- QuickSight is compliant with major frameworks, including SOC, ISO, and HIPAA, making it suitable for use in regulated industries.
Best practices include tagging assets (dashboards, datasets), version-controlling important visuals, and reviewing access logs regularly to ensure proper governance.
Cost Optimization Strategies
Although Amazon QuickSight is built with cost-efficiency in mind, strategic configuration can help further reduce expenses while maintaining high performance.
Understanding pricing models
QuickSight offers two primary pricing models:
- Per-user pricing (Standard Edition) – You pay a flat monthly fee for each Author and Viewer.
- Capacity pricing (Enterprise Edition) – You pay based on the number of sessions used by Readers, which is ideal for high-scale scenarios where users log in sporadically.
To optimize costs:
- Use “Readers” instead of “Authors” for users who only need to view dashboards.
- Monitor user activity via “AWS Billing Reports” to detect inactive licenses.
- Leverage session-based pricing for public dashboards or B2B client portals.
SPICE storage optimization
SPICE capacity is limited based on your account plan, but you can maximize its efficiency by:
- Enabling incremental refreshes to load only updated records instead of re-importing the entire dataset.
- Using column pruning to remove fields that are not used in dashboards or calculations.
- Aggregating your data before import to reduce dataset size and improve query performance.
These strategies help keep SPICE usage under control while boosting dashboard performance.
Performance Optimization Tips
QuickSight dashboards are highly interactive, but performance can be impacted as visuals and datasets grow.
Here are several ways I recommend to optimize dashboard responsiveness:
Improving dashboard load times
If your dashboards are slow to load:
- Limit the number of fields included in each visual to only what's necessary.
- Avoid overcrowding your dashboard canvas. Instead, organize content using tabs, controls, or filters.
- Use parameterized queries to limit data to the current user’s scope or selected filters.
- Review filters, joins, and dataset structures for optimization opportunities.
Using composite SPICE datasets
You can also use a composite SPICE dataset to join and reuse data across multiple sources while improving load speed:
- Combine related datasets using shared dimensions such as time, location, or user ID.
- Use the “Join Data” feature in the dataset editor to create a unified structure that reduces redundancy.
- By storing frequently accessed dimensions in SPICE, you minimize repeated queries and streamline performance.
These techniques are especially effective in enterprise settings where scalability and performance consistency are essential.
> If you want to explore similar tutorials, check out the AWS EC2 Tutorial for Beginners or Amazon Bedrock: A Complete Guide.
Conclusion
After working with Amazon QuickSight, I have come to appreciate how it streamlines the process of turning raw data into interactive visuals.
Its built-in machine learning capabilities, high-speed performance via SPICE, and tight AWS integration make it a strong choice for scalable, cloud-native BI.
QuickSight is clearly a solution worth exploring for any data-driven organization.
To get a better understanding of the AWS ecosystem, explore the AWS Cloud Technology and Services course. If you are looking to extend your visualization skills beyond QuickSight, check out Introduction to Tableau.
FAQs
What is Amazon QuickSight, and who is it for?
Amazon QuickSight is a cloud-native BI tool for data analysts, BI professionals, and data scientists to create interactive dashboards and leverage ML insights.
Do I need an AWS account to use Amazon QuickSight?
Yes, you must have an AWS account to use Amazon QuickSight. The setup includes account configuration and permissions, which are explained in the article.
What types of data sources can Amazon QuickSight connect to?
QuickSight supports AWS services like S3 and Redshift, SaaS platforms, on-prem databases, and public datasets via connectors.
What is the SPICE engine in Amazon QuickSight?
SPICE is a high-speed in-memory engine that improves performance by allowing faster, scalable data analysis and interactive querying of large datasets.
Can I use machine learning features in Amazon QuickSight?
Yes, QuickSight includes built-in ML features like anomaly detection and auto-narratives to automatically highlight trends and outliers in your data.
How can I embed QuickSight dashboards into a web application?
You can embed dashboards using the QuickSight JavaScript SDK, with support for secure access, multi-tenancy, and user authentication.
What options exist for sharing and collaborating on dashboards?
QuickSight supports link-based sharing, scheduled email reports, and fine-grained role-based permissions for effective collaboration.
How does Amazon QuickSight ensure data security and compliance?
It supports encryption, column-level security, and integrates with IAM and AWS CloudTrail to maintain compliance with industry standards.
What are some ways to optimize costs when using QuickSight?
You can manage costs by selecting the right pricing tier, using SPICE efficiently with incremental refreshes, and monitoring user activity.




Amazon QuickSight, kuruluşların verileri ölçekli olarak görselleştirmesine, analiz etmesine ve paylaşmasına olanak tanıyan bulut tabanlı bir iş zekası (BI) hizmetidir.
AWS’den yararlanarak veri odaklı kararlar almak isteyen modern veri ekipleri (analistler, veri bilimcileri ve iş zekası uzmanları dahil) için tasarlanmıştır.
Bulut tabanlı analitik platformlarıyla ilk çalışmaya başladığımda, ölçeklenebilen, AWS ekosistemimle entegre olabilen ve sunucu yönetimi yükü olmadan görselleştirmeler sunabilen bir çözüm arıyordum. O sırada Amazon QuickSight ile tanıştım ve bu, pano oluşturma ve gerçek zamanlı analitiğe yaklaşımımı dönüştürdü.
Bu rehberde, Amazon QuickSight’i kullanarak etkileyici panolar oluşturmayı, SPICE ile sorgu performansını hızlandırmayı, etkileşimli raporları gömmeyi ve gelişmiş makine öğrenimi içgörülerini uygulamayı göstereceğim.
> Benzer bulut tabanlı görselleştirme araçlarının temelini anlamak için the Introduction to Tableau kursunu inceleyin.
Amazon QuickSight’i Anlamak
QuickSight, iş zekası ihtiyaçları için sunucusuz ve ölçeklenebilir bir çözüm sunan Amazon’un daha geniş AWS ekosisteminin bir parçasıdır.
Birden fazla veri kaynağına kolayca bağlanmanızı, analiz yapmanızı ve bulguları etkileşimli panolar aracılığıyla sunmanızı sağlar.
Temel özelliklere genel bakış
Amazon QuickSight, eski BI platformlarından ve hatta daha yeni bulut tabanlı rakiplerden ayrışmasını sağlayan aşağıdaki özellikleri sunar.
QuickSight’in temel özelliklerini ayrıntılandıran görsel. Napkin AI kullanılarak oluşturulmuştur
Sunucusuz mimari
QuickSight tamamen yönetilen bir hizmettir. Bu, dağıtmanız, bakımını yapmanız veya ölçeklendirmeniz gereken sunucular olmadığı anlamına gelir.
Talebinize otomatik olarak uyum sağlar; bu da manuel sağlama ve kapasite planlamasının karmaşıklığını ve maliyetini önlemenize olanak tanır.
SPICE motoru
SPICE (Super-fast, Parallel, In-memory Calculation Engine), hızlı ve etkileşimli analiz yapmanızı sağlayan QuickSight’in tescilli bellek içi motorudur.
Sık erişilen veri kümeleri için önceden veri yükler ve sıkıştırır; ayrıca önbellekleme sağlar.
SPICE, milyonlarca satırı yüksek eşzamanlılıkla destekler ve panolar ile raporlar genelinde düşük gecikme sunar.
Makine öğrenimi içgörüleri
QuickSight; anomalileri tespit etmenizi, tahminler üretmenizi ve panoları otomatik olarak özetlemenizi sağlayan yerleşik makine öğrenimi yetenekleri içerir.
Bu özellikler doğrudan arayüzden erişilebilir ve sizin model kurmanıza, eğitmenize veya dağıtmanıza gerek yoktur.
Örneğin, anomali tespiti verilerinizdeki alışılmadık örüntüleri görsel işaretlerle vurgularken, ML destekli tahminleme geçmiş trendlere dayanarak gelecekteki metrikleri öngörebilir.
Doğal Dil Sorgulama (NLQ)
Q özelliğiyle, “Geçen çeyrekte en iyi performans gösteren bölgeler hangileriydi?” gibi düz İngilizce sorular sorabilir ve anında görsel yanıtlar alabilirsiniz.
Bu, veri erişimini genişletir ve teknik ekiplere bağımlılığı azaltır; teknik olmayan paydaşlar için self-servis BI’ı gerçeğe dönüştürür.
AWS yerel entegrasyonu
AWS’in bir parçası olarak QuickSight şu hizmetlerle entegre olur:
Bu sıkı entegrasyon, veri bağlantısını basitleştirir ve AWS ekosistemi içinde uçtan uca analitik boru hatları kurmanıza olanak tanır.
Etkileşimli görselleştirmeler ve panolar
QuickSight; çubuk grafikler, çizgi grafikler, ısı haritaları, coğrafi haritalar ve KPI görselleri dahil çok çeşitli görselleri destekler.
Filtreler, parametreler ve ayrıntı düzeyi (drill-down) ile etkileşimli panolar oluşturabilir, böylece içgörüleri ortaya çıkarabilirsiniz.
Çoklu kiracılık ve gömme yetenekleri
QuickSight, farklı kullanıcı gruplarıyla güvenli bir şekilde paylaşılan çoklu kiracılı panolar oluşturmanıza olanak tanır.
Ayrıca JavaScript SDK veya API’leri kullanarak web ve mobil uygulamalara gömmeyi de sağlar; bu da SaaS sağlayıcıları ve dahili iş uygulamaları için idealdir.
> QuickSight gibi araçları destekleyen bulut tabanlı mimariler ve hizmetler hakkında daha fazla bilgi edinmek için the AWS Cloud Technology and Services kursuna göz atın.
İş zekası için QuickSight’ın faydaları
QuickSight, aşağıdakiler de dahil olmak üzere çeşitli zorlukları ele alarak iş zekası ekiplerine değer sunar.
İş zekası için QuickSight’ın faydalarını ayrıntılandıran görsel. Napkin AI kullanılarak oluşturulmuştur
Karmaşıklık olmadan ölçeklenebilirlik
Geleneksel BI araçları, önemli altyapı yatırımı olmadan binlerce kullanıcıyı eşzamanlı olarak desteklemekte genellikle zorlanır.
QuickSight’ın sunucusuz modeli, kuruluşların analitiği altyapı yönetimi yükü olmadan binlerce kullanıcıya ölçeklendirmesine olanak tanır.
SPICE ile ölçekte hız
SPICE verileri bellekte sakladığı için, panolar ve görseller milyonlarca satır veri olsa bile saniyenin altında sonuç verir.
Bu tepkisellik, gerçek zamanlı karar almayı etkinleştirmek ve kullanıcı etkileşimini sürdürmek için kritik önemdedir.
Maliyet etkinliği ve esneklik
QuickSight’ın oturum başına fiyatlandırması, kuruluşların yalnızca panolar görüntülendiğinde ödeme yapması anlamına gelir. Daha öngörülebilir kullanım için kapasite bazlı bir fiyatlandırma modeli de mevcuttur.
Bu seçenekler, kullanım kalıplarına ve ekip ihtiyaçlarına göre maliyetleri optimize etmenizi sağlar.
AWS genelinde entegrasyon
AWS hizmetleriyle iyi entegre olduğundan QuickSight, karmaşık ETL süreçlerine duyulan ihtiyacı azaltır.
Analistler; Redshift, Athena veya RDS’den canlı verileri doğrudan sorgulayabilir ya da aynı arayüz içinde SPICE üzerinden içe aktarılan veri kümeleriyle çalışabilir.
Kurumsal düzeyde güvenlik ve yönetişim
QuickSight; AWS Identity and Access Management (IAM), satır düzeyi ve sütun düzeyi güvenlik ile dururken ve aktarım sırasında şifrelemeyle ayrıntılı veri erişim denetimlerini destekler.
Integration with AWS CloudTrail ensures auditability and compliance with regulatory standards.
İş birliği ve self-servis analitik
QuickSight, panoları ekipler arasında paylaşmayı, erişim izinleri ayarlamayı ve iş kullanıcılarının filtreler, ayrıntı düzeyi ve NLQ kullanarak verileri kendi başlarına keşfetmelerini kolaylaştırır.
Bu, BT veya analitik ekiplerini bunaltmadan veri odaklı bir kültürü teşvik eder.
QuickSight, hâlihazırda AWS kullanan ve ayrı platformlar benimsemeden analitik yeteneklerini genişletmek isteyen kuruluşlar için özellikle uygundur.
> If you are new to Redshift, which is a common QuickSight data source, have a look at the Introduction to Redshift course for a detailed walkthrough.
Getting Started with Amazon QuickSight
Before creating dashboards, you need to set up your QuickSight environment and familiarize yourself with the interface.
Setting up your environment
To start using Amazon QuickSight, follow these steps:
01: Sign in to AWS
Go to the AWS Management Console.
02: Choose a region
Once you are in, select the AWS region where your data sources are located. This is important for latency, compliance, and integration purposes.
Regions supported by QuickSight include US East (N. Virginia), US West (Oregon), and EU (Ireland). These regions could change in the future.
The image below provides a screenshot of the AWS Management Console, showing the available AWS regions.
Screenshot of the AWS Management Console showing the available AWS Regions.
03: Access and activate QuickSight
In the search bar, type “QuickSight” and select it from the results.
The image below shows a screenshot of the AWS Management Console with “QuickSight” entered in the search bar.
Screenshot of the AWS Management Console with 'QuickSight' entered in the search bar at the top.
Click on “QuickSight” to navigate to the service page.
Once you are on the page, click the “Sign up for QuickSight” button if it is your first time using the service.
The image below shows a screenshot of the QuickSight console with the sign-up page.
Screenshot of the QuickSight console showing the sign-up page.
The images below show additional steps in the sign-up process.
Screenshot of the QuickSight console showing the sign-up process (part 01).
Screenshot of the QuickSight console showing the sign-up process (part 02).
You will then be asked to:
04: Set up permissions
You will also need to set up permissions to access your AWS resources.
Use AWS Identity and Access Management (IAM) to configure permissions.
05: Add users (optional)
Under “Manage QuickSight,” navigate to the Users tab.
Invite users by email and assign them roles:
Exploring the interface
You are now ready to explore the QuickSight UI.
A key area to become familiar with is the Navigation Pane (left sidebar), which serves as your command center for accessing core features:
The image below shows the QuickSight console, showing the most important options within the navigation pane.
Screenshot of the QuickSight console showing the most important options within the navigation pane.