
Program
Google Cloud Digital Leader
8 sa
If you work on a data team, this scenario likely sounds familiar: your backlog is overflowing with ad-hoc requests. Business users constantly need simple variations of existing reports, asking, "Can you group this by product category?", or "How does this compare to last month?" While they wait in a queue for an answer, your data engineers and analysts are buried in repetitive SQL tasks.
With Conversational Analytics in BigQuery, you can finally shift the bottleneck. This feature brings an AI-powered reasoning engine directly into BigQuery Studio, allowing users to ask natural language questions and instantly receive data, charts, and generated SQL.
In this guide, you will learn how to set up and use conversational analytics in BigQuery. You'll build, configure, and refine your own data agents, so your organization can safely chat with your data.
Conversational analytics shifts data interaction from manual SQL queries to natural language conversations. Instead of writing SELECT statements, you chat with a data agent that understands your business context and returns answers grounded in your actual tables.
This isn't just a basic text-to-SQL parser; it is a profound step toward true data democratization.
It allows non-technical users to access real-time insights independently, and gives data professionals a rapid way to explore datasets and automate reporting.
At the heart of BigQuery’s conversational analytics is a reasoning engine powered by the Gemini family of models. Data agents use a structured, multi-stage pipeline to ensure insights are based on your specific data context:
Google Cloud offers conversational analytics across different layers of your data stack. Choosing the right entry point depends on your users and where your business logic lives:
|
Feature |
BigQuery Conversational Analytics |
Looker Conversational Analytics |
Data Studio (via BigQuery Agents) |
|
Best For |
Data teams, analysts, and developers building custom applications |
Business users who need governed, dashboard-ready insights |
Business users who prefer lightweight BI reporting |
|
Grounding Method |
Direct warehouse schemas, table metadata, and verified queries |
LookML (semantic layer) |
Connected directly to pre-built BigQuery data agents |
|
Data Access |
Can analyze structured, predictive (ML), and unstructured data |
Strictly structured, modeled data |
Structured data |
|
Release Status |
Preview (as of May 2026) |
Generally available |
Preview |
Which path should you choose?
This tutorial focuses on BigQuery as the fastest way for data teams to prototype and productionize agents directly where the data lives.
It is important to understand the architecture of a data agent before setting it up. In the Google Cloud environment, a data agent is the central abstraction layer. It combines BigQuery assets with the reasoning capabilities of the Gemini family of models.
Instead of exposing raw tables directly, a data agent configures everything the model needs to interpret questions, generate secure SQL, and return trustworthy answers. This combination of data sources, instructions, and verified logic makes BigQuery’s conversational analytics more reliable than standard text-to-SQL tools.
Knowledge sources are the foundational layer of any data agent. They define exactly what data the agent is allowed to access and query.
Asset types: Tables, Views, and User Defined Functions (UDFs) can connect as knowledge sources.
Scalability: Multiple knowledge sources can connect to a single agent. This allows the agent to combine information across different business areas.
Access control: Defining specific knowledge sources makes sure that the agent operates only within authorized data.
An agent's intelligence depends on the context provided. This is key to making a generic model understand a company's language.
By defining custom instructions, synonyms, and business glossaries, the agent is grounded in a specific domain. For instance, the agent can be taught that "Top Customers" refers to users with a lifetime value (LTV) over $1,000.
Key Grounding Elements:
Custom instructions: Provide high-level directives, such as "Always exclude internal test accounts from revenue reports."
Business glossaries: Map technical terms to natural language, for example, store_id to "Branch Location".
Field metadata: Descriptions that help the agent understand the nuances of specific variables, such as "Gross Revenue" versus "Net Profit."
The better your instructions and metadata, the higher the agent’s accuracy.
Verified queries, formerly known as Golden Queries, are pre-defined question-and-answer pairs that serve as the source of truth. By mapping specific questions to expert-vetted SQL, the agent uses the correct join paths and filters for critical KPIs.
These queries can include BigQuery ML (BQML) functions. This allows the agent to handle advanced requests, such as generating churn predictions or sales forecasts, using the exact model parameters defined by data scientists. Once verified, these assets are managed via the Dataplex Universal Catalog, ensuring consistency across the organization.
Now that you understand the building blocks, let’s move into actually building and configuring your first data agent.
To follow along with our tutorial, please make sure you have the following prerequisites:
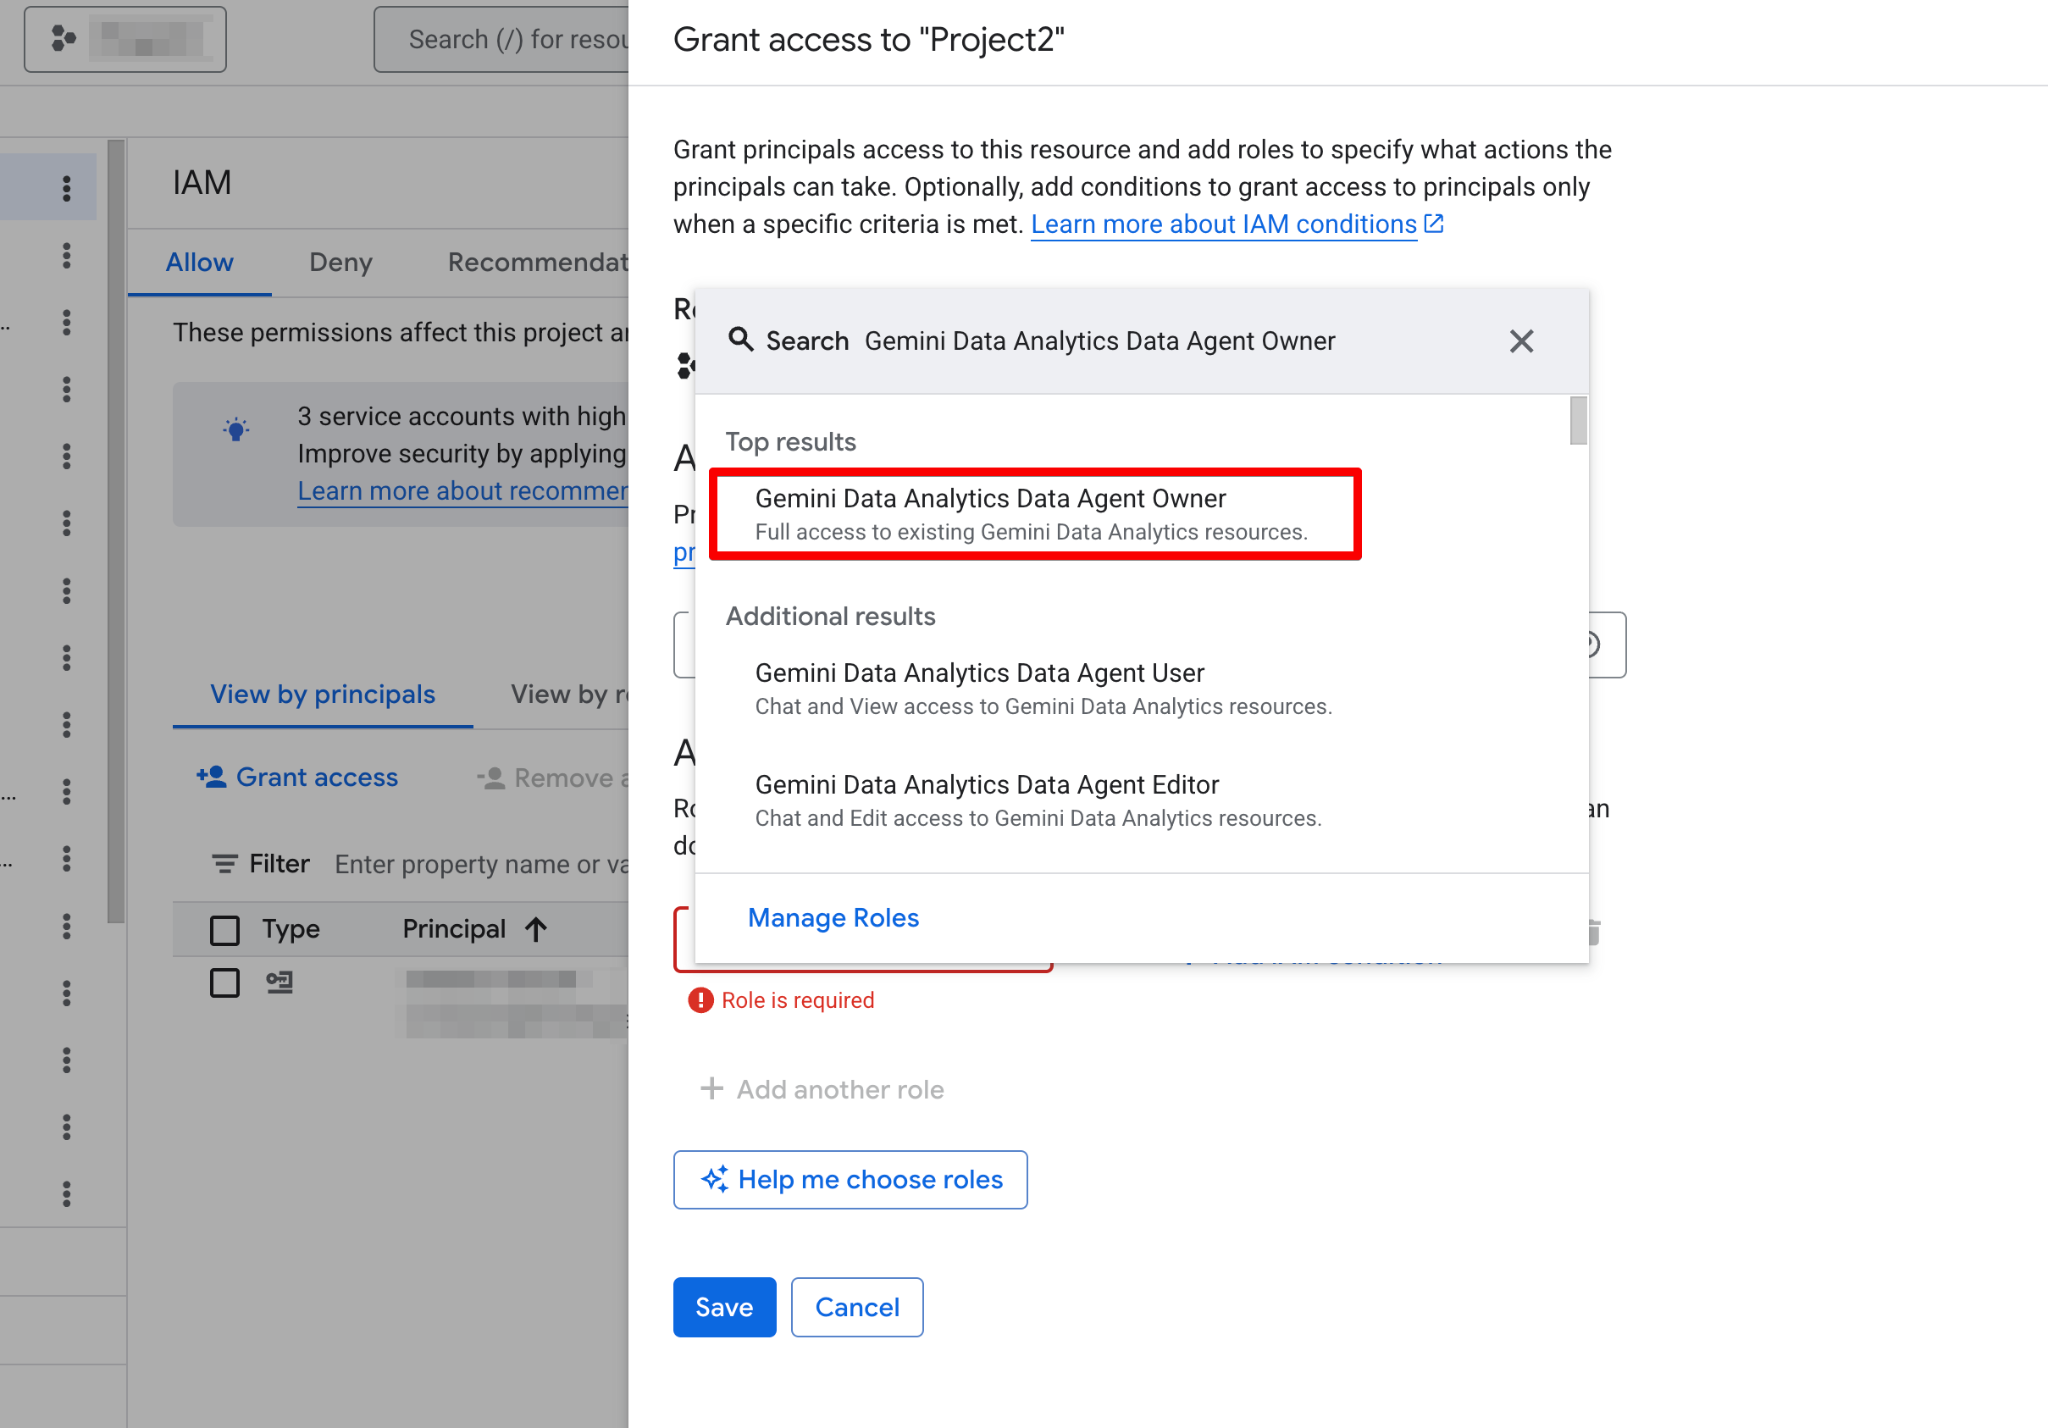
Before building your first agent, you must configure your Google Cloud project and ensure your user account has the necessary permissions. Data Agents operate as a layer on top of your existing data, so correct IAM (Identity and Access Management) configuration is critical for both security and functionality.
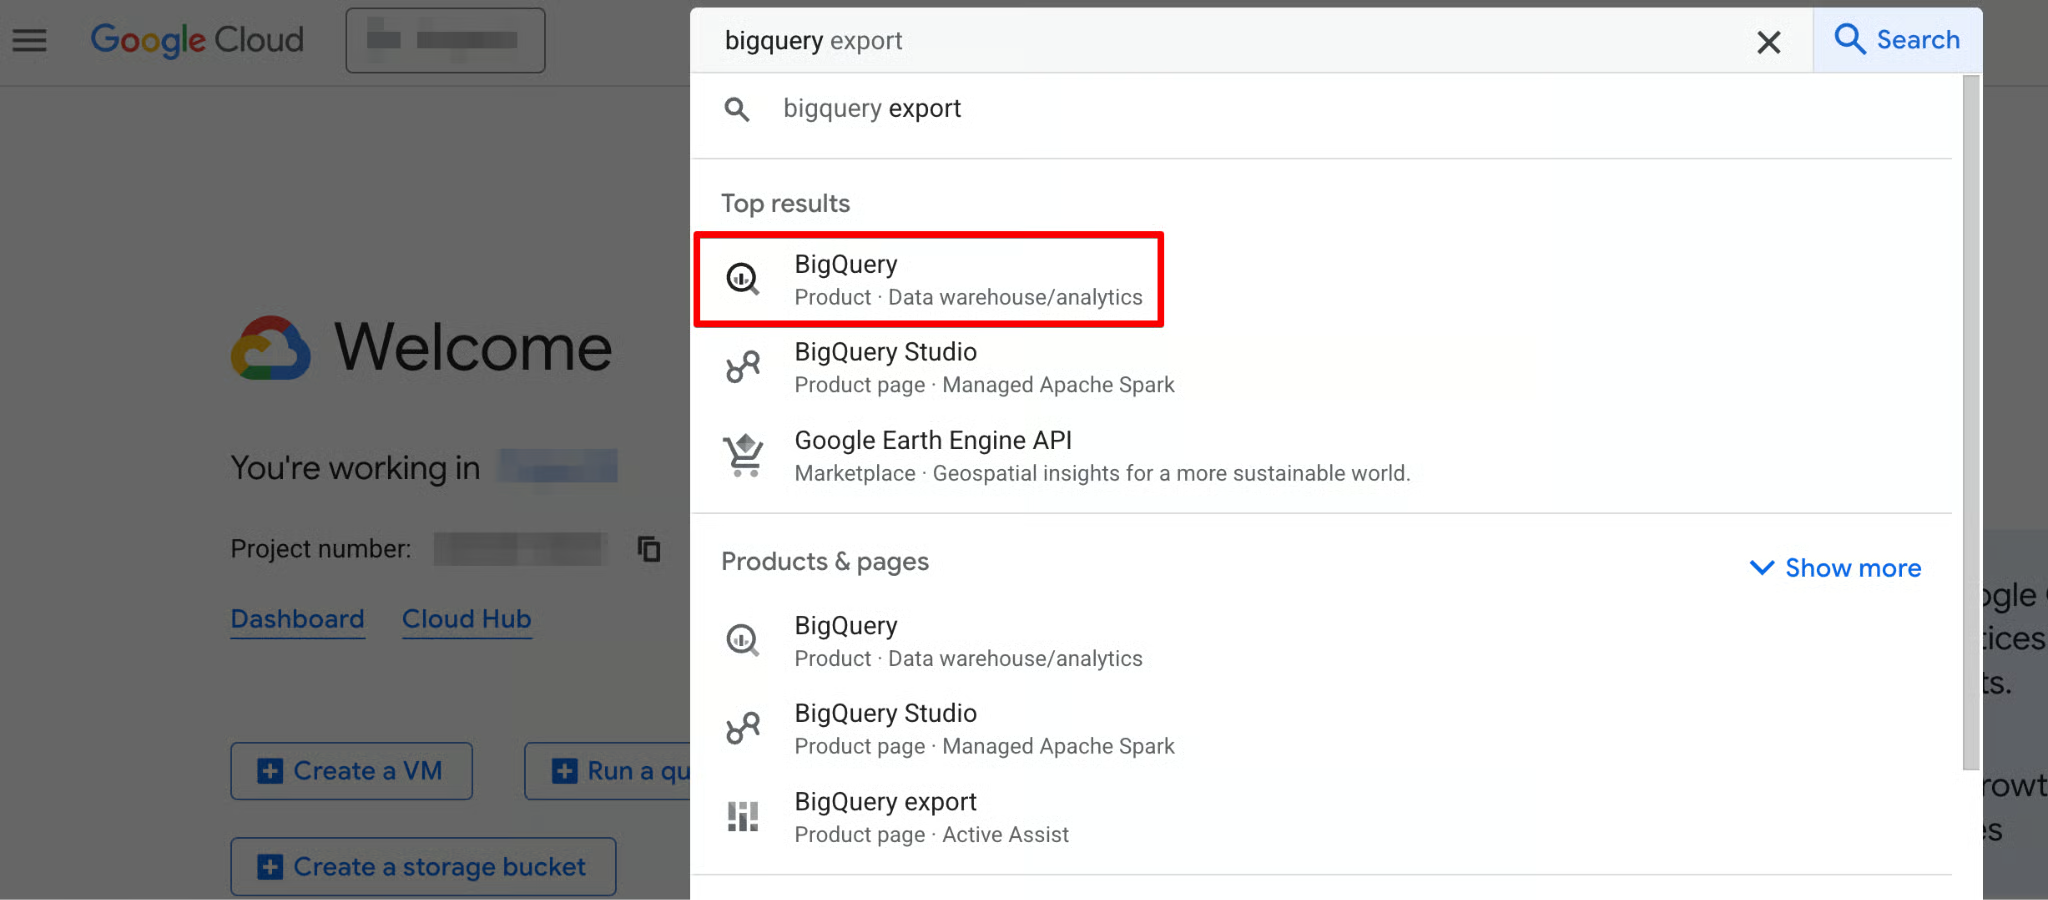
Follow these steps:
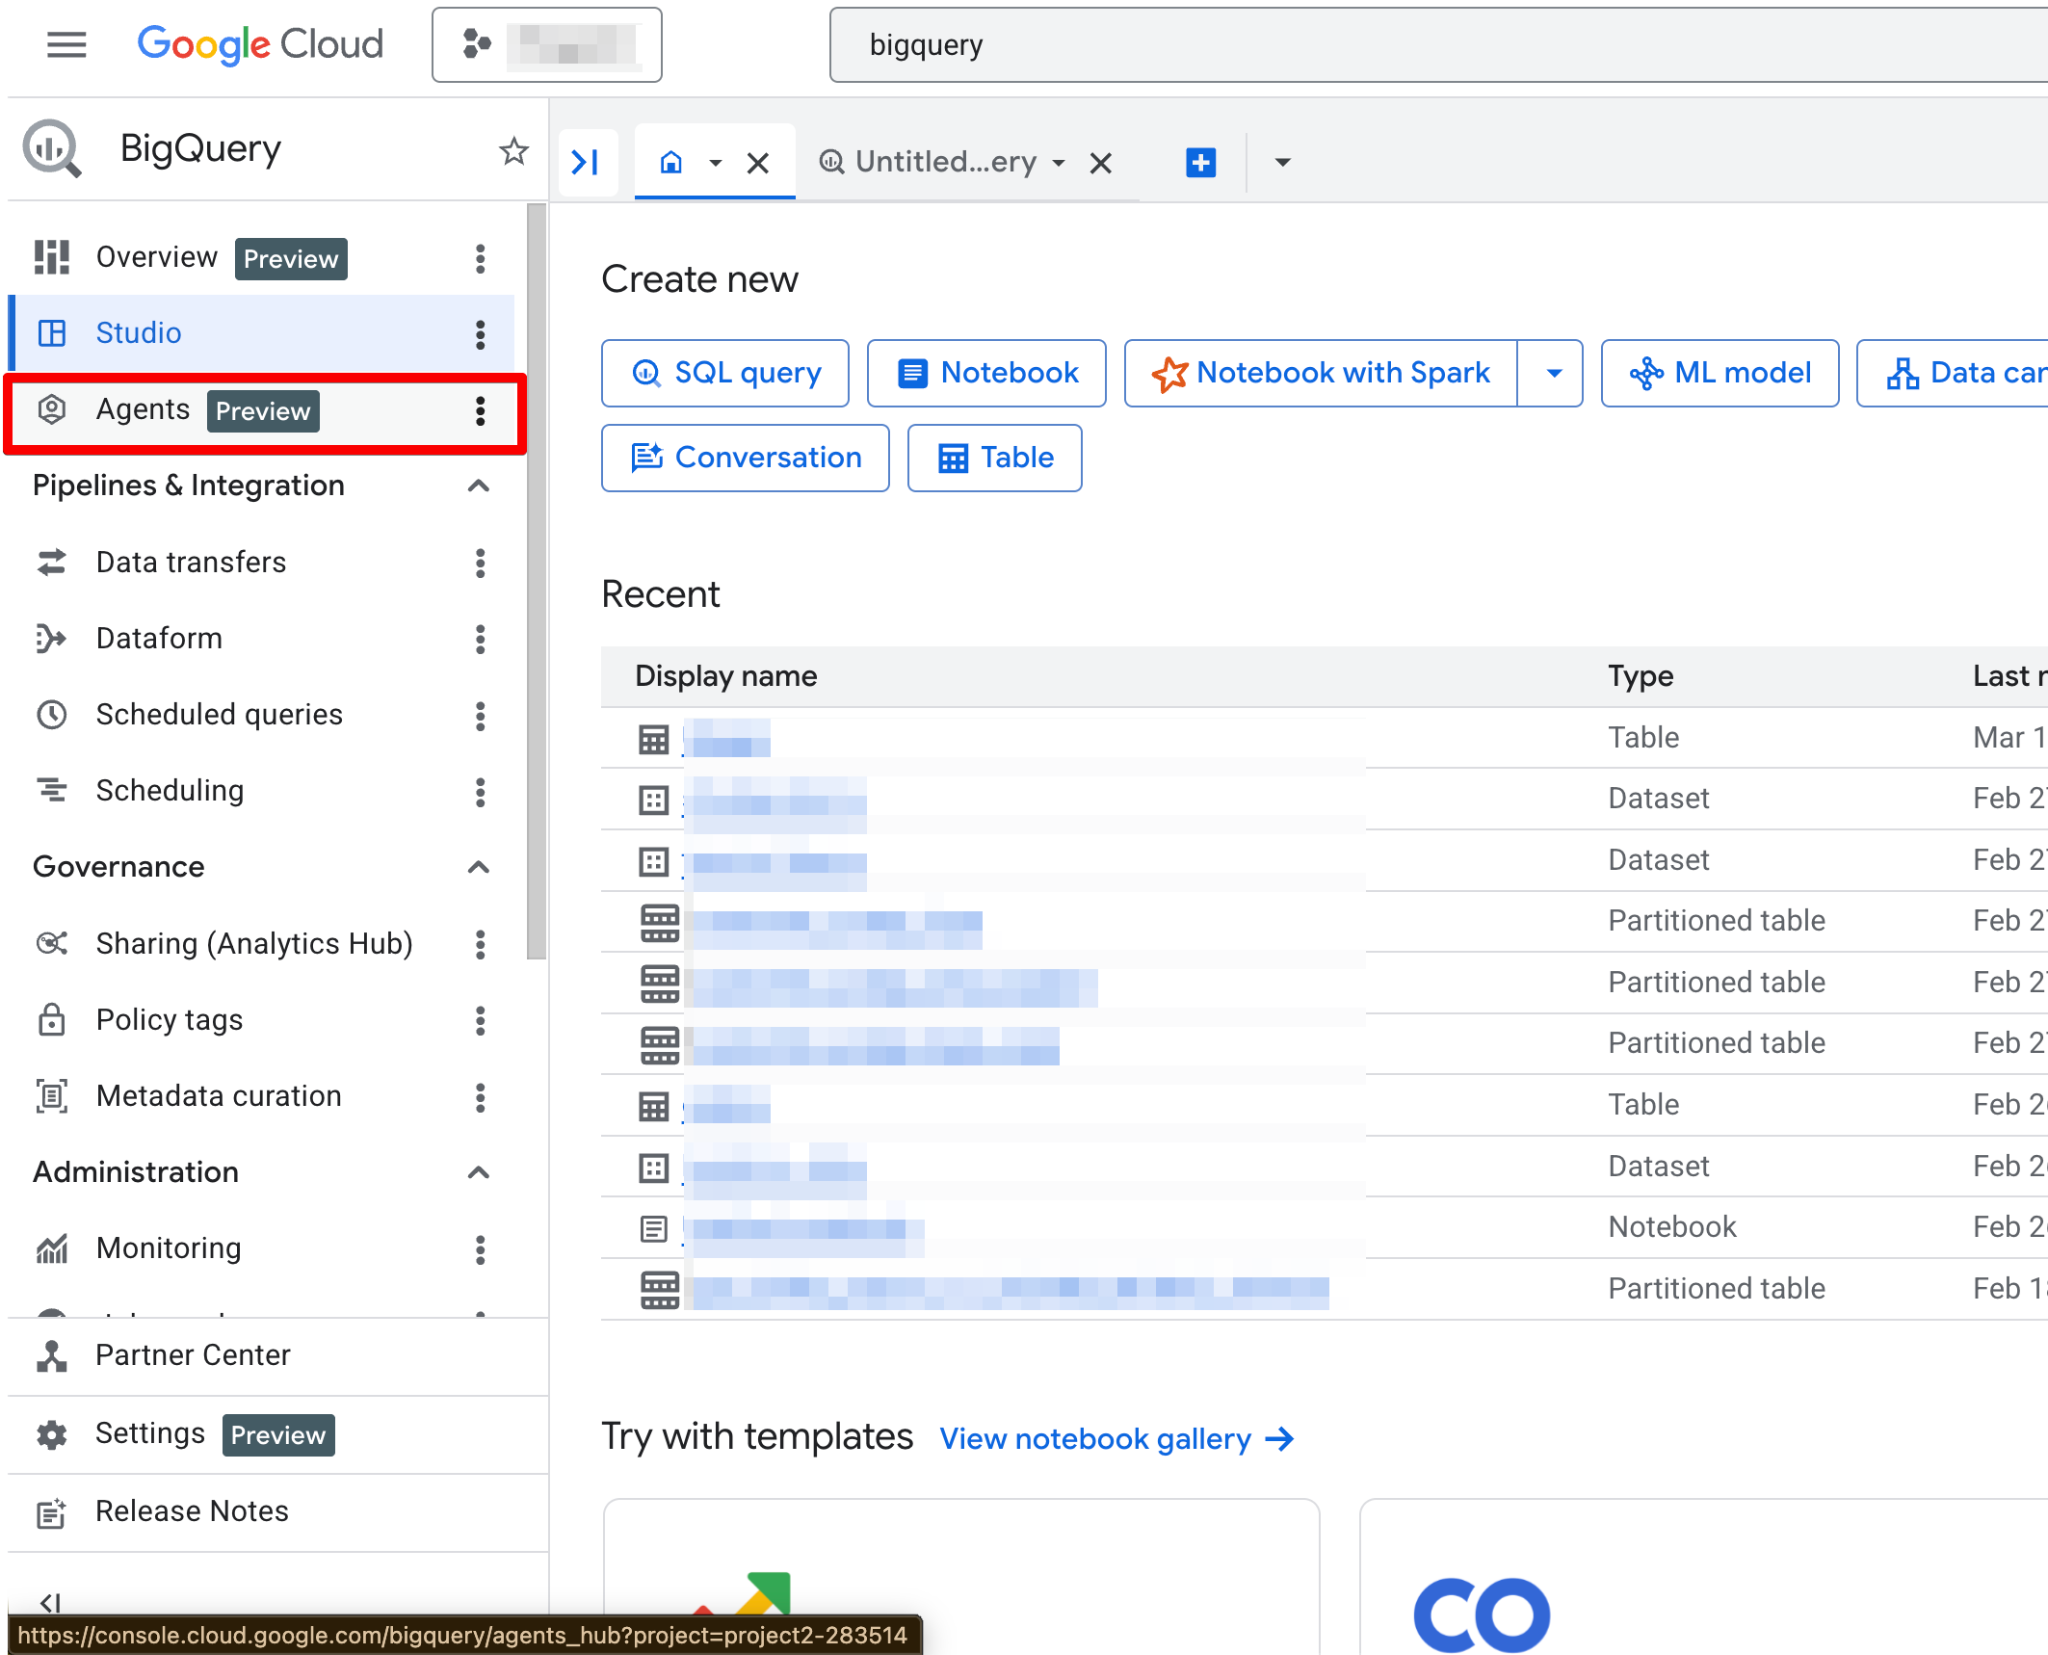
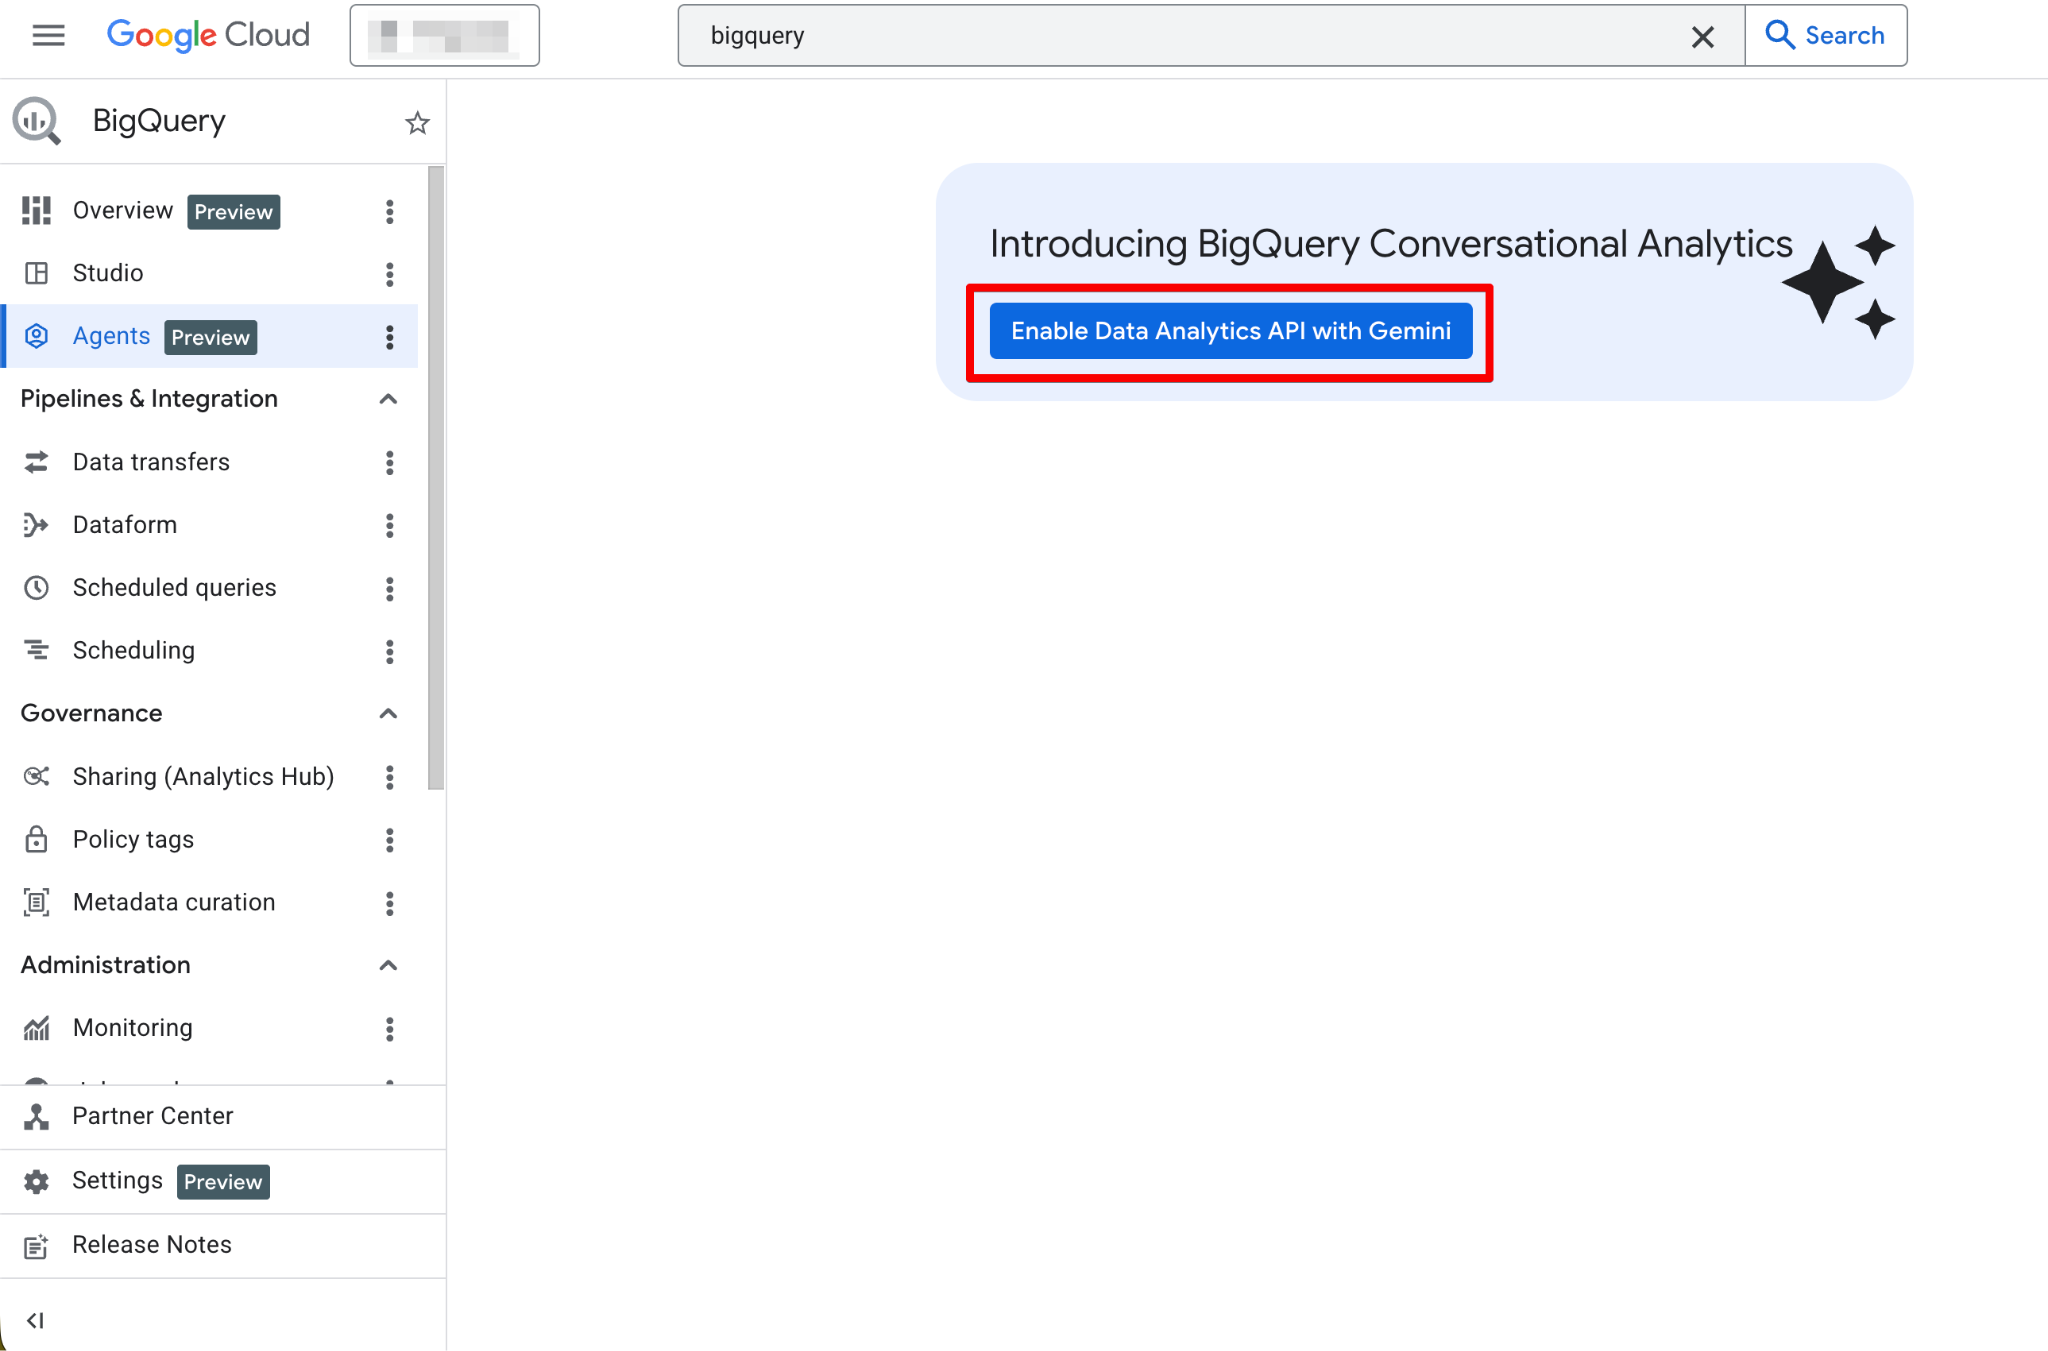
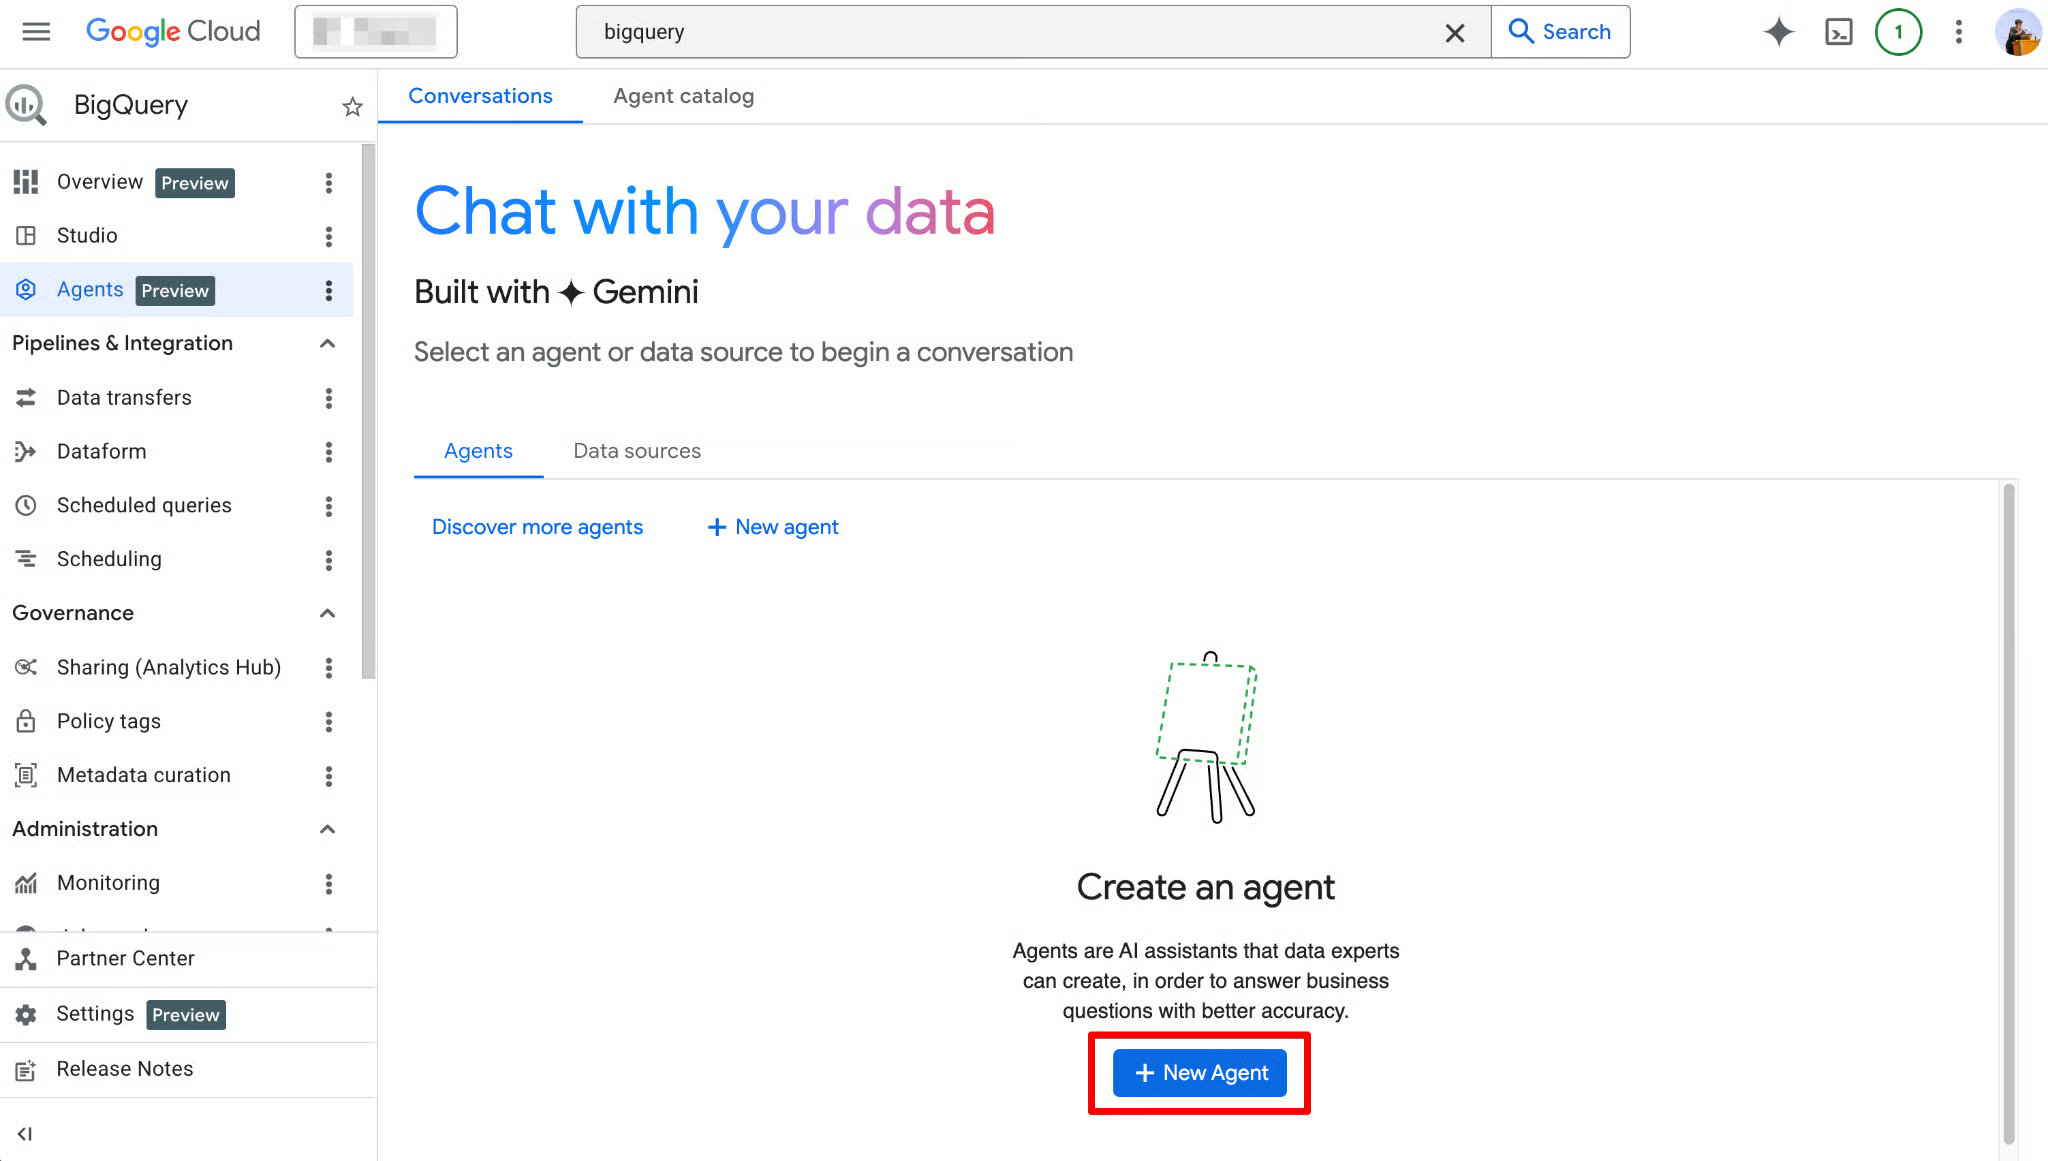
Once enabled, the Agents page becomes fully functional. You should now see the new agent page:
The Agent Catalog is used to create, manage, and version data agents within BigQuery Studio.
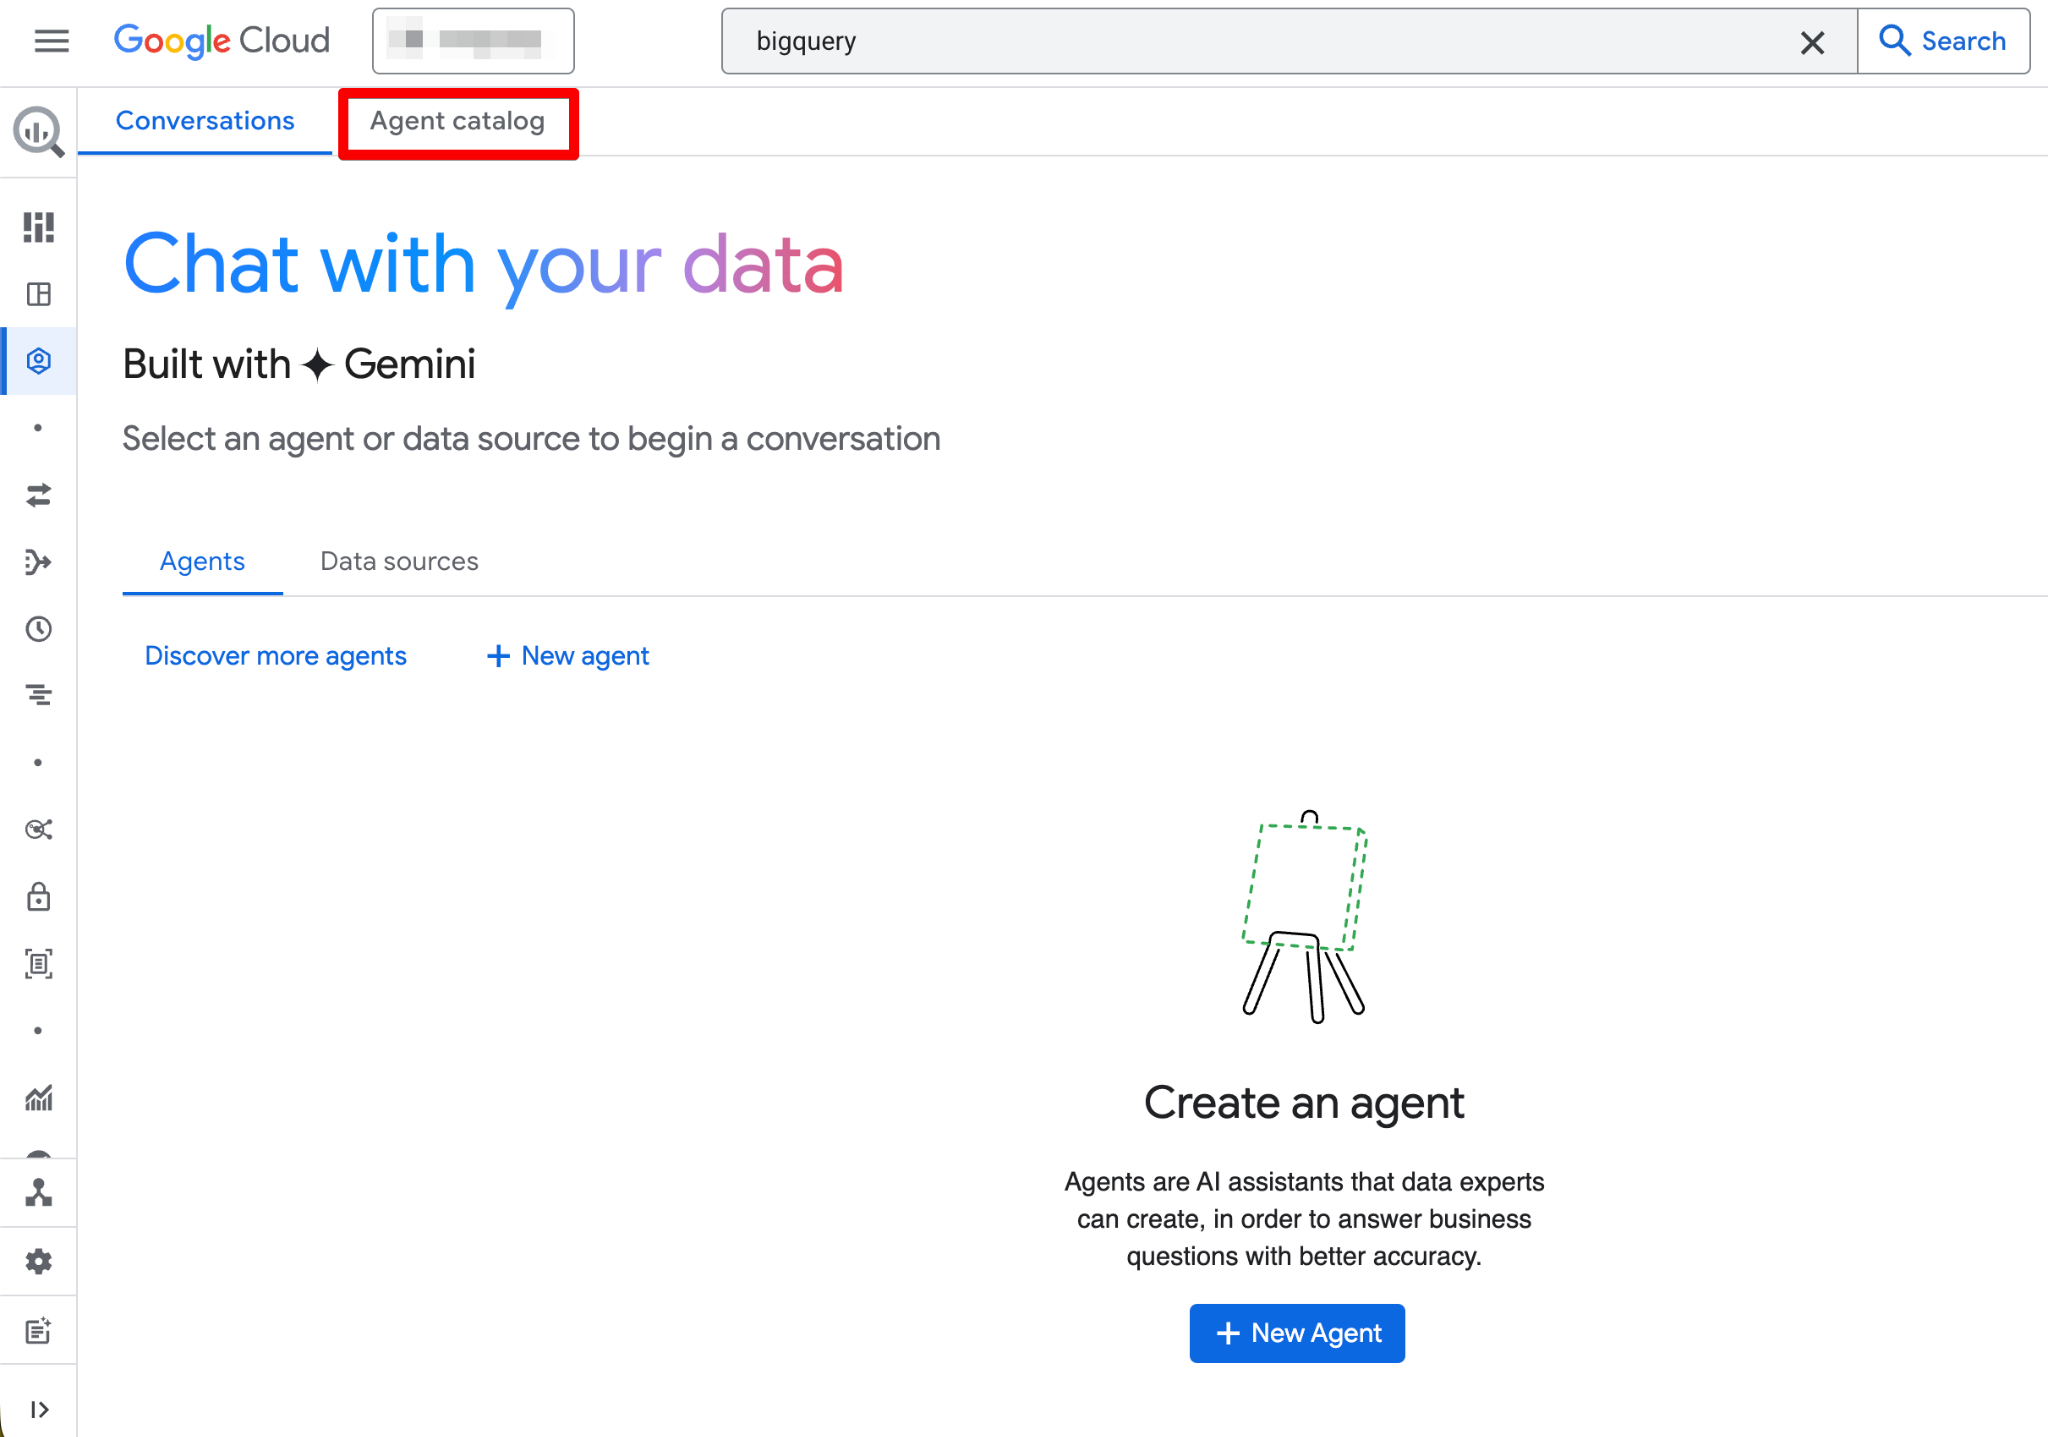
Here’s what you’ll find in the Agent Catalog:
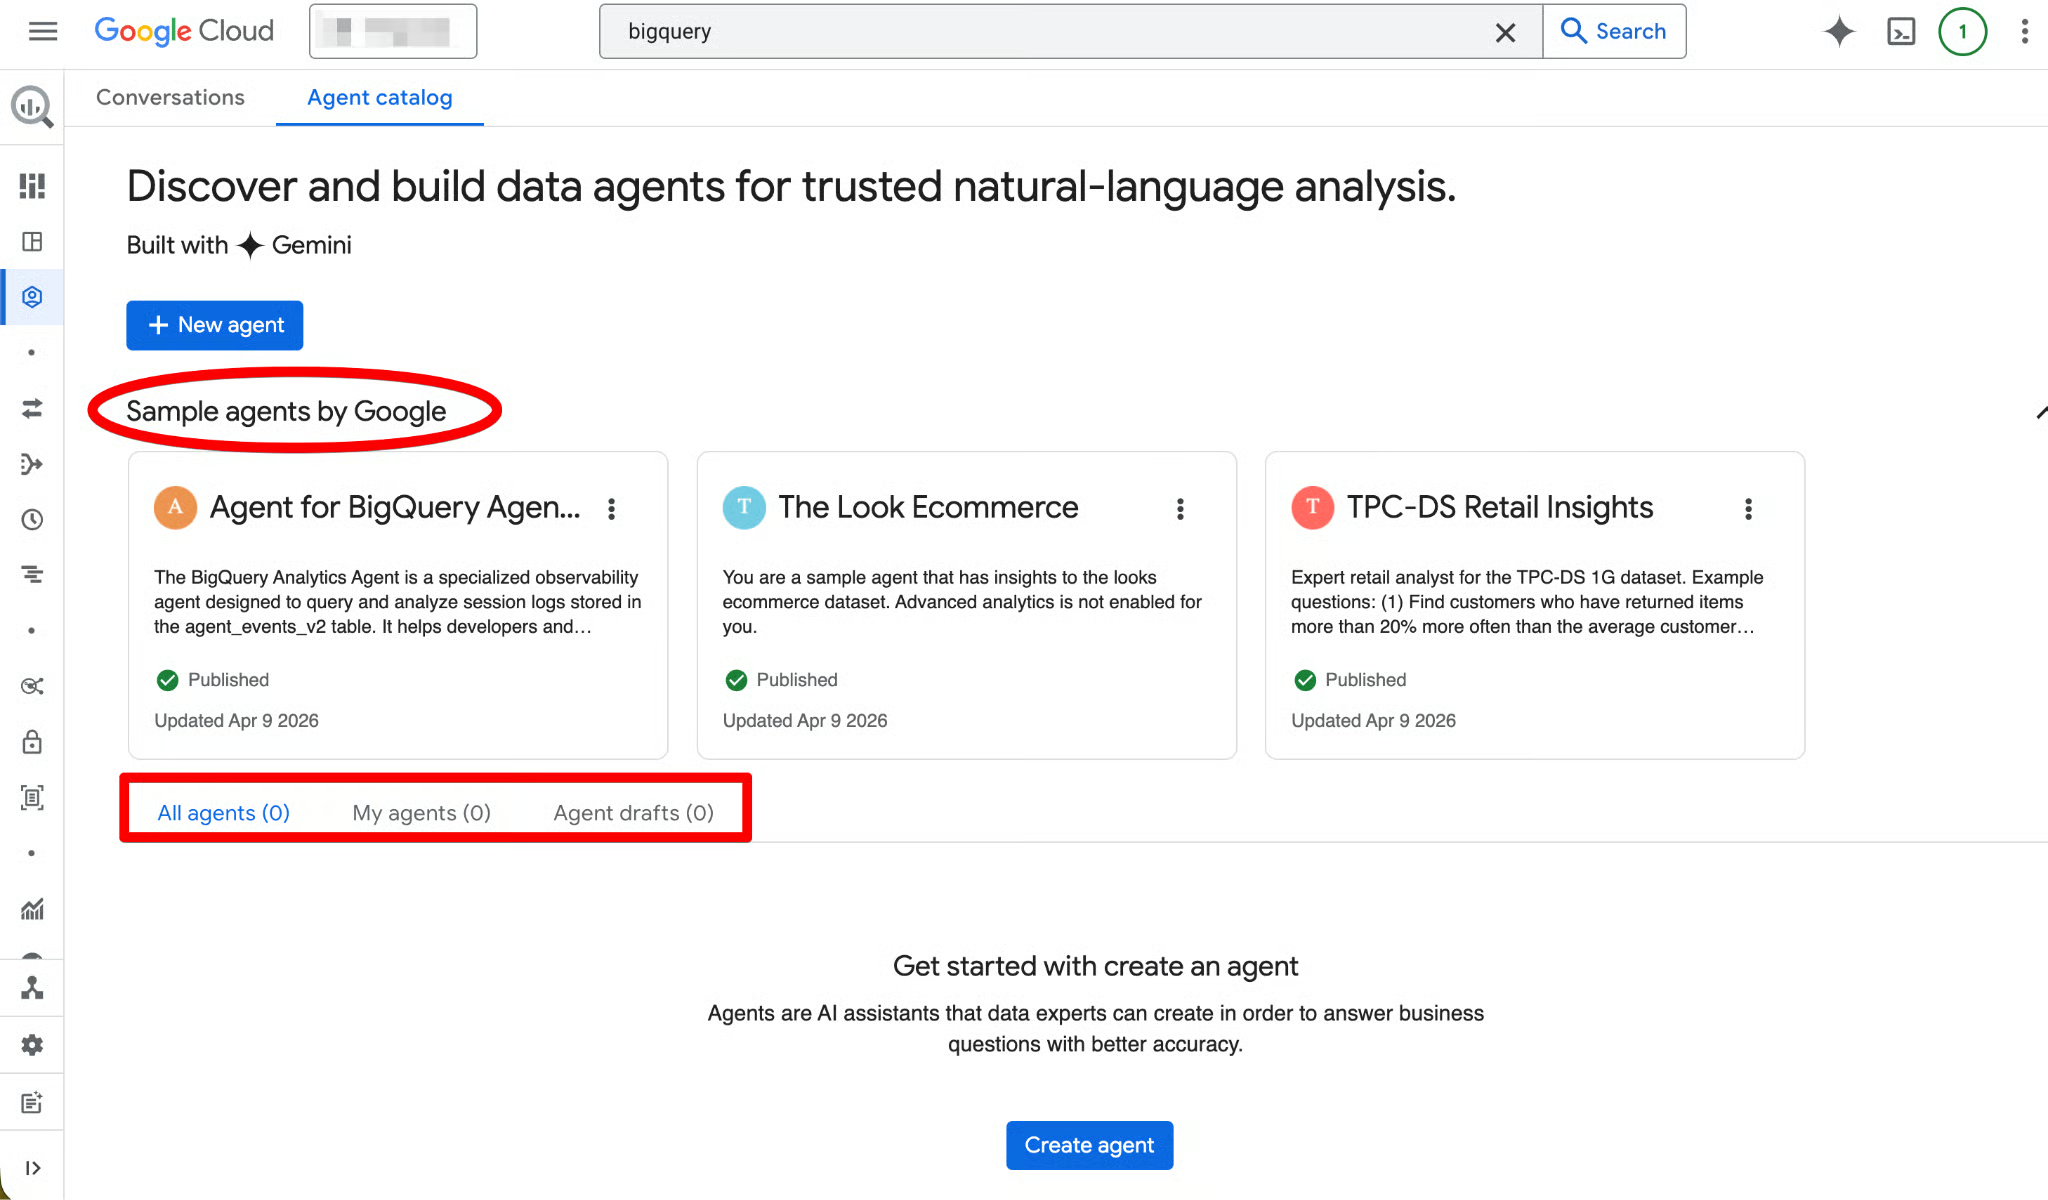
The agent lifecycle follows this structure (Draft → Created → Published):
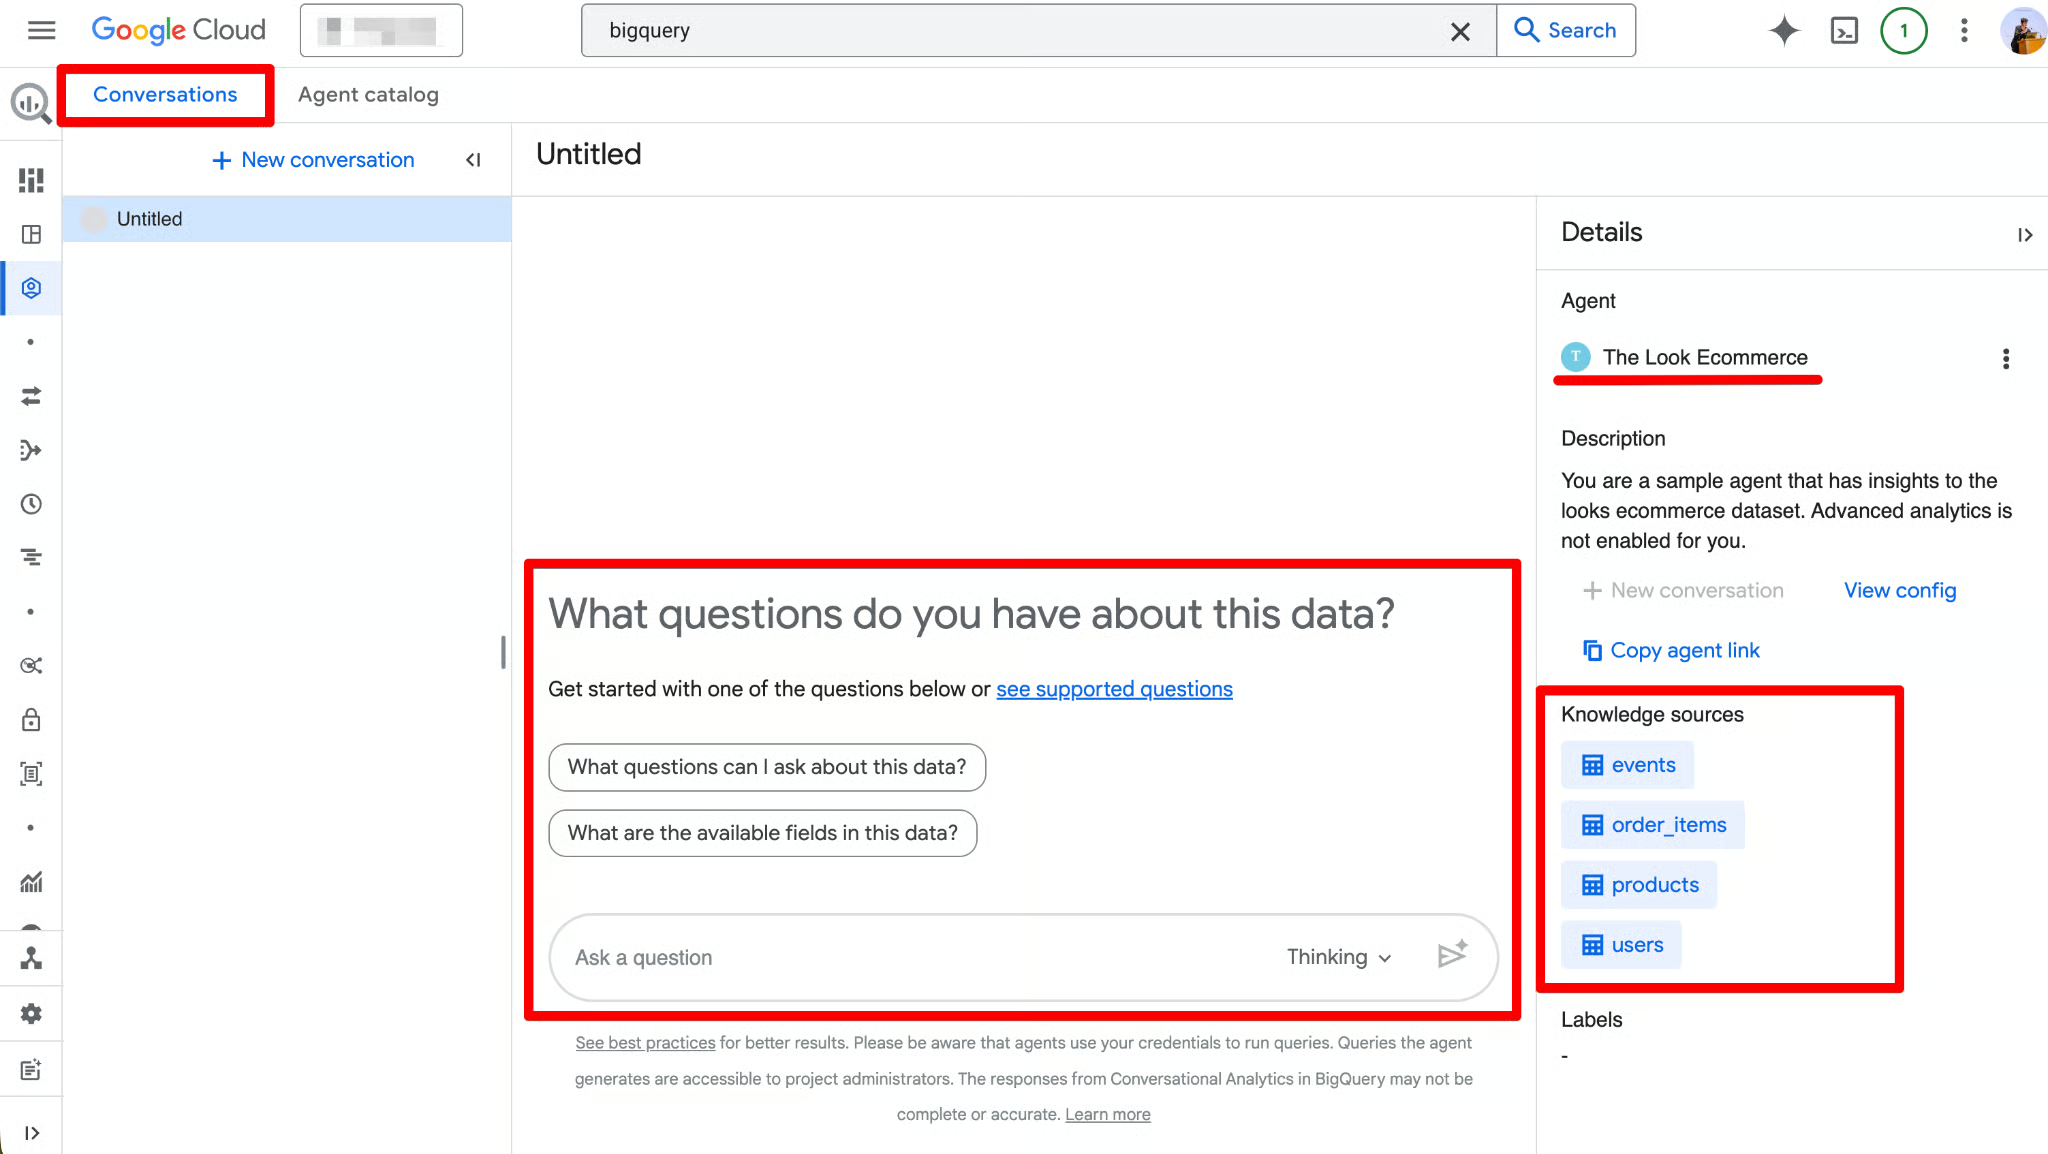
Click any agent card to open it, view details, start a conversation, or edit (if you have Owner permissions). The interface also includes a Conversations tab where you can manage past chats with agents or data sources.
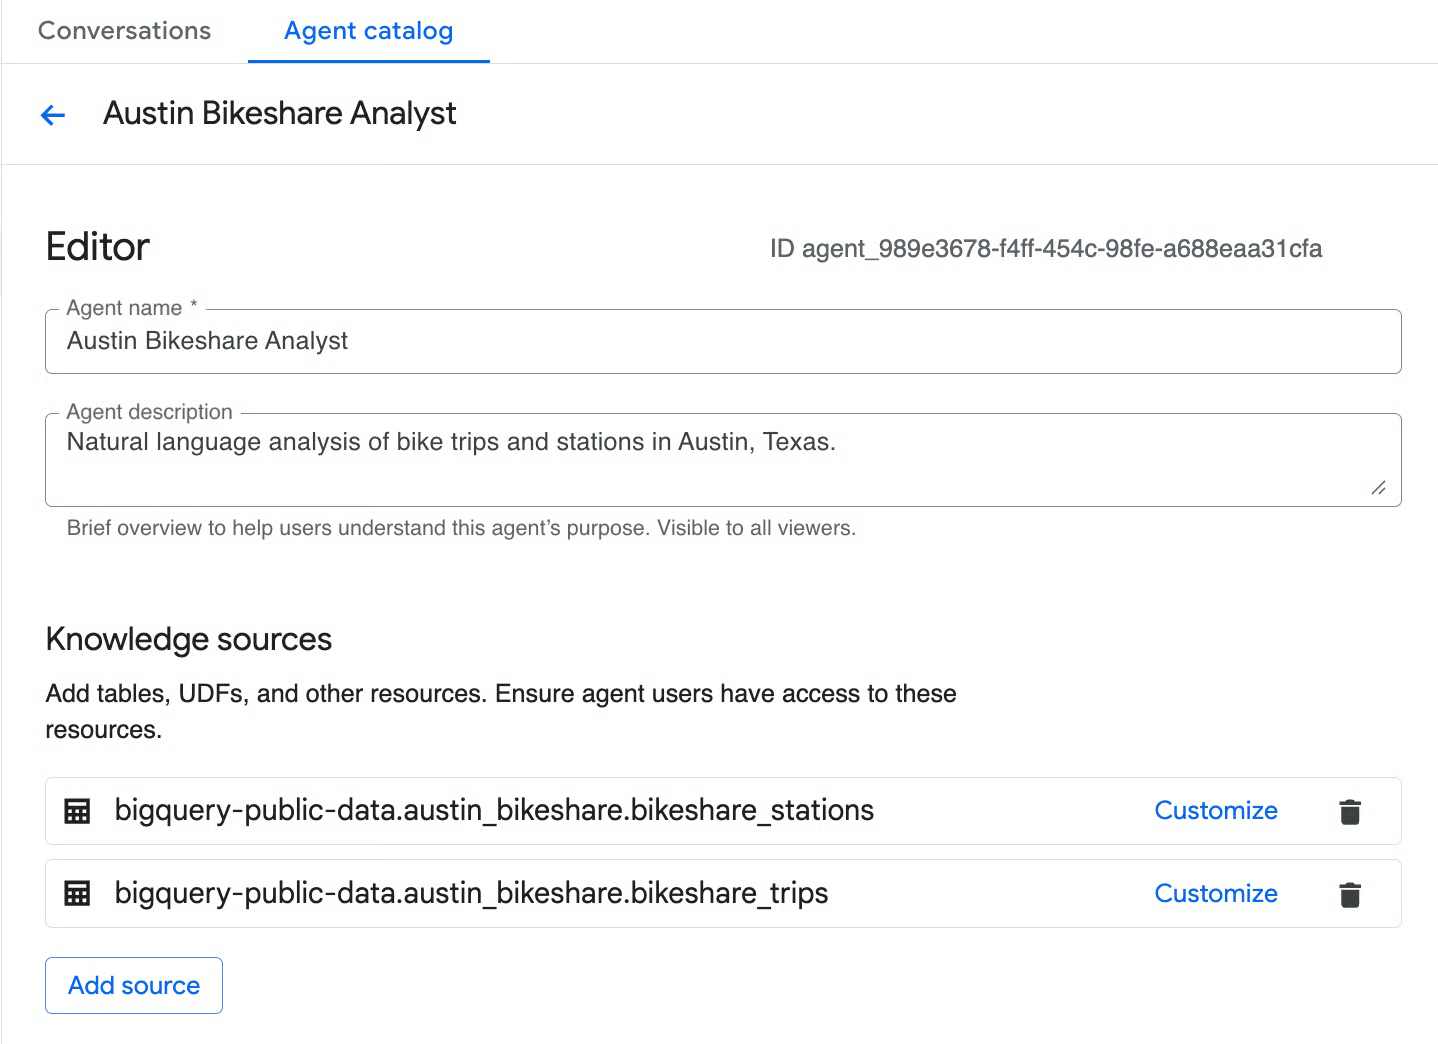
Now that the foundation is set, let’s build a Data Agent from scratch. We will use the bigquery-public-data.austin_bikeshare dataset to transform raw trip data into a conversational interface. We’ll use two tables:
bikeshare_trips — detailed trip-level data
bikeshare_stations — station metadata
Starting the agent creation
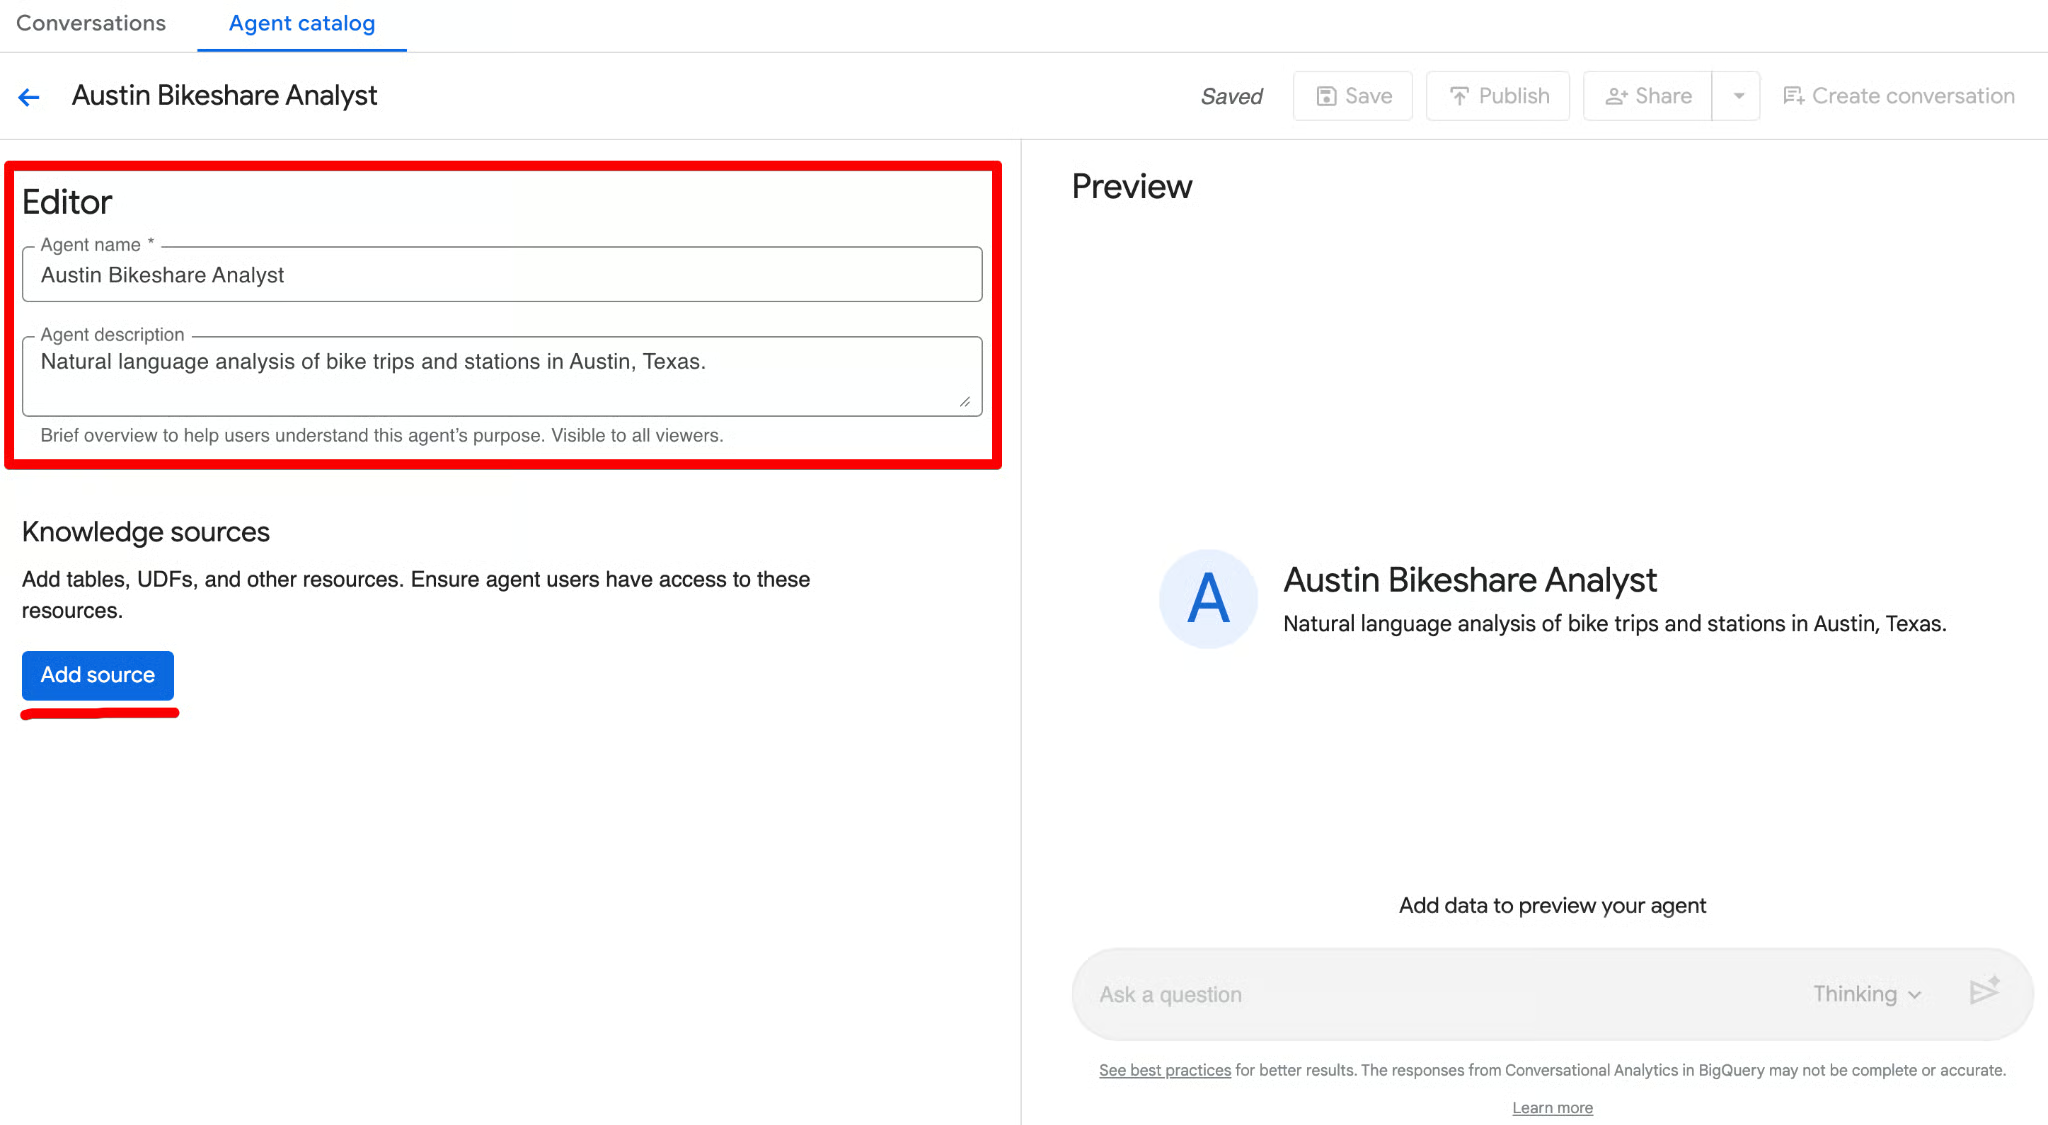
These two fields help you quickly identify the agent later. Once they’re set, you’re ready to configure the three core building blocks we covered earlier: knowledge sources, instructions, and (later) verified queries.
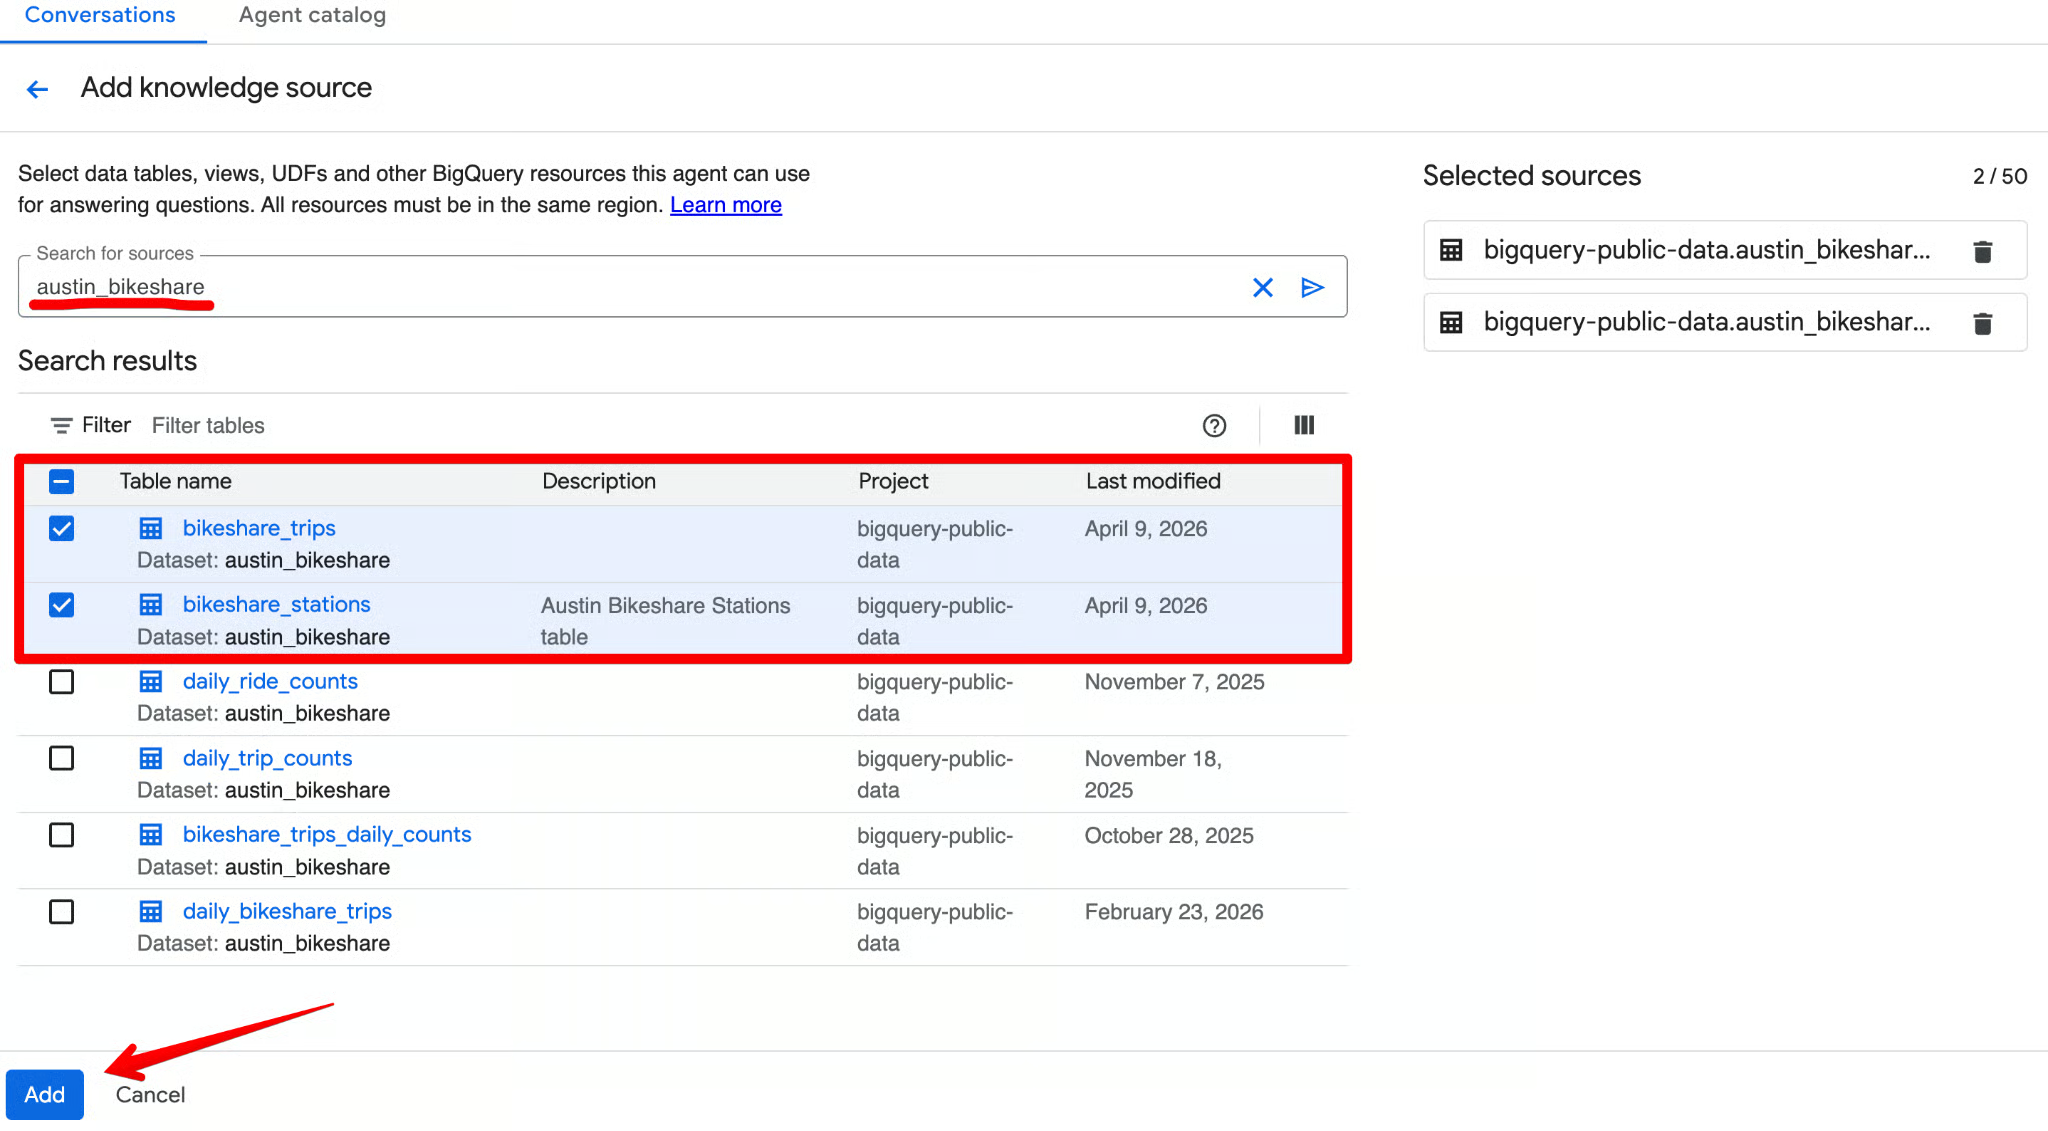
Knowledge sources define exactly what data the agent can access. The fewer and more focused the sources, the better the accuracy and the lower the cost. In the Knowledge sources section of the editor, click Add source. Search for austin_bikeshare and select bikeshare_trips and bikeshare_stations as the sources.
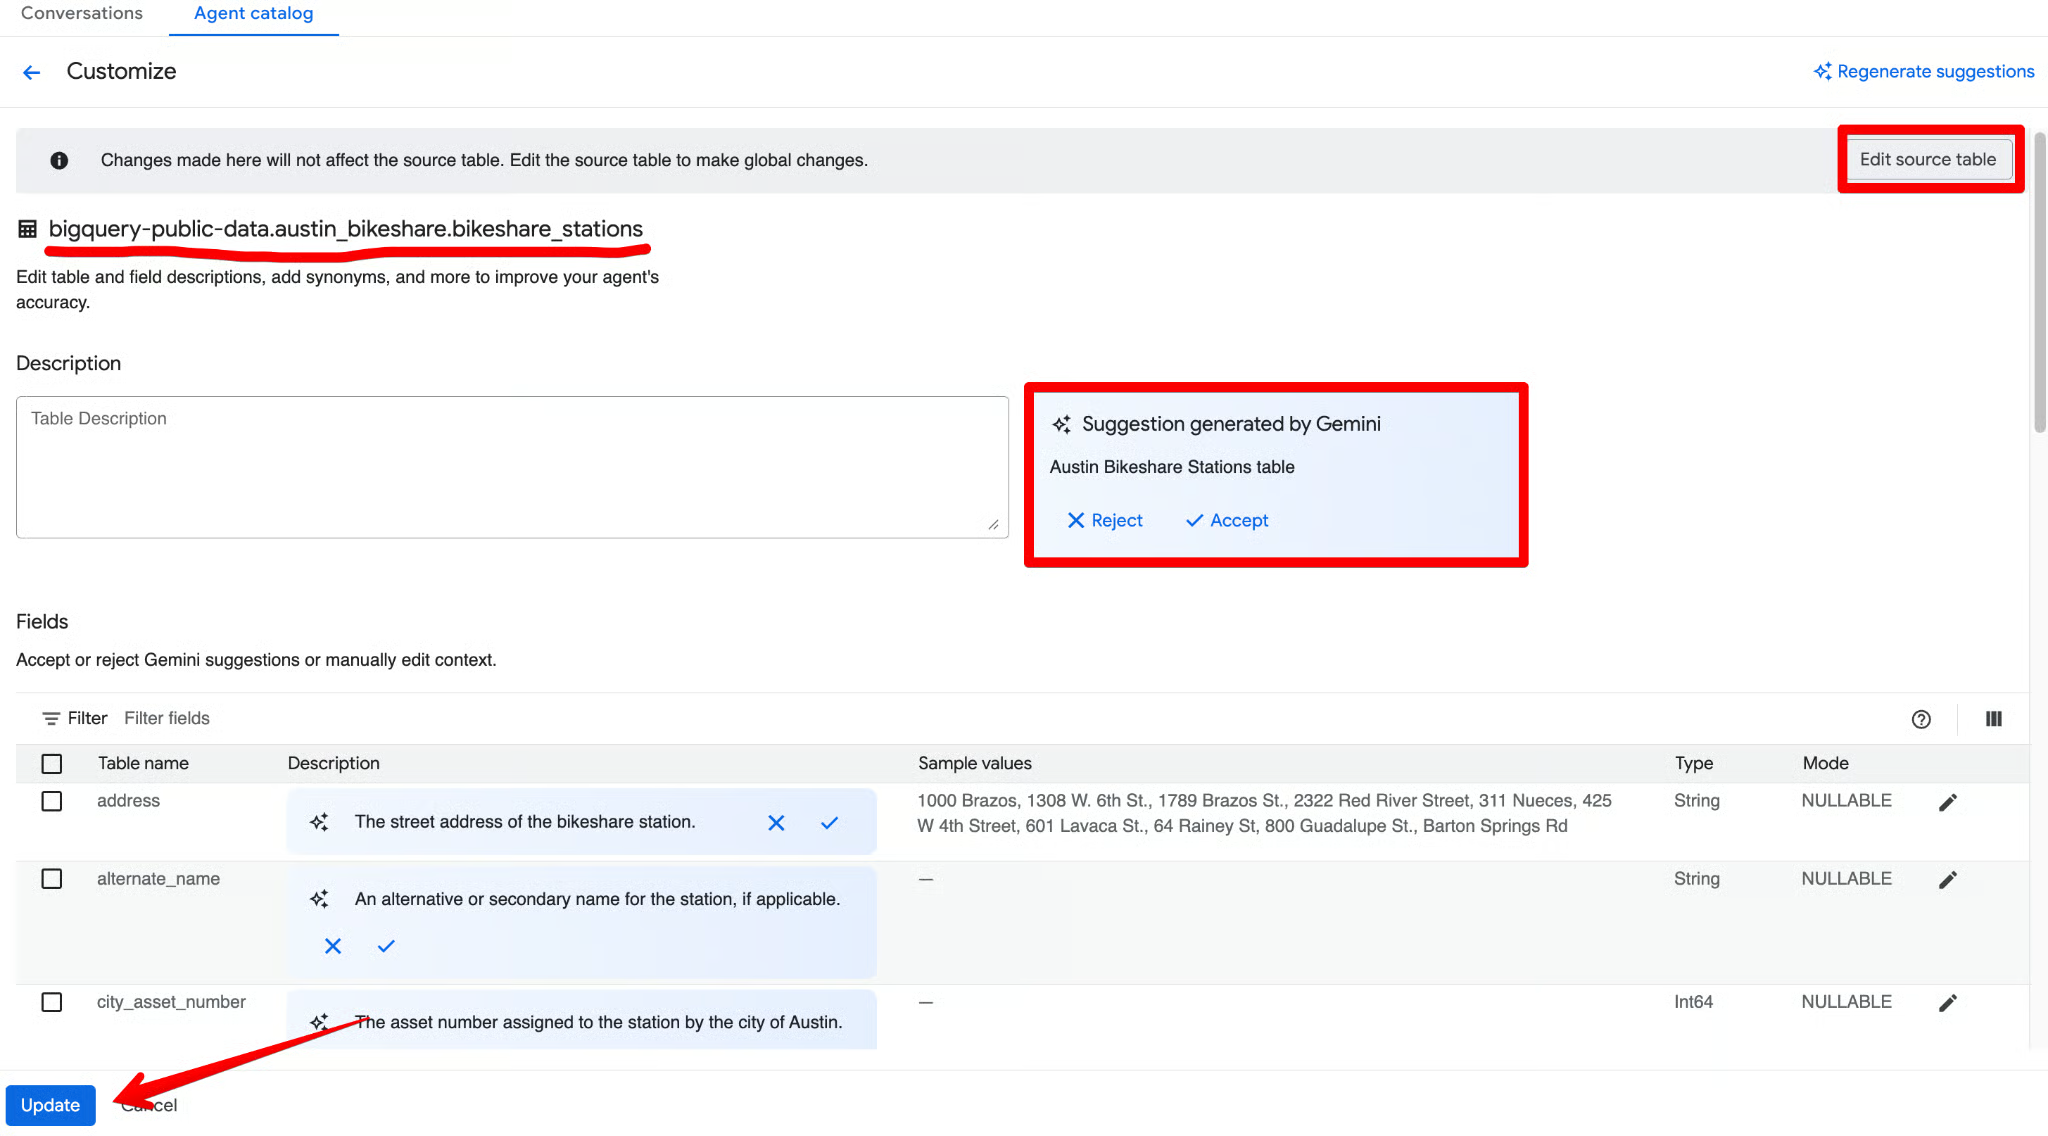
For each table you add, click Customize.
Gemini will automatically generate a description and suggest column metadata. Review everything, accept the accurate suggestions, make any tweaks, and click Update.
A common mistake is adding 50 tables at once. Start with 2–3 core tables. This makes it easier to debug the agent's logic. You can always expand the knowledge later once the core queries are accurate.
Next, you need to ground your agent with instructions. Rather than just writing a generic text prompt (e.g., "Answer questions about sales"), BigQuery’s data agent interface allows you to provide highly structured context to guide the AI's query generation. Think of this as onboarding a new analyst with your company’s exact data dictionary.
Use the Instructions field to provide structured business context. Here’s a complete, ready-to-use example you can paste:
Synonyms: Define alternative terms for your columns so the agent understands natural language variations. Example: "Journey", "Ride", and "Commute" all refer to a record in the bikeshare_trips table. "Dock", "Hub", or "Station" refers to a record in the bikeshare_stations table.
Key fields: Highlight the most important fields for analysis. This tells the agent which columns to prioritize when a user's question is broad. Example: Prioritize trip_id, start_station_name, end_station_name, subscriber_type, start_time, and duration_minutes for general reporting.
Excluded fields: Specify columns that the data agent should strictly avoid. This is incredibly useful for hiding deprecated columns or irrelevant data. Example: Do not use the bike_id column in the bikeshare_trips table for most analysis, as it is rarely needed for business questions.
Filtering and grouping: Instruct the agent on standard ways to slice the data. Example: Unless specified otherwise, always filter out trips where duration_minutes < 1 (these are false starts or test rides). Default to grouping data by start_station_name when the user asks for “by station” or “top stations”.
Join relationships: Since our agent pulls from multiple tables, explicitly define how they connect. This ensures the agent doesn't guess the wrong foreign keys. Example: Join the bikeshare_trips table to the bikeshare_stations table by matching bikeshare_trips.start_station_id to bikeshare_stations.station_id (and similarly for end_station_id).
You can combine all of the above into one clean block in the Instructions field. Here’s a polished, ready-to-paste version that incorporates the structured guidance:
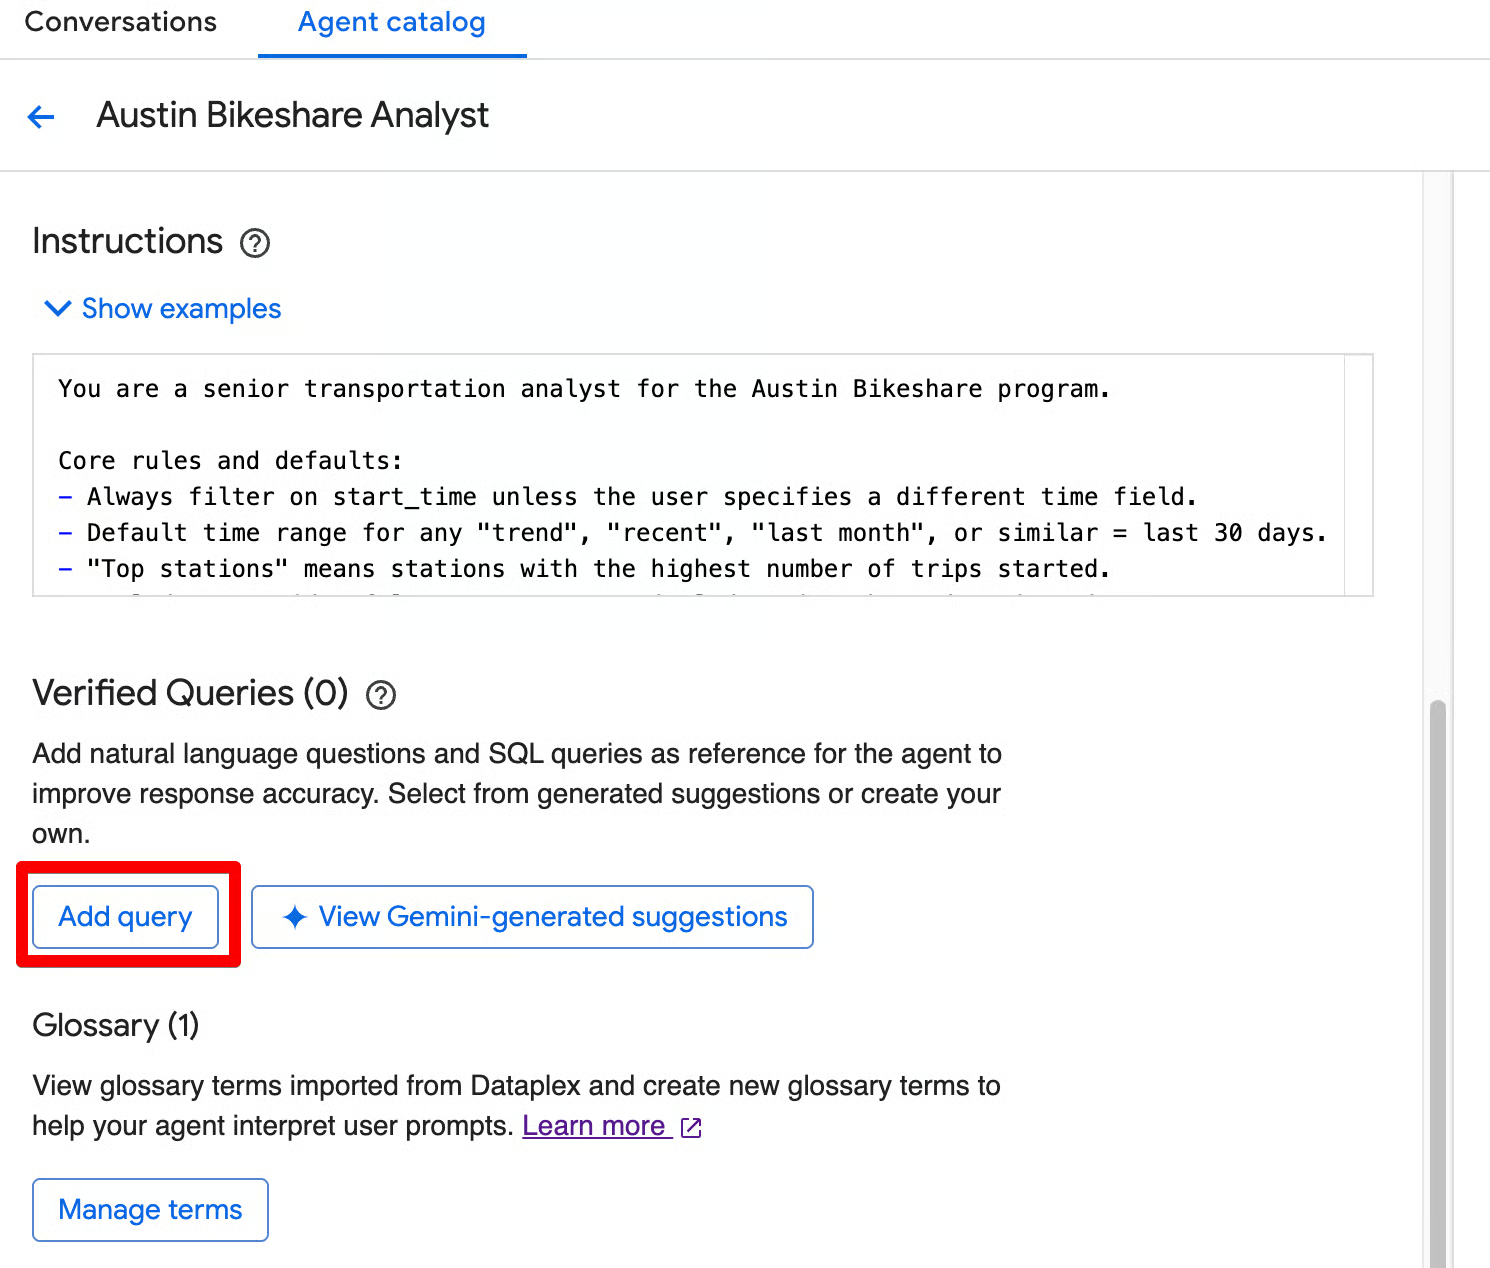
You are a senior transportation analyst for the Austin Bikeshare program.
Core rules and defaults:
- Always filter on start_time unless the user specifies a different time field.
- Default time range for any "trend", "recent", "last month", or similar = last 30 days.
- "Top stations" means stations with the highest ridership (highest number of trips started).
- Exclude false start rides/test rides: never include trips where duration_minutes < 1.
- Display station names in final results; use station_id only for joins.
- Prefer clear, readable visualizations: bar charts for rankings, line charts for time-based trends.
Key fields: Prioritize trip_id, start_station_name, end_station_name, subscriber_type, start_time, and duration_minutes for most analyses.
Join relationships: Join bikeshare_trips to bikeshare_stations on bikeshare_trips.start_station_id = bikeshare_stations.station_id (and similarly for end_station_id).
Persona framework (very effective): Begin your instructions with a clear persona statement. This sets the tone, depth of analysis, and output style (e.g., “You are a senior transportation analyst…”).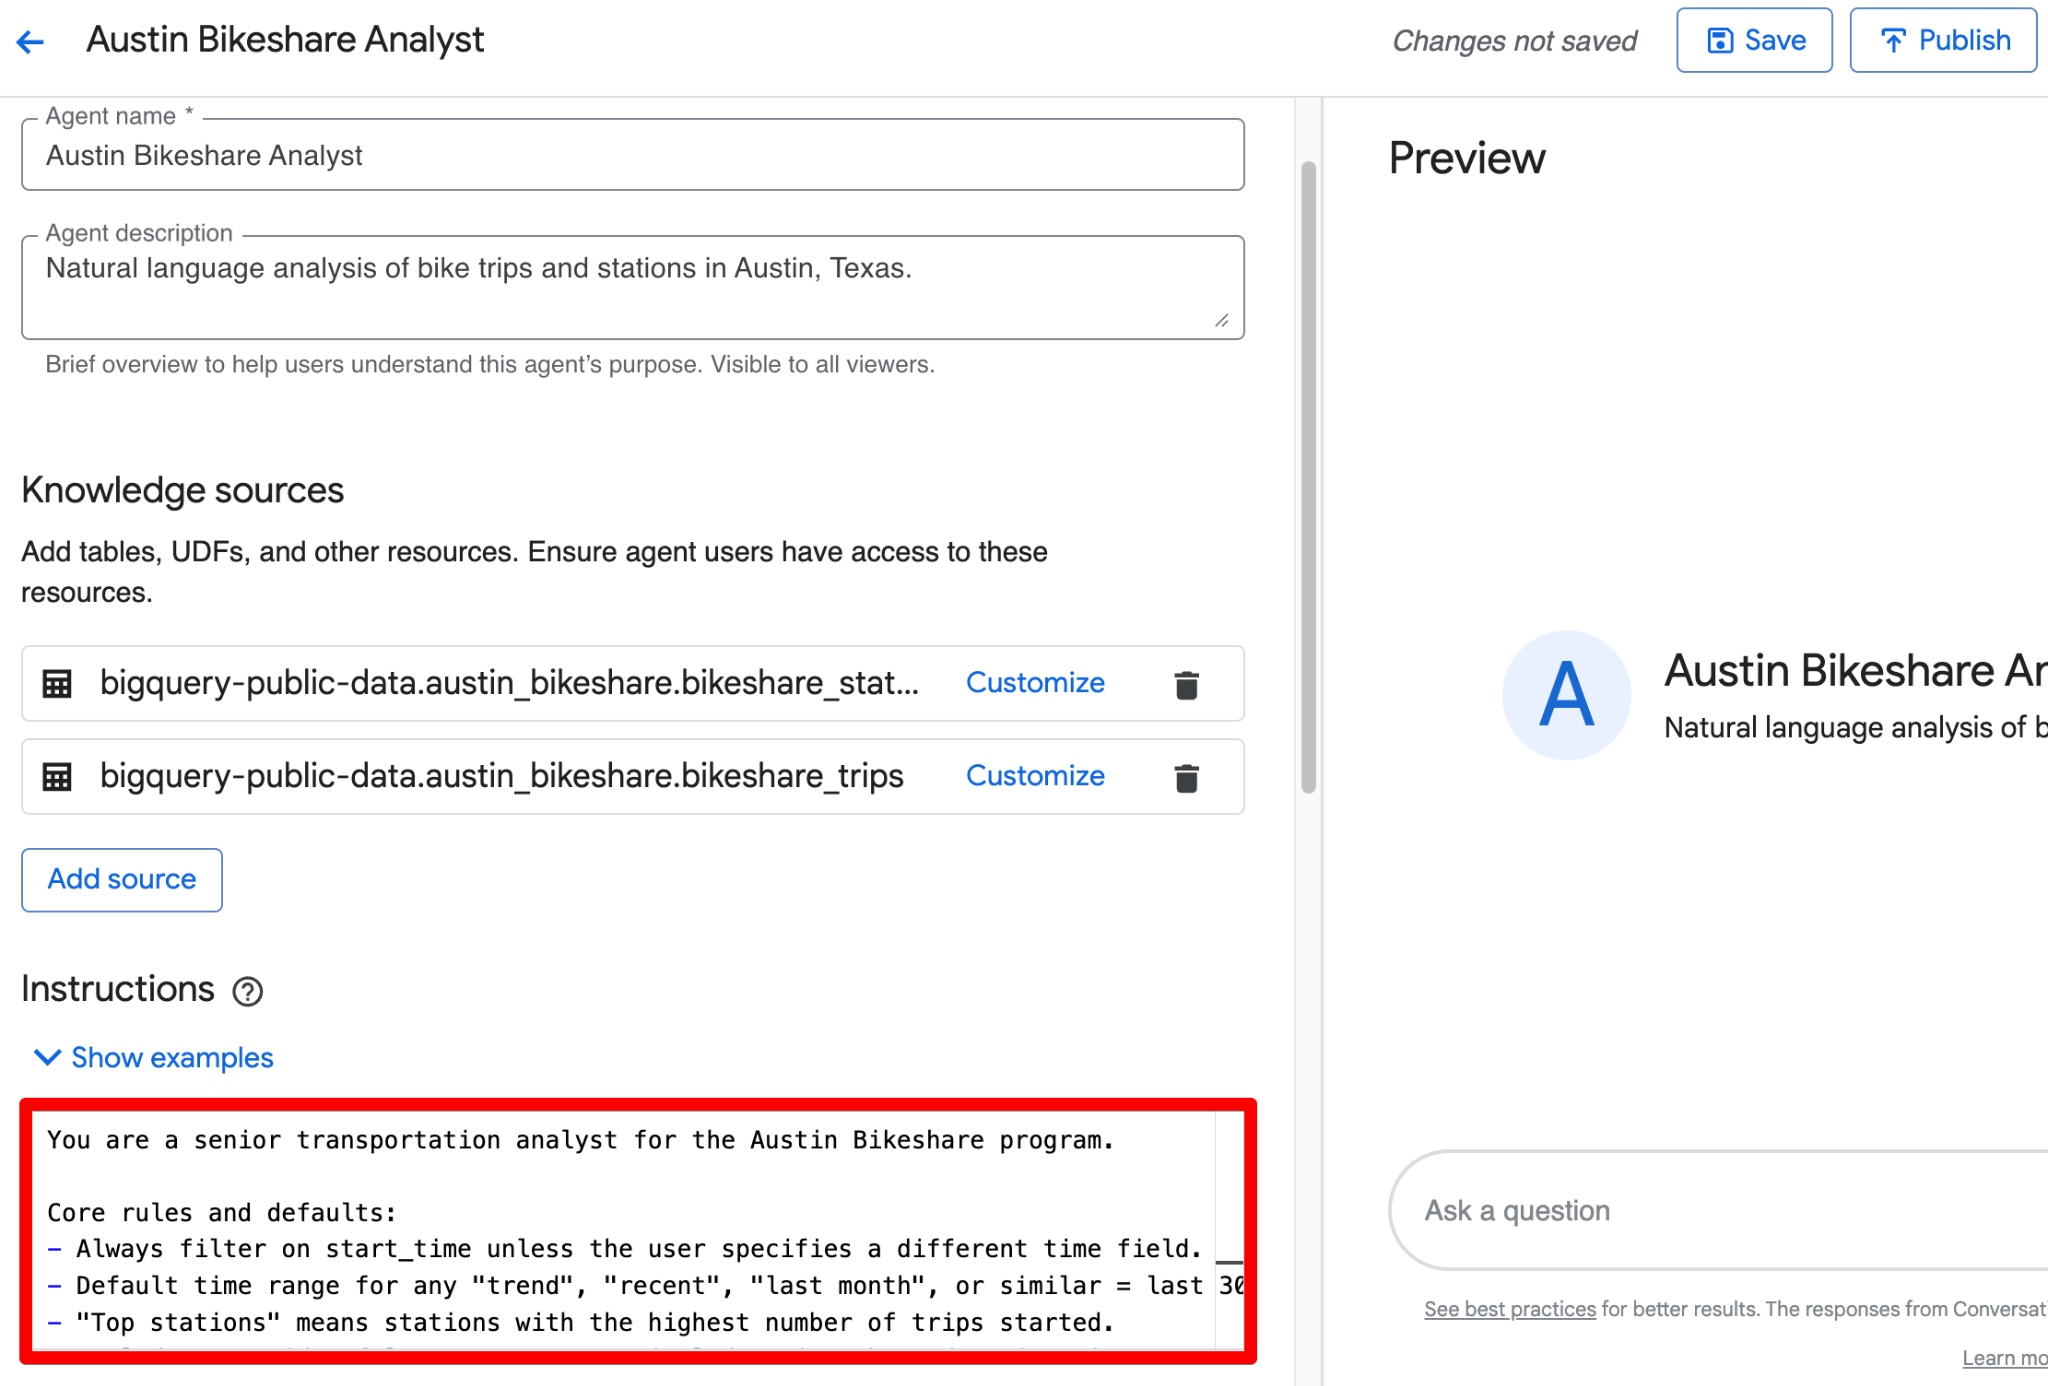
Why this matters: If you leave these fields blank, an ambiguous question like "What were our top sales?" might cause the agent to join the wrong tables, pull from inactive accounts, or include deprecated data. By structuring your instructions across these five categories, you ensure the generated SQL strictly adheres to your established business logic.
In addition to instructions, you can (and should) define glossary terms directly in the agent. These help the agent interpret business jargon, abbreviations, and derived concepts consistently.
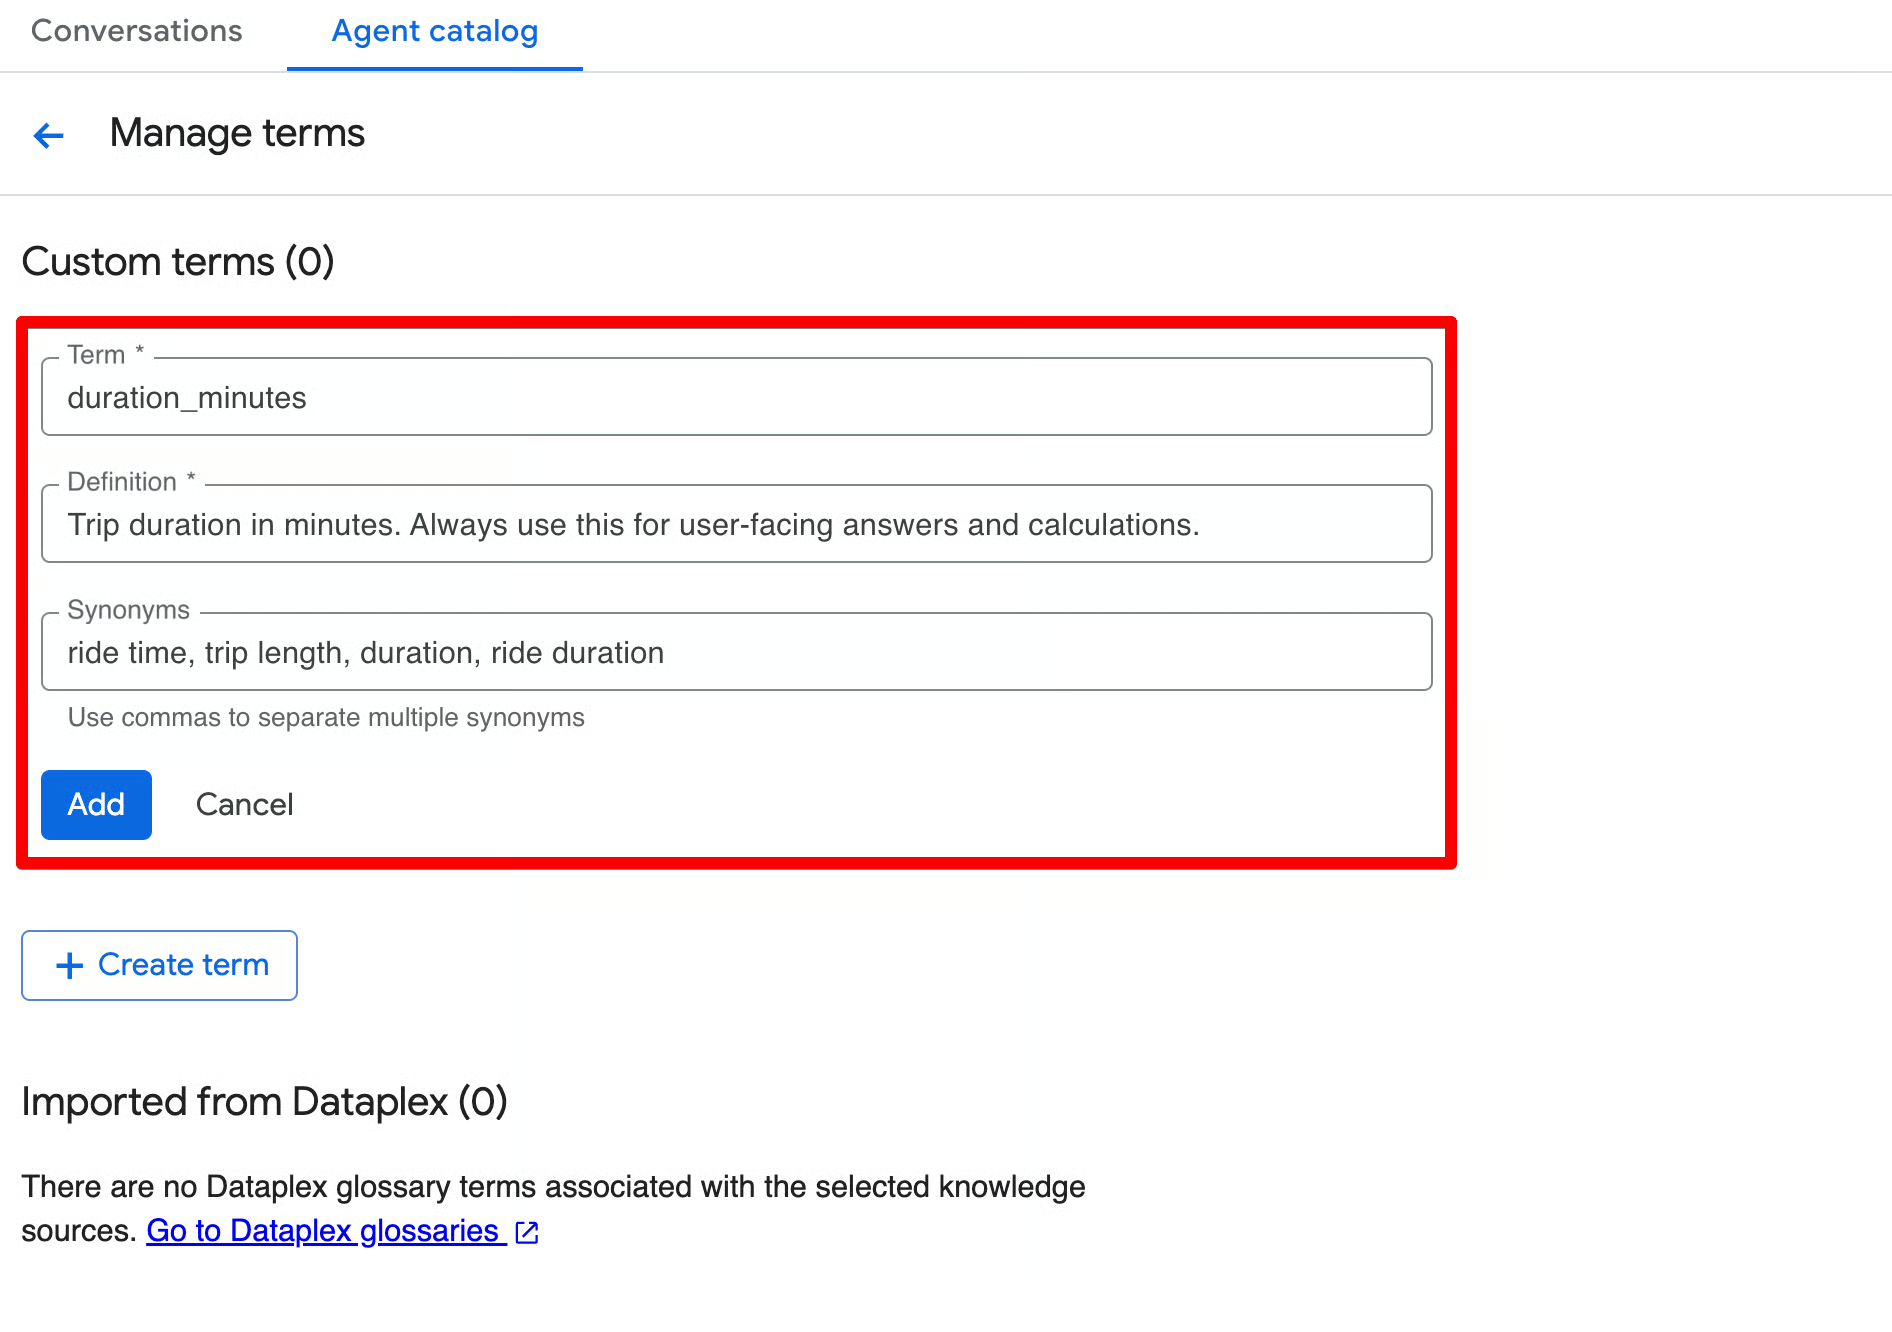
Click Add term in the Glossary section (usually near Instructions) and create terms with a term, definition, and synonyms (comma-separated).
Here are recommended glossary terms for the Austin Bikeshare dataset:
| Term | Definition | Synonyms |
duration_minutes |
Trip duration in minutes. Always use this for user-facing answers and calculations | ride time, trip length, duration, ride duration |
ridership |
The total number (count) of bike trips started | trips, rides, journeys, bike usage, commute count |
peak_hours |
Morning peak (7-9) or evening peak (16-19) hours based on the hour extracted from start_time |
rush hour, busy hours, high demand period |
subscriber_type |
Type of rider — Subscriber (monthly or annual pass holder) or Customer (one-time ride | user type, membership type, pass holder, member, casual rider |
false_start |
A very short trip (usually under 1 minute) that is likely a test ride or accidental unlock. These should normally be excluded from the analysis | test ride, invalid trip, short trip |
You can add more terms as needed (for example, for start_station_name, end_station_name, or derived metrics like “average trip duration” or “long ride”).
By using glossaries, if leadership decides to change the official definition of a “Long Ride” to 45 minutes next quarter, your data governance team only has to update it once in Dataplex. Every Data Agent connected to that glossary will immediately adopt the new logic, so you’ll keep it consistent across the organization.
Once you’ve configured the knowledge sources, instructions, and glossary terms, it’s time to test your agent before publishing.
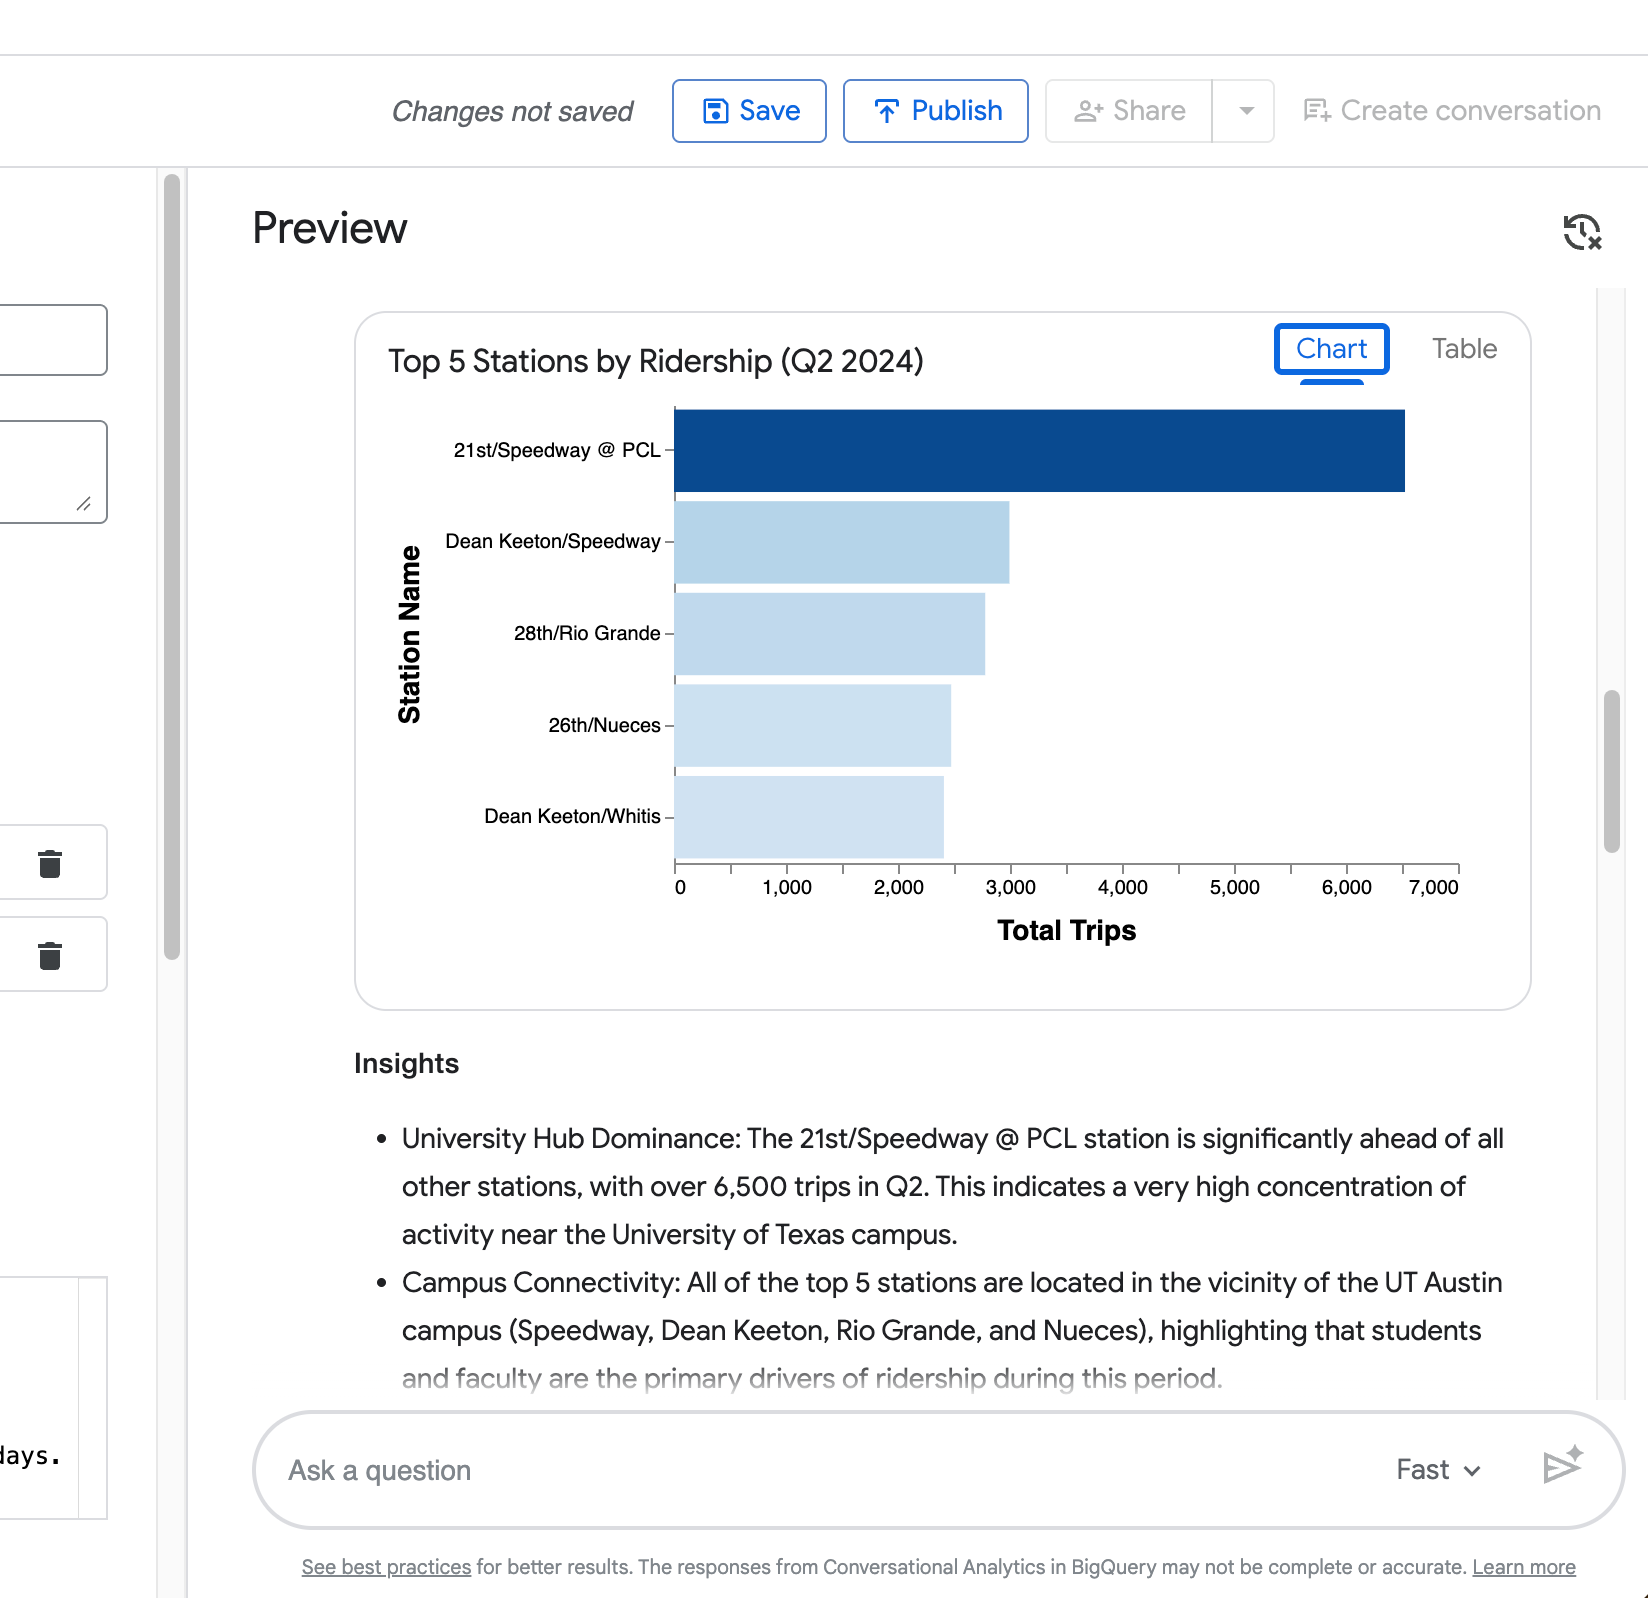
Scroll to the right side of the screen to the Preview pane. This live chat interface lets you interact with your agent in real time as you build it. You can ask questions, review the agent’s reasoning, inspect the generated SQL, and iterate quickly.
The Preview pane shows:
Try these four queries of increasing complexity (adjusted to match the dataset’s data range up to 2024):
What you’ll see in the agent’s response:
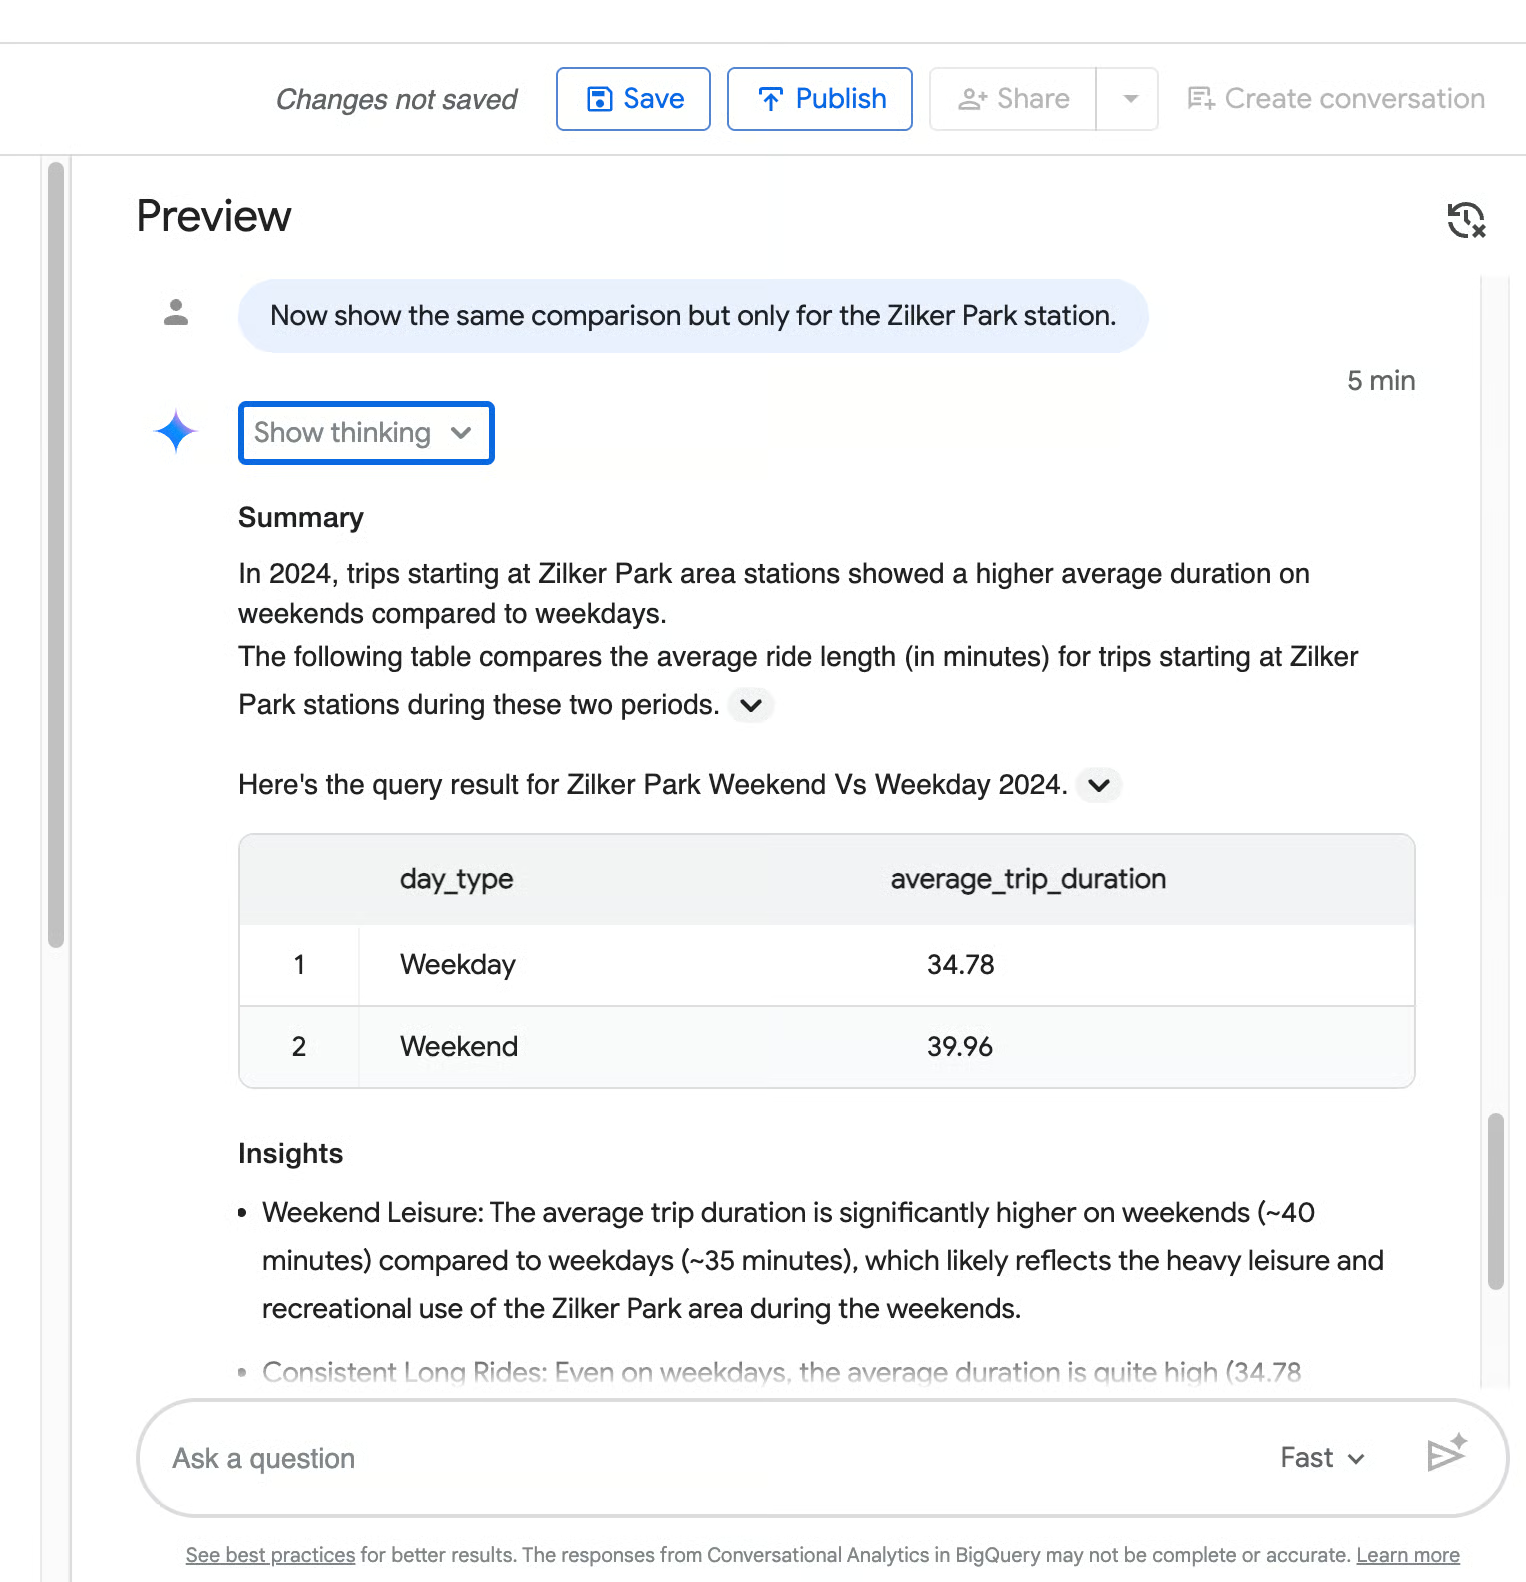
Summary — A natural-language explanation of the results.
Query result — A clean table with the data (e.g., total trips, top stations, or average duration).
Insights — Bullet-point takeaways that interpret the results in a business context.
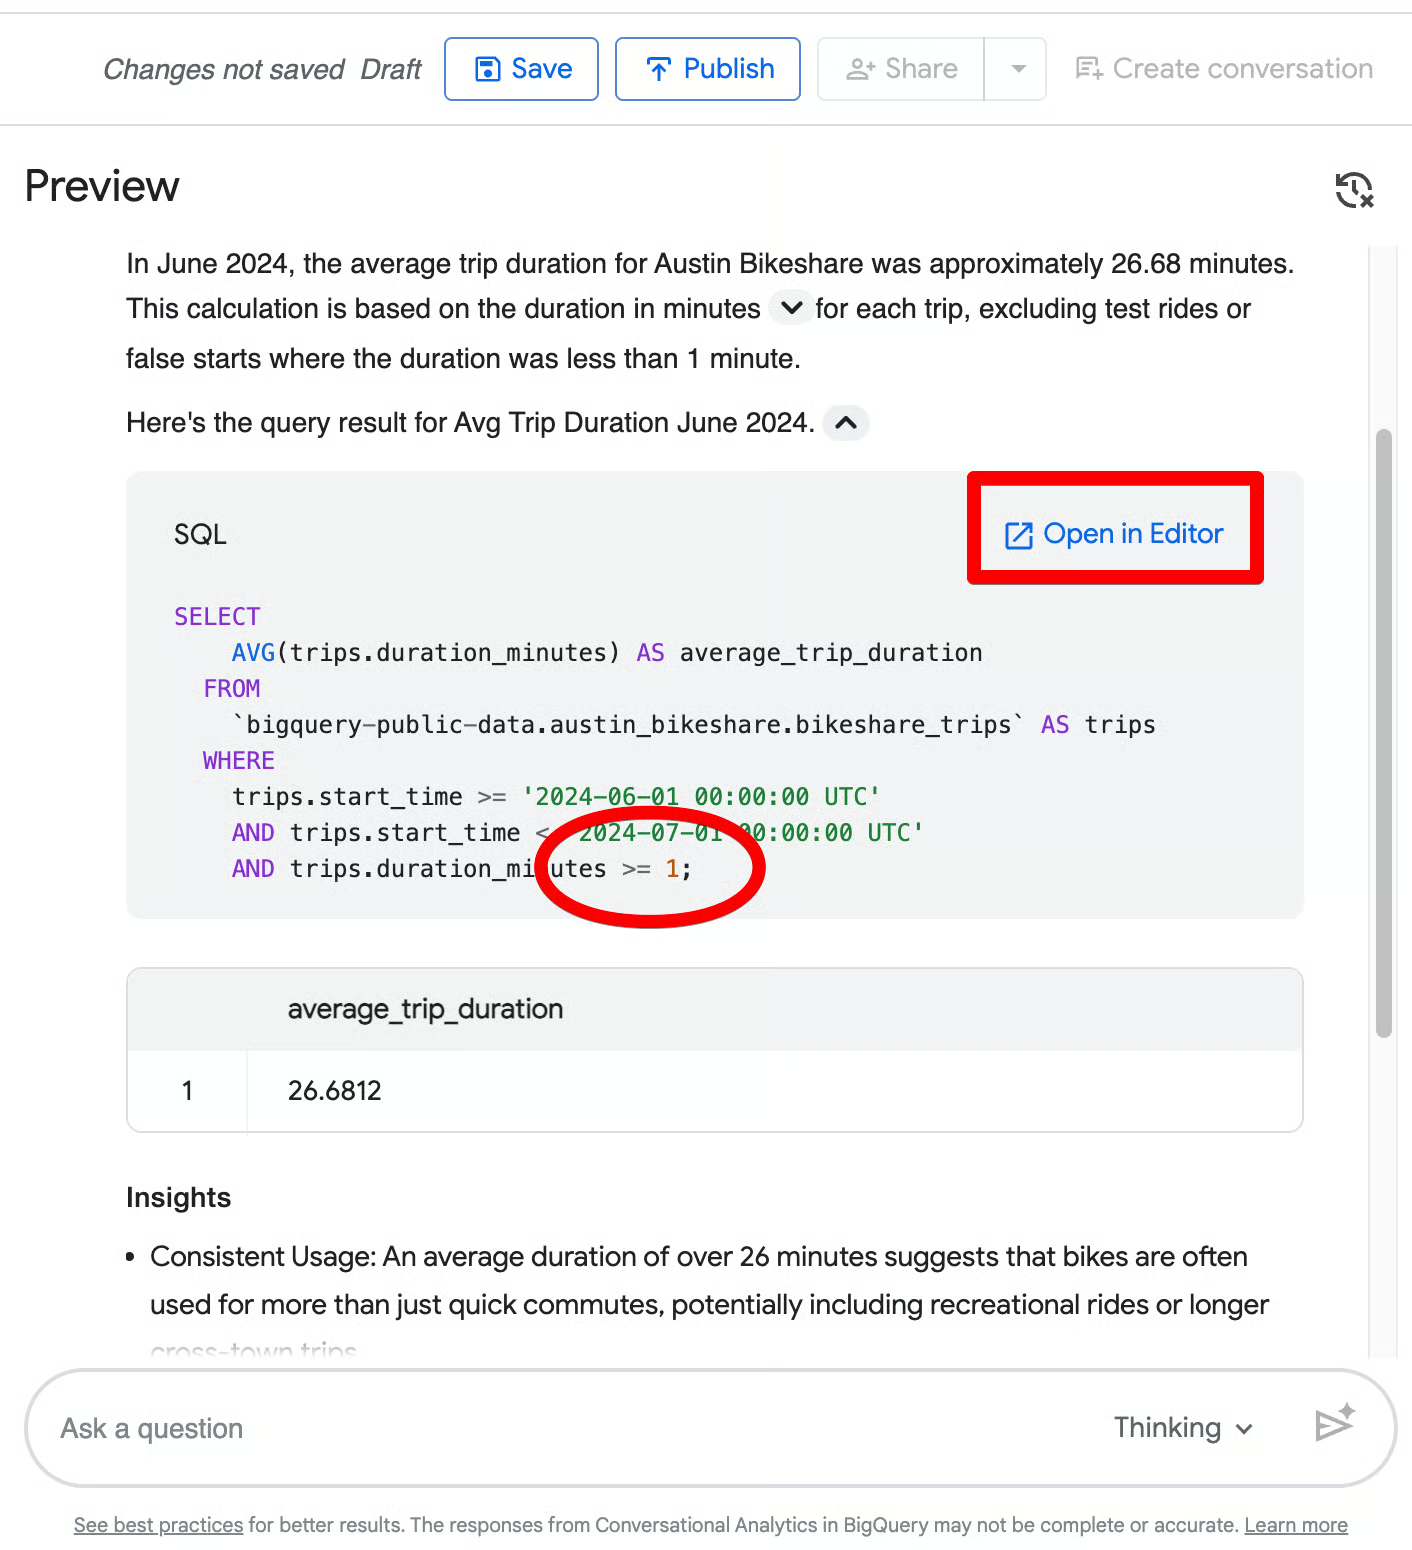
Generated SQL — Click Open in Editor to view the full SQL query the agent created (you’ll see it correctly filters on start_time and applies duration_minutes >= 1 to exclude false start rides).
Suggested follow-up questions — Helpful prompts at the bottom (e.g., “What were the top 10 start stations in June 2024?”, “Forecast the daily number of trips…”, etc.).
Visualization — An automatically generated chart (bar chart for rankings, as seen in your top 5 stations example).
Your fourth query (“Now show the same comparison but only for the Zilker Park station”) demonstrates the agent’s ability to retain context from the previous question.
As you can see from the following screenshot, it correctly narrows the weekday vs weekend duration comparison to Zilker Park without you repeating the full request.
Testing tips:
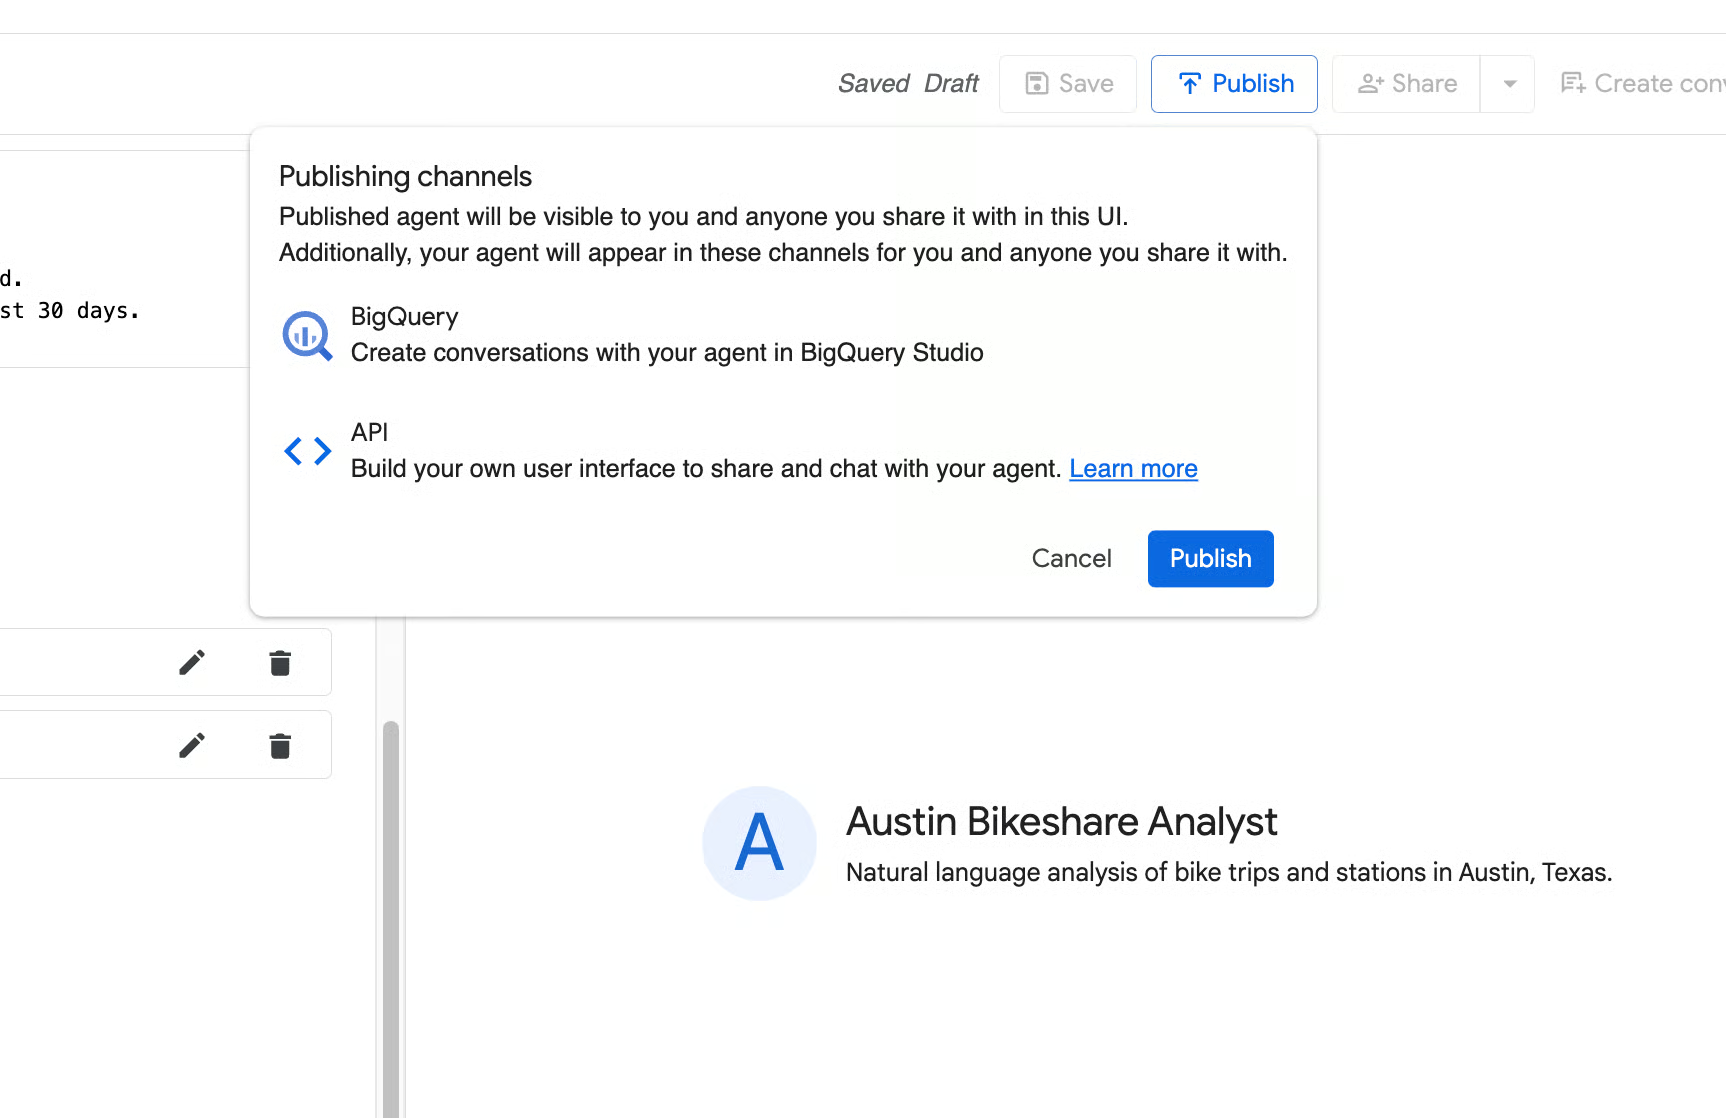
Once the agent consistently gives clear, accurate, and well-structured answers, click Save at the top, then Publish. Your Austin Bikeshare Analyst agent is now ready for use!
Even with good instructions and glossary terms, your data agent may still occasionally misinterpret business rules or generate inconsistent answers.
Verified queries solve this by letting you explicitly teach the agent the correct way to handle important or frequently asked questions. Each verified query consists of a natural language question paired with the exact SQL that should be used.
They serve as high-quality examples that anchor the agent’s reasoning and are one of the most effective ways to move from a “good enough” agent to a production-ready one.
In the agent editor, scroll to the Verified Queries section. You have two easy ways to add verified queries:
Click Add query. You’ll see the Add verified query screen, where you can:
Click View Gemini-generated suggestions. This opens the “Review suggested verified queries” screen, where Gemini proposes relevant questions based on your knowledge sources.
You can:
A good verified query for the Austin Bikeshare dataset could be:
Question:
What were the top 5 stations by ridership in Q2 2024?SQL:
WITH
 QuarterlyRidership AS (
   -- Count trips starting at each station
   SELECT start_station_id AS station_id, COUNT(trip_id) AS ridership_count
   FROM bigquery-public-data.austin_bikeshare.bikeshare_trips
   WHERE TIMESTAMP_TRUNC(start_time, QUARTER) = TIMESTAMP '2024-04-01 00:00:00'
   GROUP BY start_station_id
   UNION ALL
   -- Count trips ending at each station
   SELECT
     CAST(end_station_id AS INT64) AS station_id,
     COUNT(trip_id) AS ridership_count
   FROM bigquery-public-data.austin_bikeshare.bikeshare_trips
   WHERE
     TIMESTAMP_TRUNC(start_time, QUARTER) = TIMESTAMP '2024-04-01 00:00:00'
     AND end_station_id IS NOT NULL
   GROUP BY CAST(end_station_id AS INT64)
 )
SELECT stations.name AS station_name, SUM(qr.ridership_count) AS total_ridership
FROM QuarterlyRidership AS qr
INNER JOIN
 bigquery-public-data.austin_bikeshare.bikeshare_stations AS stations
 ON qr.station_id = stations.station_id
GROUP BY stations.name
ORDER BY SUM(qr.ridership_count) DESC
LIMIT 5;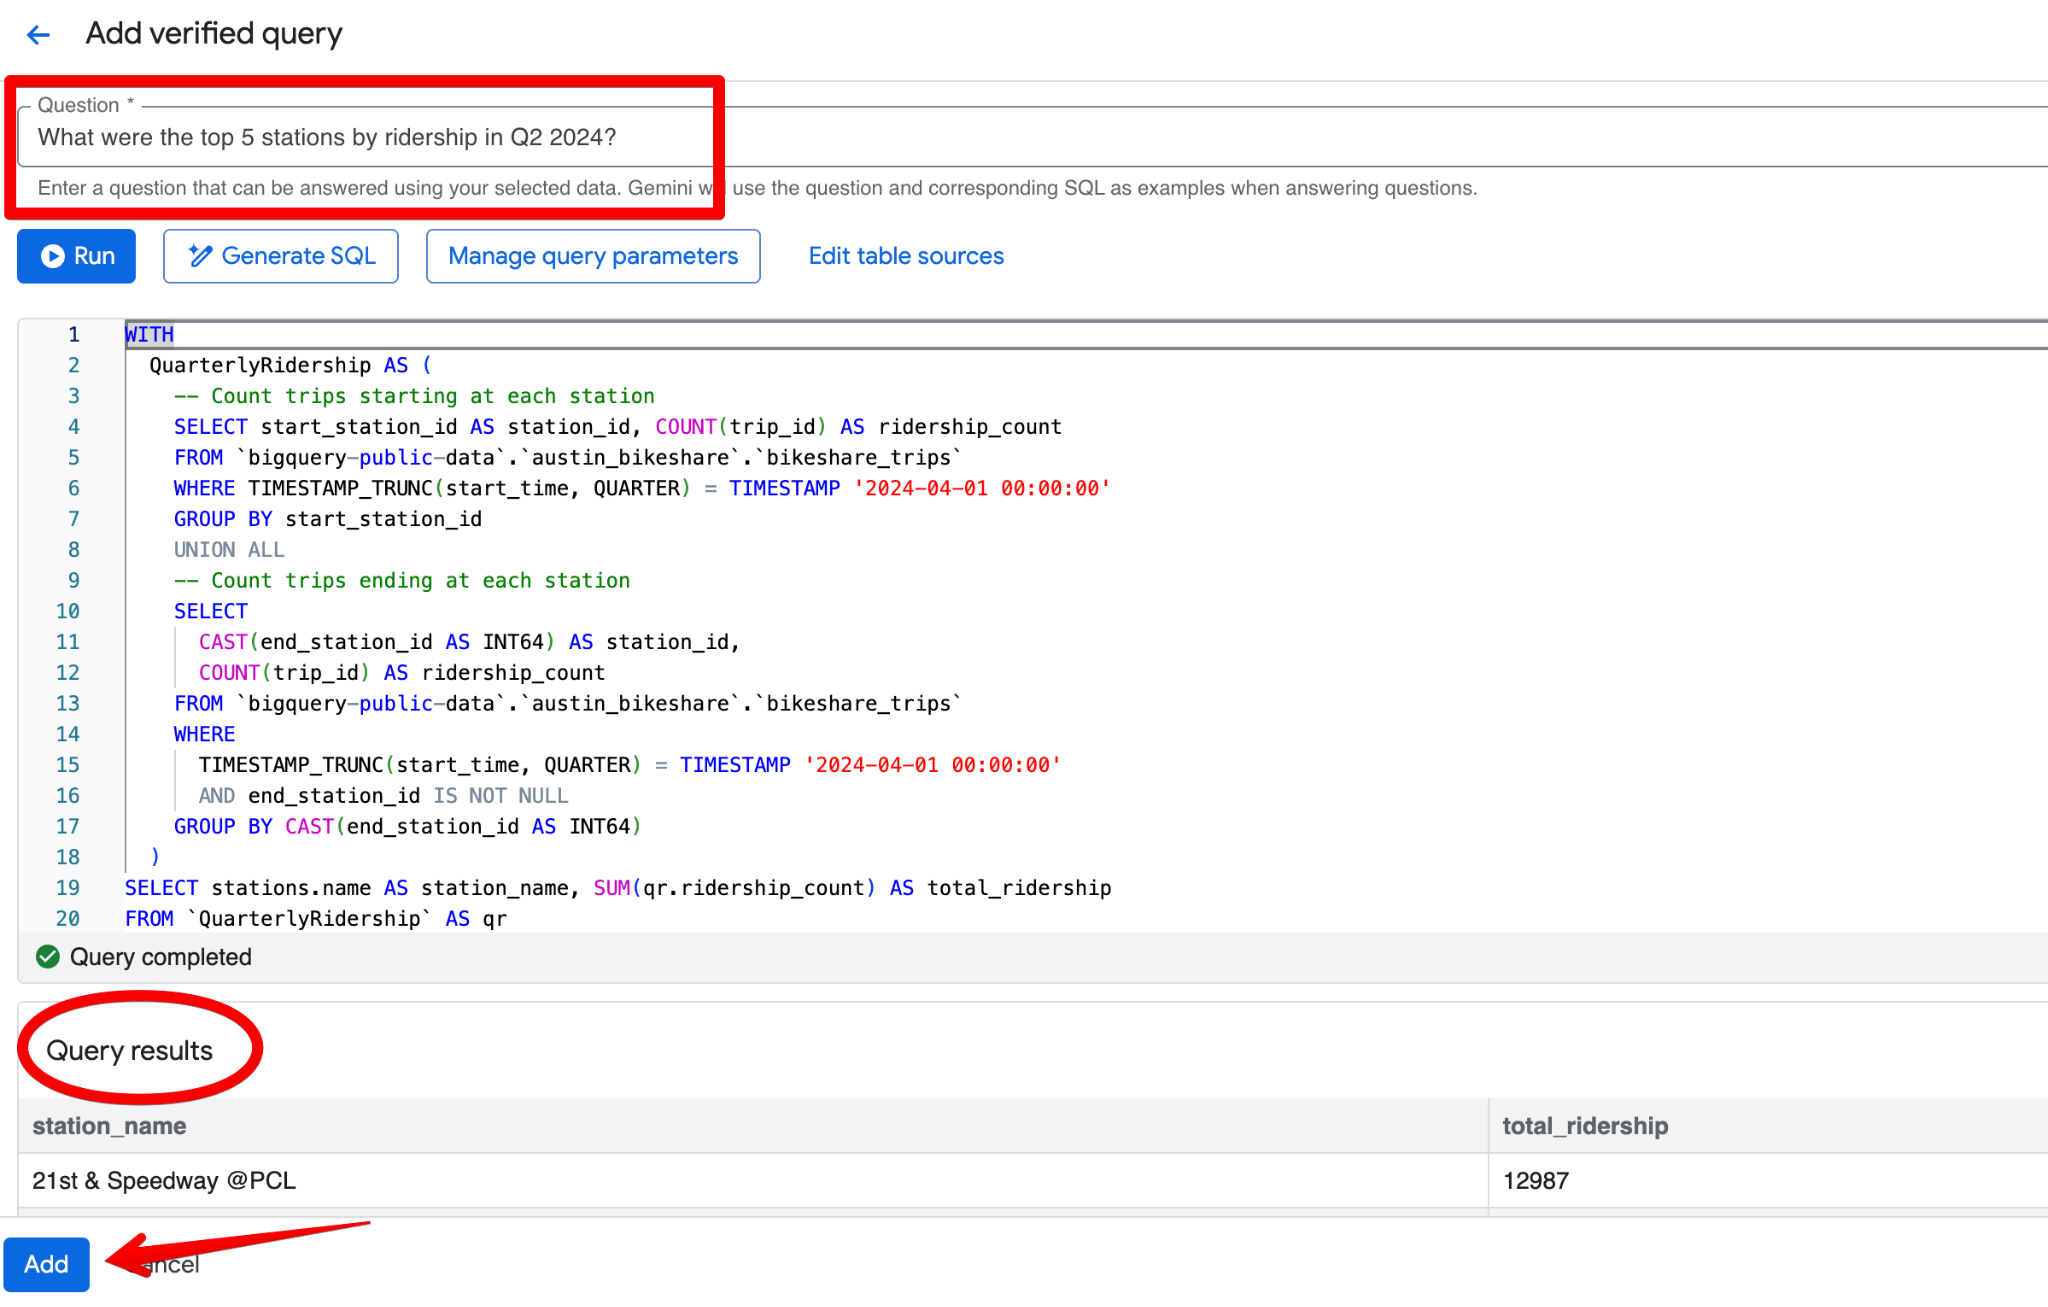
Even when the agent gives a reasonable answer on the first try, you can make it significantly more accurate and consistent by reviewing the generated SQL and adding verified queries.
Follow this practical workflow:
Let’s say, you asked, “What was the average trip duration in June 2024?” In the initial response, the agent returns 26.68 minutes and correctly excludes trips shorter than 1 minute. Now, suppose the team’s standard business rule is to exclude any trip shorter than 5 minutes instead.
When you open the generated SQL (via Open in Editor), you see the filter is only duration_minutes >= 1.
Click Add query in the Verified Queries section and create this entry:
Question:
What was the average trip duration in June 2024?SQL:
SELECT
  ROUND(AVG(duration_minutes), 2) AS avg_trip_duration_minutes
FROM
  bigquery-public-data.austin_bikeshare.bikeshare_trips
WHERE
  start_time BETWEEN '2024-06-01' AND '2024-06-30'
  AND duration_minutes >= 5;     -- stricter rule: exclude trips under 5 minutes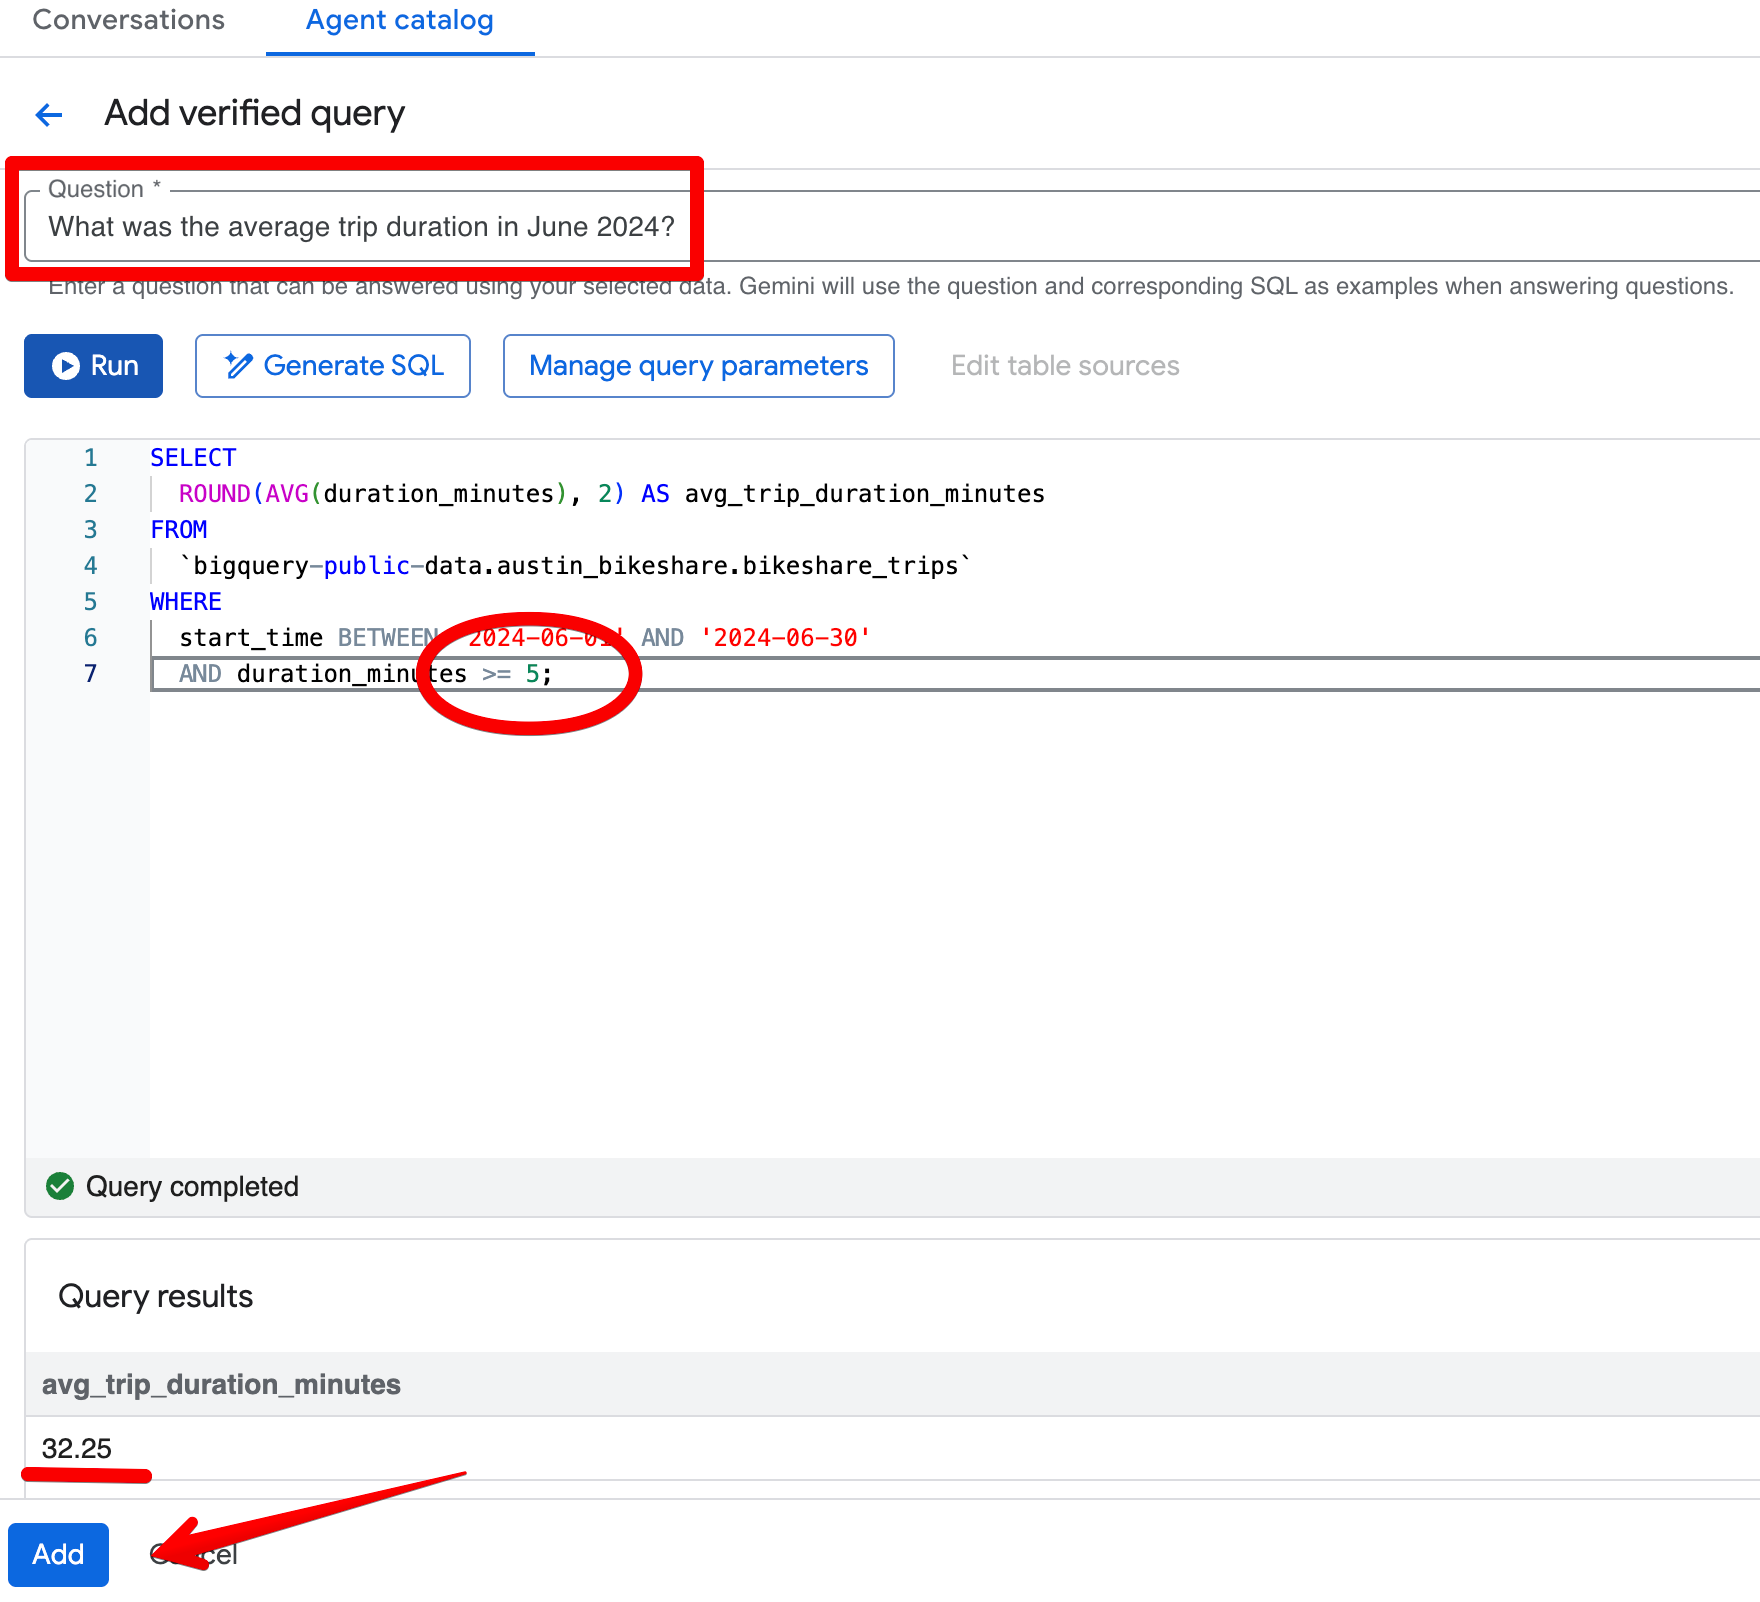
After saving the verified query, re-ask the same question in the Preview pane. The agent now consistently returns ~32.08 minutes and applies your stricter 5-minute threshold. The results become more aligned with your business view of “meaningful” trips.
BigQuery’s conversational analytics stands out from simple text-to-SQL tools by natively supporting BigQuery ML functions, unstructured data, and easy sharing across the Google Cloud ecosystem.
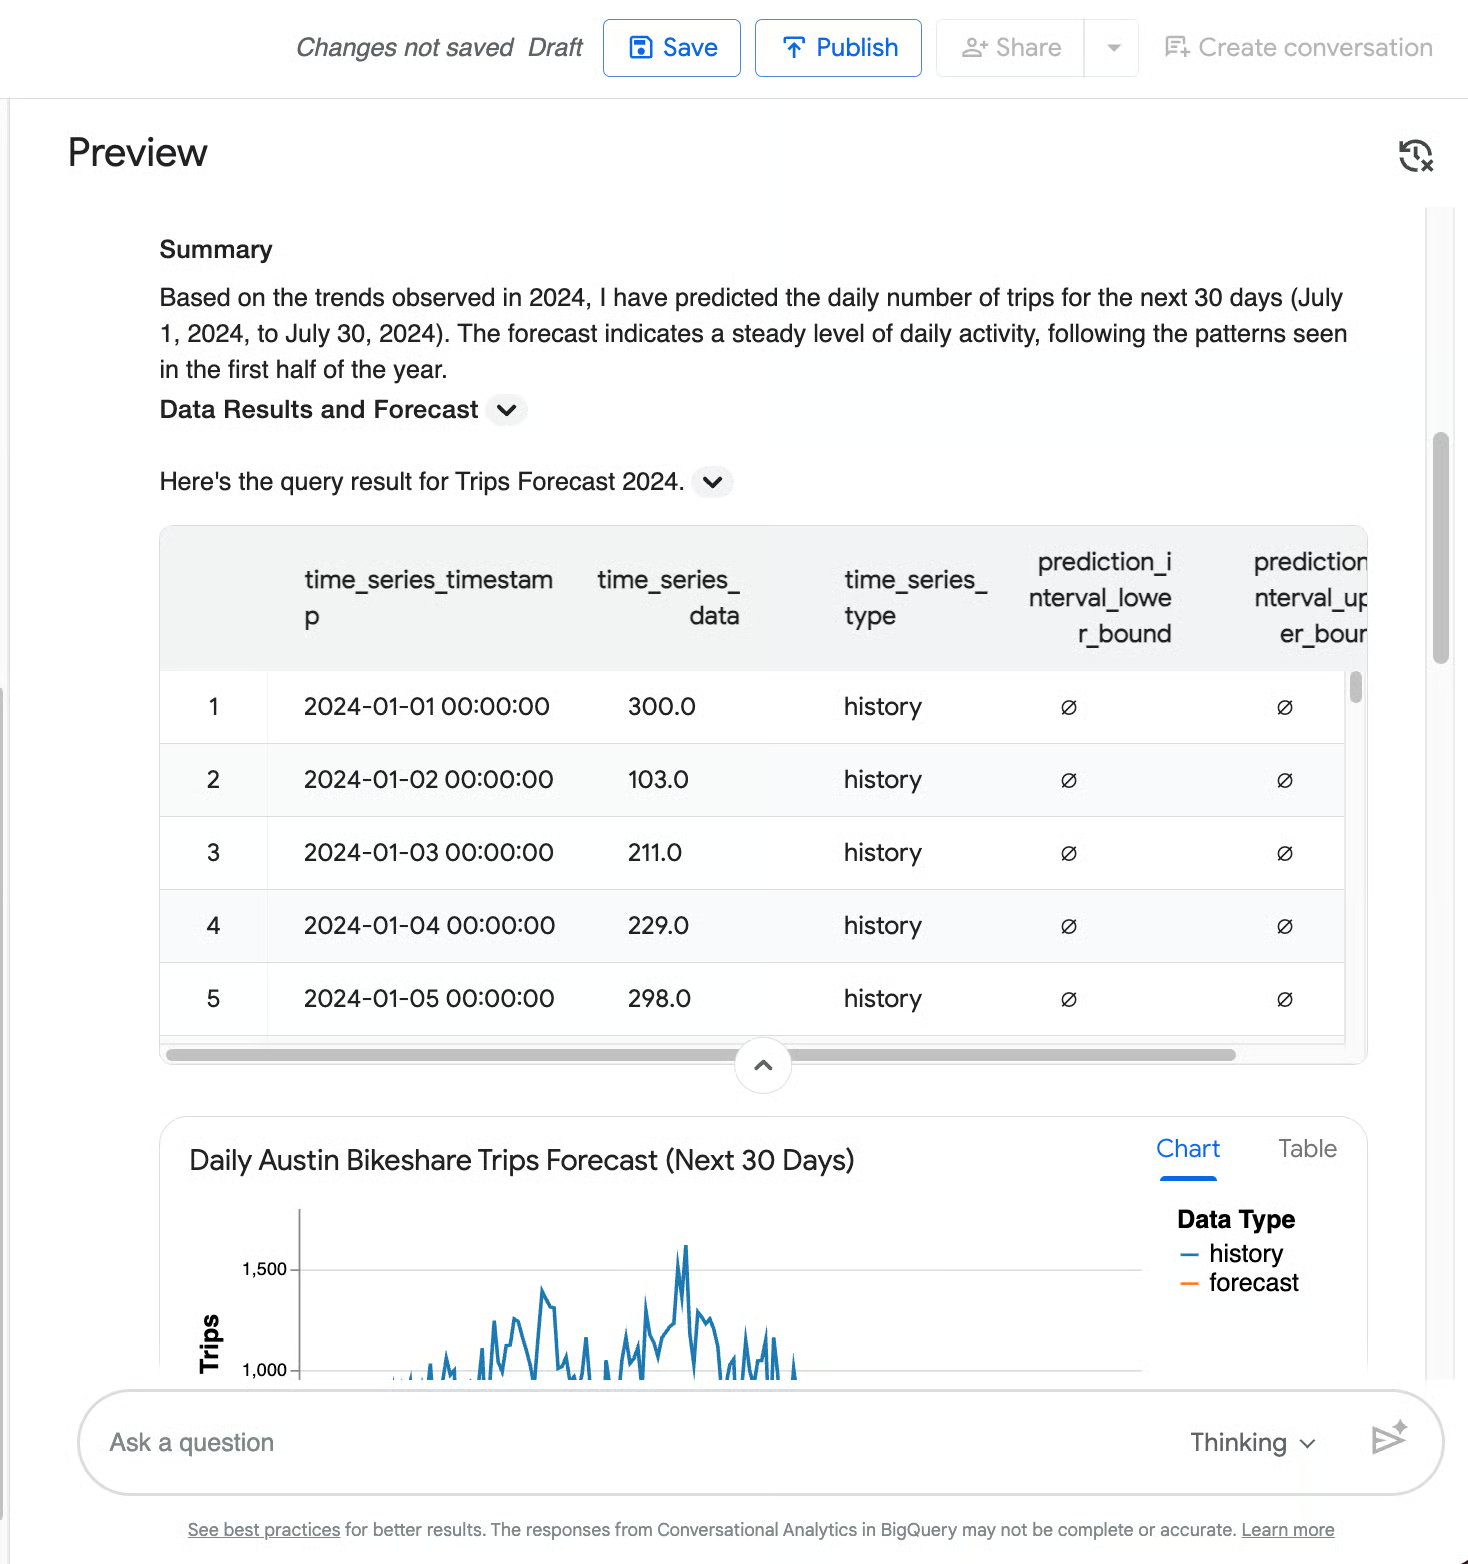
One of the biggest differentiators is the agent’s ability to call BigQuery ML functions directly from natural language, to move beyond retrospective reporting into forward-looking insights.
For instance, you can ask a data agent to predict the daily number of trips for the next 30 days based on 2024 trends. It will trigger AI.FORECAST, and generate a forecast for July 2024 alongside a beautiful chart showing historical daily trips (blue line) and the 30-day forecast (orange line) with a shaded 95% confidence interval.
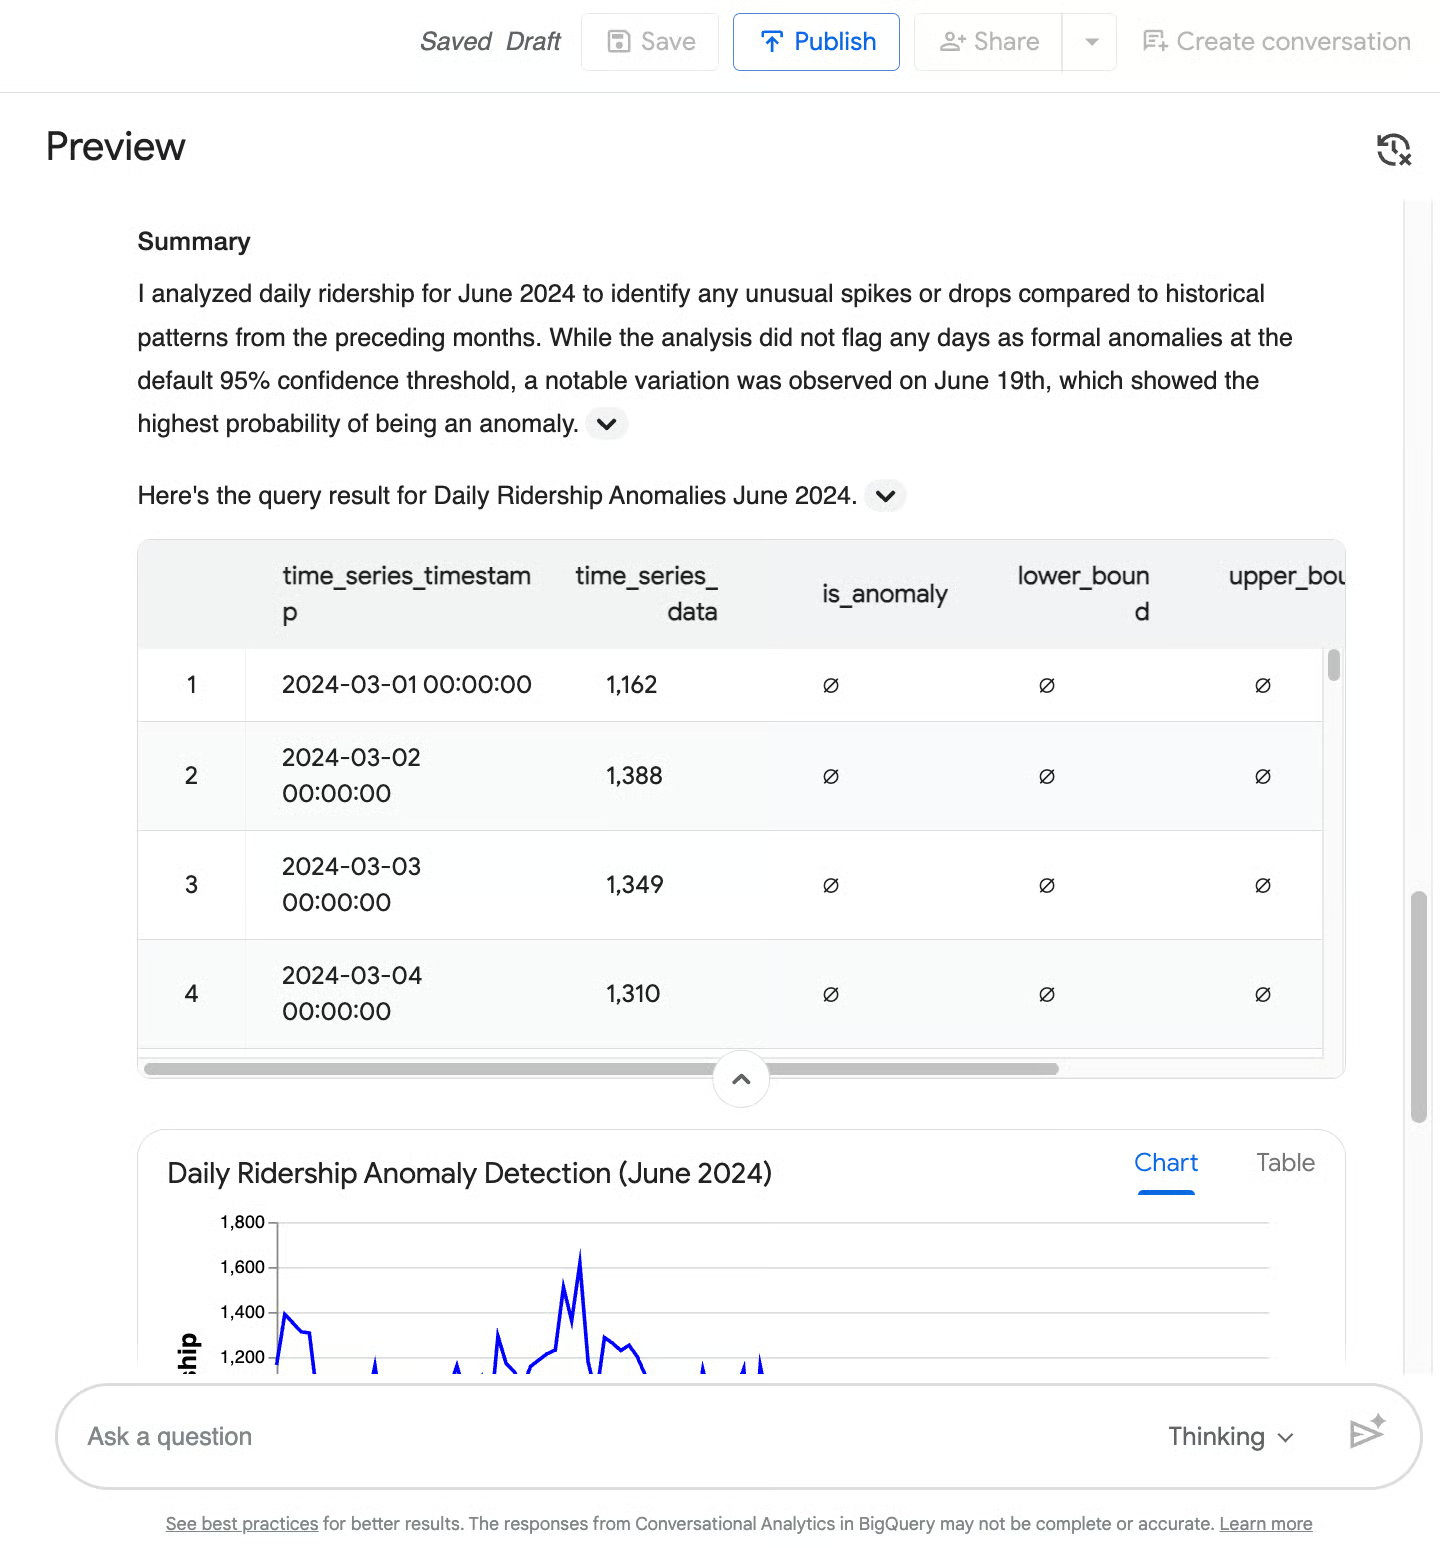
Another way in which machine learning algorithms can be helpful is by detecting if something is off in your data. When you, for example, ask an agent to detect anomalies in daily ridership during June 2024, it will invoke AI.DETECT_ANOMALIES, comparing June 2024 against prior months, and return a time-series table plus a line chart.
In this case, it flagged no formal anomalies at the 95% confidence level but highlighted June 19 as a near-anomaly (92.1% probability) with a noticeable drop in ridership.
Most conversational BI tools fail the moment data isn't neatly organized into rows and columns. BigQuery, however, supports Object Tables, which allow you to analyze unstructured data (like PDFs, images, and raw text logs) stored in Google Cloud Storage.
Because the Data Agent is powered by Gemini's multimodal capabilities, it can reason across both your structured metrics and your unstructured files simultaneously. This is a massive, unique differentiator for BigQuery.
If you have rider survey PDFs or station inspection images in an object table, simply ask, “Summarize the main complaints from the Q2 2024 rider survey PDFs.” The agent will read the unstructured files and combine the information with your structured trip data
Your data team builds and tests Data Agents in BigQuery Studio, but your end-users likely live in entirely different applications. Google makes it easy to decouple the agent from the GCP Console so you can meet business users where they already work.
If you want to try building a custom chat application yourself, you can also read more in the official Introduction to Conversational Analytics in BigQuery.
If there is one key principle to take away, it is this: conversational analytics shifts the analytical bottleneck from waiting for a data team to simply asking the right question.
This democratization doesn't mean data teams are obsolete, but their role is changing. An AI agent is only as intelligent as the guardrails you build around it. The accuracy and safety of your data agents depend entirely on the instructions, context, and schema architecture you provide.
To build the most effective conversational agents, you still need a strong command of the underlying data warehouse. If you or your team want to strengthen those core skills and master the platform powering these AI features, check out DataCamp's Introduction to BigQuery course today!
Google Cloud Courses
Program
Kurs
Kurs
Eğitim
Aryan Irani
Eğitim
Bex Tuychiev
Eğitim
Abid Ali Awan
Eğitim
Aashi Dutt
Eğitim
Tim Lu
code-along
Joe Franklin