Course
Foundations of Probability in R
4 hr
42.2K
When building ML-powered models, evaluating a model’s performance is just as important as training it. While accuracy is often the default metric, it can be misleading, particularly in imbalanced datasets where there is one class dominating the data.
The F1 score is the harmonic mean of precision and recall. It balances the trade-off between false positives and false negatives, and provides a more accurate measure of model performance.
Applications such as fraud detection, medical diagnosis, spam filtering, and fault detection, accuracy alone isn't enough to tell the full story. A model might achieve high accuracy, but if it fails to detect rare critical cases, it might be doing more harm than good. The F1 score covers this risk. If you’re still new to evaluation metrics, you may want to explore the basics in Machine Learning Fundamentals in Python before we keep going.
The F1 score measures the balance between precision and recall for a model. It ranges from 0 to 1, where 1 indicates perfect precision and recall, and 0 implies poor performance.
The F1 score combines both into a single figure, penalizing models that perform well on one but not on the other. For example, one that recalls very well but is not very precise may pick up all positive instances correctly, but give too many false positives. The F1 measure ensures that both measures are taken together.
The F1 score formula is:

Where precision is defined in this way:

And the equation for recall is:

Here, TP = True Positives, FP = False Positives, and FN = False Negatives.
The harmonic mean is used instead of the arithmetic mean because the former punishes large differences. In case of high precision but low recall (or vice versa), the F1 score will drop significantly, reflecting an imbalance.
Accuracy determines correct predictions out of total predictions:

While good for class-balanced sets, accuracy is misleading in class-imbalanced problems.
Example:
If a spam filtering system contains 90% spam and 10% non-spam messages, a naive classifier that classifies all emails as "spam" obtains 90% accuracy but never classifies non-spam emails correctly. That is of no use in practice.
Here, the F1 measure is more accurate, as it accounts for the cost of false positives and false negatives, which accuracy does not.
In binary classification, the F1 score is calculated relative to the positive class. For example, in medical testing, the positive class might represent “disease present.”
In multiclass problems, F1 scores are extended using averaging methods:
|
Method |
Description |
Best for |
|
Macro |
Calculates F1 independently for each class, then takes the average. |
Balanced datasets, equal weightage to all classes. |
|
Weighted |
Averages F1 scores weighted by class support (number of samples per class). |
Imbalanced datasets. |
|
Micro |
Aggregates the contributions of all classes to compute a global F1. |
Situations where overall performance is more important. |
This flexibility makes the F1 score applicable across a wide variety of classification problems.
The scikit-learn library includes simple functions to compute the F1 score.
Start by evaluating a simple binary classification problem where predictions are either 0 or 1. The f1_score() function calculates the F1 score directly using the true and predicted labels.
from sklearn.metrics import f1_score

# True labels
y_true = [0, 1, 1, 1, 0, 1, 0, 1]

# Predicted labels
y_pred = [0, 1, 0, 1, 0, 1, 1, 1]

# Calculate F1 Score
print("F1 Score:", round(f1_score(y_true, y_pred, average='binary'),2))
F1 Score: 0.8Next, you can extend the same approach to multiclass problems, where the model predicts more than two classes. The average parameter controls how F1 scores are aggregated across classes—common options include 'macro', 'micro', and 'weighted'.
from sklearn.metrics import f1_score, classification_report

y_true = [0, 1, 2, 2, 0, 1, 2, 1, 2]
y_pred = [0, 2, 1, 2, 0, 0, 2, 1, 2]

# Macro, Micro, Weighted F1
print("Macro F1:", round(f1_score(y_true, y_pred, average='macro'),2))
print("Micro F1:", round(f1_score(y_true, y_pred, average='micro'),2))
print("Weighted F1:", round(f1_score(y_true, y_pred, average='weighted'),2))

# Detailed report
print(classification_report(y_true, y_pred))
Macro F1: 0.65
Micro F1: 0.67
Weighted F1: 0.64
precision recall f1-score support
0 0.67 1.00 0.80 2
1 0.50 0.33 0.40 3
2 0.75 0.75 0.75 4
accuracy 0.67 9
macro avg 0.64 0.69 0.65 9
weighted avg 0.65 0.67 0.64 9When we calculate F1 or Fβ in multi-class or multi-label classification, we need to decide how to average scores across different classes. The average parameter in scikit-learn offers a few options:
Binary is used in the case of two classes. We focus on the positive class and compute precision, recall, and F1 for that class primarily.
Micro involves aggregating the contributions of all classes and then averaging them to compute the average metric. In practice, it sums over the total true positives, false negatives, and false positives across classes and then calculates precision, recall, and F1 based on these sums. Micro-averaging adds value in seeing overall performance regardless of class imbalance.
Macro: We calculate the metric for each class and then average them unweighted. This does not provide equal treatment to all classes and is therefore reasonable if all classes are of equal importance, even if the dataset is imbalanced.
Weighted is similar to macro, but does not give equal weight to each class. It weights the scores by the number of true instances per class. This implies that larger classes count more in the final score. Weighted averaging is useful when we are looking for a balanced view without ignoring class distribution.
Samples: It is used in multi-label problems, where one sample can belong to more than one class. Here, the metric is calculated for each instance and then averaged across all instances.
These options of averaging allow us to tailor the F1 or Fβ score to the problem scenario. For example, if we are classifying rare diseases for which minority classes are of prime significance, macro or Fβ, where β > 1, would be appropriate. But if class-wise accuracy across all the classes is what we are looking for, micro or weighted averaging gives a better picture.
For more sophisticated needs, scikit-learn also provides fbeta_score(), which generalizes F1. A deeper understanding of such tools is part of the Machine Learning Scientist in Python career track.
The Fβ score generalizes the F1 score depending on whether precision or recall is of primary concern:

Assume a medical data set wherein only 5% of the patients actually have diabetes. A model that has been trained for diabetes detection can have an accuracy of 95%. But this 95% accuracy can be easily achieved by always predicting "no diabetes" for everybody, rendering this model useless.
Instead, let us use the F1 score to measure the model.
from sklearn.metrics import f1_score, fbeta_score, confusion_matrix

# Suppose these are results from a diabetes detection model
y_true = [0, 0, 0, 1, 0, 1, 0, 1, 0, 0, 1, 0, 0, 0, 1, 1]  # true outcomes
y_pred = [0, 0, 0, 1, 0, 0, 0, 1, 0, 0, 1, 0, 0, 0, 0, 1]  # model predictions

print("Accuracy:", round((sum([yt == yp for yt, yp in zip(y_true, y_pred)]) / len(y_true)),2))
print("F1 Score:", round(f1_score(y_true, y_pred),2))
print("F2 Score (recall-focused):", round(fbeta_score(y_true, y_pred, beta=2),2))
Accuracy: 0.88
F1 Score: 0.8
F2 Score (recall-focused): 0.71Why choose F1 or F2 here?
In this use case, recall is valuable as a missed diagnosis can be life-altering. The F2 score is thus more appropriate as it gives higher weight to recall.
This shows how the F1 family of metrics provides a more practical and usable measure than accuracy in clinical use cases.
The F1 score reminds us that model evaluation is more than a numbers game. It’s really about understanding the trade-offs behind every prediction. This is important because in real-life applications, missing one critical case can have serious consequences.
As you continue building and refining models, developing an intuition for metrics like F1 will help you make more context-aware choices about performance. To deepen your skills in applying these concepts to real datasets, check out the Machine Learning Scientist with Python career track, where you’ll learn how to evaluate, tune, and deploy models effectively across a variety of use cases.
Learn with DataCamp
Course
Course
Course
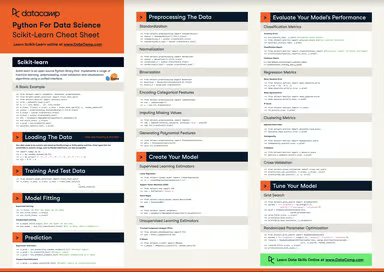
cheat-sheet
Karlijn Willems
Tutorial
Vidhi Chugh
Tutorial
Nisha Arya Ahmed
Tutorial
Vidhi Chugh
Tutorial
Mark Pedigo
Tutorial
Richmond Alake