Track
Machine learning projects don’t end when you deploy a model into production. Even after deployment, you must monitor it constantly to ensure its accuracy doesn’t decrease over time. This is where tools like Grafana can be helpful with its powerful visualization and monitoring capabilities. It allows data scientists and ML engineers to closely monitor their production model’s performance.
This article introduces you to the world of machine learning model monitoring through Grafana using the example of a simple regression model. By the end, we will have a monitoring system set up that can send alerts when production performance drops.
Model Monitoring Fundamentals
Before we start talking about Grafana and how to use it, let’s understand why machine learning models fail in production without monitoring. Two key concepts that often lead to model degradation are data drift and concept drift.
Data drift

Imagine you’ve trained a robot to sort apples based on their size and color. The robot can detect ripe red apples of a certain size range. Now, let’s say next year, the orchard starts producing new types of apples that are green when they are ripe. Suddenly, the robot starts making mistakes because the data it is receiving (green apples) is different from what it was trained on (red apples).
This phenomenon is called data drift in machine learning. It happens when the distribution of production data differs significantly from the training data. This often leads to horrible model performance because it is making predictions on new type of data that involve outdated or irrelevant patterns.
Monitoring for data drift helps us identify when our model’s inputs change in production, indicating that we might need to retrain our model on more recent data.
Concept drift
Let’s revisit our apple-sorting robot. This time, imagine that consumer preferences change, and people start preferring slightly underripe apples. The definition of a “good apple” has changed, even though the apples look the same.
This is concept drift in machine learning. It occurs when the relationship between the input features and the target variable changes over time. In other words, the rules of the game change. In our ML context:
- The model’s logic: The relationships and patterns the model has learned.
- The real-world relationship: How input features actually relate to the target variable in the current environment.
Concept drift happens when these two diverge, even if the input data itself hasn’t changed much.
Monitoring for concept drift helps us identify when our model’s fundamental assumptions are no longer valid, indicating that we might need to rethink our feature engineering or even model architecture.
Both data drift and concept drift highlight the importance of continuous monitoring in machine learning. Models that perform well in training and initial deployment can degrade over time as the world around them changes. By implementing robust monitoring systems, we can:
- Detect changes early
- Understand the nature of the drift
- Take appropriate actions, such as retraining the model or updating our features
That’s why we need tools like Grafana that provide us methods to visualize these drifts and set up alerts when our model’s performance starts to go down.
In the next sections, we’ll explore how to set up Grafana to monitor for these types of drifts and other key performance indicators of our machine learning model.
The Toolstack We Will Use
Grafana
Grafana is an open-source observability platform with features for analytics and interactive visualizations. It can be connected to various data sources (the backend) of any application and give insight into its performance through charts, graphs, and alerts. Given its characteristics, it can be a good candidate for building a ML monitoring system.
Here are its key features for this context:
- Customizable dashboards: Create visually appealing, real-time dashboards to display model performance metrics.
- Data source integration: Connect to different data sources, including Prometheus, to fetch and visualize performance metrics.
- Alerting system: Set up alerts (email, slack, SMS) based on custom thresholds to notify you in case of drifts.
- Time series analytics: Analyze trends and patterns in your model’s performance over time.
Prometheus
Prometheus is a systems monitoring and alerting toolkit. It’s designed for reliability and scalability, making it ideal for monitoring distributed systems. Prometheus is often used with Grafana because:
- Efficient data storage: it uses a time-series database optimized for storing and querying metrics data.
- Pull-based architecture: it actively scrapes metrics from configured targets for data freshness and reliability.
- Powerful query language: Prometheus has its query language (PromQL) for complex scraping queries and aggregations of metrics data.
How Grafana and Prometheus Work Together
For a model monitoring system, Grafana and Prometheus can create a powerful tandem. Prometheus is for data collection and storage:
- Scrapes metrics from your ML application endpoints
- Stores the collected data in its time-series database
- Provides a query interface (PromQL) for data retrieval
Grafana is for visualization and alerting:
- Connects to Prometheus as a data source
- Queries Prometheus with PromQL
- Visualizes the metrics in customizable dashboards
- Monitors metrics and triggers alerts based on defined conditions.
Docker and Docker Compose
It is hard to imagine monitoring systems without Docker. It provides containerization, ensuring consistent environments across development and production. We won’t go into the details of Docker’s importance, but you can read more about it in our article, Docker for Data Science.
We also have Docker Compose, which simplifies the process of defining and running multi-container applications, making it easier to set up and manage our monitoring stack alongside our ML application.
If you are unfamiliar with Docker, check out our Containerization Concepts and Introduction to Docker courses. You can also learn about Docker certification in a separate article.
Scikit-learn
While the monitoring system we will build works with any machine learning framework, we will use Scikit-learn for its excellent features:
- Flexible pipelines for preprocessing a dataset
- RandomForestRegressor model for predicting diamond prices
If you need a refresher, here is a good starting guide: Python Machine Learning: Scikit-Learn Tutorial.
Scipy
Scipy is one of the backbones of scientific computing in Python. In our project, we will use it to run a Kolmogorov-Smirnov test to implement data drift detection. This test is one of many methods for detecting distribution changes, alongside others like Chi-squared test, Kullback-Leibler divergence, and Wasserstein distance.
Scipy provides efficient implementations of these statistical tests, making it valuable for various drift detection approaches in ML monitoring.
Implementing drift detection requires a sufficient understanding of model monitoring concepts. While we have covered data and concept drifts, there are other key ideas such as the availability of ground truth, performance estimation, reference, and analysis sets. You can learn about these topics in depth in our Machine Learning Monitoring Concepts course.
Flask
Flask is a classic, lightweight web framework for Python. We use it to create a simple API for our regression model, allowing us to make predictions and expose metrics for Prometheus to scrape.
If you prefer something more modern, you can check out FastAPI or BentoML as well.
Advanced Python Scheduler (APScheduler)
APScheduler is a popular framework to schedule Python code for later execution either just once or periodically. In our project, we use it to run our drift detection checks every minute, ensuring a continuous monitoring of our model.
A Workflow to Setup Grafana For Model Monitoring
In this section, we will go through the stages of setting up a monitoring system using Grafana and Prometheus. Before diving into the details, let’s look at the entire process on a high level. Later, this bird's eye view of the steps can serve as a blueprint you can follow in your own projects.
1. Setting up the environment
In this stage, we create a virtual environment, install dependencies and set up the directories and files in our working directory.
2. Model development and training
This stage involves loading training data, performing EDA, engineering new features, pre-processing the data, and, finally, training a model. In a real project, these sub-stages are pretty flexible, and you may need to perform them more than once (perhaps, in a cycle).
In our case, we create a preprocessing pipeline and a regression model with Scikit-learn and save both using joblib.
3. API development
Using your preferred web framework (Flask or FastAPI), create a REST API to serve your model through endpoints.
4. Drift Detection Implementation
In this stage, you can experiment with different data and concept drift detection algorithms. Once you choose, integrate the algorithms into the API service.
5. Exposing metrics
To enable Prometheus to scrape model performance metrics and drift scores, we need to expose them as endpoints. We will achieve this through the Prometheus client and another helpful library.
6. Schedule drift checks
Using APScheduler, we will schedule a Python function to run at regular intervals. The function will fetch new production data, run our drift detection algorithms, and return drift scores. Then, Prometheus will be able to scare them.
7. Containerization
Once we are finished with all the code, we Dockerize our application using a Dockerfile and a YAML Docker Compose file. When we launch the built container, it will start three local processes:
- Grafana web application
- Prometheus web application
- REST API for our regression model
8. Prometheus configuration
Once the Docker container is up and running, we access Prometheus and set it up to scrape metrics from the now-running API. We also configure data retention and scraping intervals.
9. Grafana setup
Now, we configure Grafana by adding Prometheus as a data source and creating a dashboard to visualize scraped metrics.
10. Alert configuration
Finally, we set up alerting rules in Grafana based on drift thresholds. We also configure a notification channel that will send a Discord alert when the system detects a drift.
Now, let’s look at each of these stages in more detail.
1. Setting up the environment
First, we will create a virtual environment using Conda:
$ conda create -n grafana_tutorial python=3.8 -y
$ conda activate grafana_tutorial
Then, we will save the following dependencies in a requirements.txt file:
scikit-learn
numpy
pandas
seaborn
flask
apscheduler
prometheus-client
joblib
werkzeug
and install them with PIP:
$ pip install -U -r requirements.txtNext, we create a working directory called grafana_model_monitoring and populate it with folders and initial files:
$ mkdir grafana_model_monitoring; cd grafana_model_monitoring
$ mkdir src  # To store python scripts
$ touch src/{app.py,concept_drift.py,data_drift.py,train.py}  # Scripts
$ touch Dockerfile docker-compose.yml prometheus.yml  # Configuration
Now that our directory tree is ready, let’s install Grafana and Prometheus, as they can’t be installed through PIP or Conda.
Installing Grafana
For Ubuntu/Debian/WSL2:
$ sudo apt-get install -y software-properties-common
$ sudo add-apt-repository "deb https://packages.grafana.com/oss/deb stable main"
$ sudo apt-get update
$ sudo apt-get install grafana
For macOS (using Homebrew):
$ brew update
$ brew install grafana
After installing, you should start the Grafana service.
For standard Ubuntu/Debian:
$ sudo systemctl start grafana-server
$ sudo systemctl enable grafana-server
For WSL2:
$ sudo /usr/sbin/grafana-server --config=/etc/grafana/grafana.ini --homepath /usr/share/grafanaFor macOS:
$ brew services start grafanaOnce it starts, Grafana will be available on http://localhost:3000/:
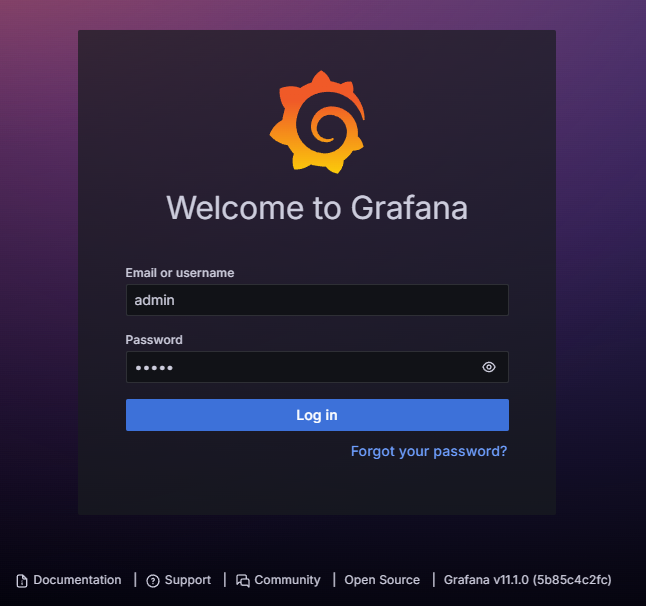
The default login and password is admin but you can create an official account at Grafana if you want.
Installing Prometheus
Now, we install Prometheus.
For Ubuntu/Debian/WSL2:
$ wget https://github.com/prometheus/prometheus/releases/download/v2.30.3/prometheus-2.30.3.linux-amd64.tar.gz
$ tar xvfz prometheus-*.tar.gz
$ cd prometheus-  # Click TAB to get the folder name
For macOS (using Homebrew):
$ brew update
$ brew install prometheus
After installation, Prometheus requires a configuration file to run correctly.
For Ubuntu/Debian/WSL2, create a file named prometheus.yml in the Prometheus directory (where you extracted the tarball using the tar command above):
$ touch prometheus.ymlFor macOS, the default file must be saved to /usr/local/etc/prometheus.yml:
$ touch /usr/local/etc/prometheus.ymlAfter you create the file, paste the following contents into it:
global:
 scrape_interval: 15s
scrape_configs:
 - job_name: 'prometheus'
   static_configs:
     - targets: ['localhost:9090']
Note that the configuration file might already exist in the specified locations. If so, you can paste any differences from the above snippet into the existing file.
After saving, you can start Prometheus.
For Ubuntu/Debian/WSL2 from the Prometheus directory, run:
$ ./prometheus --config.file=prometheus.ymlFor macOS:
$ brew services start prometheusAfterwards, you can verify it is running at http://localhost:9090:

Now, we are ready to move on to model development.
2. Writing training code
As a sample problem, we will be predicting diamond prices using the Diamonds dataset available in the Seaborn library. The data contains a mix of numeric and categorical features, requiring some pre-processing steps. So, open the src/train.py file and paste the code from this script I've hosted on GitHub.
Note: We will only summarize the training code as it is too long to display in a code snippet. You can explore it in detail using this GitHub repository I’ve finalized for the project.
The script defines a function called train_model() that performs the following tasks:
- Loads the Diamonds dataset from Seaborn
- Defines a Scikit-learn
ColumnTransformerobject that one-hot encodes the categorical features and scales the numeric ones - Combines the
ColumnTransformerobject with aRandomForestRegressormodel to create a finalmodel_pipeline - Splits the data and trains the model pipeline on the training set
- Reports the MSE performance on the test set
- Saves the trained pipeline as a pickle object with
joblib
This script will serve as a basis for creating the REST API.
3. Adding drift detection methods
Next, inside the src/data_drift.py and src/concept_drift.py methods, we define our drift detection methods.
For detecting data drift, we use the Kolmogorov-Smirnov test from SciPy. Here is the full code:
# src/monitoring/data_drift.py
import numpy as np
from scipy.stats import ks_2samp
def detect_data_drift(reference_data, current_data, threshold=0.1):
   drift_scores = {}
   for column in reference_data.columns:
       ks_statistic, p_value = ks_2samp(reference_data[column], current_data[column])
       drift_scores[column] = ks_statistic
   overall_drift_score = np.mean(list(drift_scores.values()))
   is_drift = overall_drift_score > threshold
   return is_drift, drift_scores, overall_drift_score
The Kolmogorov-Smirnov (K-S) test compares the cumulative distribution functions (CDFs) of two distributions. In the context of data drift detection, these two distributions are:
- Reference set: the training data used by the model
- Analysis set: incoming production data
To learn more about reference and analysis sets, refer to our article, End-to-End ML Model Monitoring Workflow with NannyML in Python.
The test measures the maximum distance between the CDFs of the two distributions and reports the K-S statistic. If the statistic exceeds a critical value or if the p-value is below a chosen threshold (e.g. 0.05), it suggests data drift has occurred. In other words, the model is now seeing significantly different data from the one it was trained on.
In concept_drift.py, we are only comparing the MSE scores of training and production datasets:
# src/monitoring/concept_drift.py
from sklearn.metrics import mean_squared_error
import numpy as np
def detect_concept_drift(
   model_pipeline, X_reference, y_reference, X_current, y_current, threshold=0.1
):
   y_pred_reference = model_pipeline.predict(X_reference)
   y_pred_current = model_pipeline.predict(X_current)
   mse_reference = mean_squared_error(y_reference, y_pred_reference)
   mse_current = mean_squared_error(y_current, y_pred_current)
   relative_performance_decrease = (mse_current - mse_reference) / mse_reference
   is_drift = relative_performance_decrease > threshold
   return is_drift, relative_performance_decrease
We mark it a drift if the production performance drops below a certain threshold like 0.1. In other words, if the production MSE is below 90% of the training MSE, we will consider it a concept drift.
The disadvantage of this approach is that it requires immediate ground truth values, which means the production data must come with its own labels. However, this is not the case in many real-world scenarios.
For example, if a model predicts daily stock prices, the labels for its production data are available only after the day ends (the stock market closes). If we were monitoring this model, we would have to wait till the end of each day to see if our concept drift detection method worked correctly. In contrast, for a model that predicts taxi fares, the ground truth values (the price of the taxi ride) would be available as soon as the ride ends. Monitoring this type of model would be very easy.
To mitigate the effects of delayed ground truth values, monitoring systems often use a concept of realized performance. To learn more, check out our Machine Learning Model Monitoring with Python course.
4. Serving the model as a REST API
Now, we open the app.py file and populate it (the full code can be found in this file). Let's go through its different parts.
First, we make the necessary imports:
# src/app.py
import os
import joblib
import pandas as pd
import seaborn as sns
from prometheus_client import start_http_server, Gauge
from prometheus_client import make_wsgi_app
from flask import Flask, request, jsonify
from apscheduler.schedulers.background import BackgroundScheduler
from werkzeug.middleware.dispatcher import DispatcherMiddleware
from data_drift import detect_data_drift
from concept_drift import detect_concept_drift
Among the standard tech stack, we are importing a few extras from libraries including prometheus_client, flask, apscheduler and werkzeug (their purpose will become clear soon).
Then, we create our Flask app and load the training model pipeline:
app = Flask(__name__)
# Load the model pipeline
try:
    model_pipeline = joblib.load("../model_pipeline.joblib")
    print("Model pipeline loaded successfully")
except Exception as e:
    print(f"Error loading model pipeline: {e}")
    print(f"Current working directory: {os.getcwd()}")
    print(f"Files in current directory: {os.listdir('.')}")
    model_pipeline = None
Then, we define the predict endpoint:
@app.route("/predict", methods=["POST"])
def predict():
    if model_pipeline is None:
        return jsonify({"error": "Model pipeline not loaded properly"}), 500
    data = request.json
    df = pd.DataFrame(data, index=[0])
    prediction = model_pipeline.predict(df)
    return jsonify({"prediction": prediction[0]})
The method uses the model pipeline to perform inference on production data.
Lines 40–42 define the metrics using the proper Gauge classes from the Prometheus Python client. They will capture the data drift and concept drift scores when the predict() endpoint is invoked.
# Create Prometheus metrics
data_drift_gauge = Gauge("data_drift", "Data Drift Score")
concept_drift_gauge = Gauge("concept_drift", "Concept Drift Score")
The Gauge class requires the metric name (without spaces) and its description. Later, the provided metric names will show up in our Grafana dashboard.
Lines 44–47 load the Diamonds dataset again as a reference set. It will be used for our drift detection methods, which will be run using a monitor_drifts() function:
# Load reference data
diamonds = sns.load_dataset("diamonds")
X_reference = diamonds[["carat", "cut", "color", "clarity", "depth", "table"]]
y_reference = diamonds["price"]
def monitor_drifts():
    # Simulating new data (in a real scenario, this would be actual new data)
    new_diamonds = sns.load_dataset("diamonds").sample(n=1000, replace=True)
    X_current = new_diamonds[["carat", "cut", "color", "clarity", "depth", "table"]]
    y_current = new_diamonds["price"]
    # Data drift detection
    is_data_drift, _, data_drift_score = detect_data_drift(X_reference, X_current)
    data_drift_gauge.set(data_drift_score)
    # Concept drift detection
    is_concept_drift, concept_drift_score = detect_concept_drift(
        model_pipeline,
        X_reference,
        y_reference,
        X_current,
        y_current,
    )
    concept_drift_gauge.set(concept_drift_score)
    if is_data_drift:
        print("Data drift detected!")
    if is_concept_drift:
        print("Concept drift detected!")
Inside the function, we are sampling 1000 random points from the Diamonds dataset to simulate production data.
In a real-world scenario, you would use some other function like fetch_production_data() which would be connected to a real-time process. For example, if this was a taxi fare prediction model, we would fetch the latest ongoing rides (production data).
Then, we use this production data (analysis set) and the reference set to run our drift detection functions. The functions return drift scores, which we add to their corresponding Prometheus metrics using .set() methods.
After monitor_drifts() function ends, we have this line:
$ app.wsgi_app = DispatcherMiddleware(app.wsgi_app, {"/metrics": make_wsgi_app()})On a high level, this dispatcher middleware combines the servers for our Flask app and Prometheus clients into a single server, allowing us to access drift scores using a /metrics endpoint (don't worry if this doesn't make much sense; this line won't change from project to project).
Finally, under __main__ context, we start an HTTP server on port 8000 for Prometheus, schedule the monitor_drifts() function to run every minute to check for drifts in production data and launch the Flask API with app.run on post 5000.
5. Dockerizing the application
Now, we are ready to containerize our application so that it can be used by anyone. To do so, we populate both Dockerfile and docker-compose.yml files:
# Dockerfile
# Dockerfile
FROM python:3.8-slim
WORKDIR /app
COPY requirements.txt .
RUN pip install --no-cache-dir -U -r requirements.txt
COPY . .
# Run the training script to generate model.joblib and scaler.joblib
RUN python src/train.py
# Run the application
CMD ["python", "src/app.py"]
The Dockerfile specifies the characteristics of containers built on top of our code:
- They use Python 3.8
- Installs the dependencies from the
requirements.txtfile - Runs the
src/train.pyfile to generate the model pipeline object - Runs the
src/app.pyfile to start serving the model
docker-compose.yml specifies how the different services we are using to operate (what ports and configuration to use):
yml
version: "3"
services:
 app:
   build: .
   ports:
     - "5000:5000" # Flask app
     - "8000:8000" # Prometheus metrics
   volumes:
     - ./:/app
 prometheus:
   image: prom/prometheus
   ports:
     - "9090:9090"
   volumes:
     - ./prometheus.yml:/etc/prometheus/prometheus.yml
 grafana:
   image: grafana/grafana
   ports:
     - "3000:3000"
   environment:
     - GF_SECURITY_ADMIN_PASSWORD=admin
   volumes:
     - grafana-storage:/var/lib/grafana
volumes:
 grafana-storage:
Once we define these two files, all we have to do is run the following commands to build the image:
$ docker-compose down  # Stop any ongoing processes
$ docker-compose build  # Build the image
The second command takes some time to build the image. Once it finishes, you can immediately launch a container instance with docker-compose up -d.

Now, there must be three services running on your machine on the following URLs:
- Flask application: http://localhost:5000/metrics (it should show a text file with Prometheus scrape details)
- Prometheus client: http://prometheus:9090/
- Grafana web: http://localhost:3000/
If all these services are operational, then most of the battle is done!
6. Adding Prometheus as a data source to Grafana
Now, head over to Grafana and log in with default login/password (admin). You will land on your homepage:
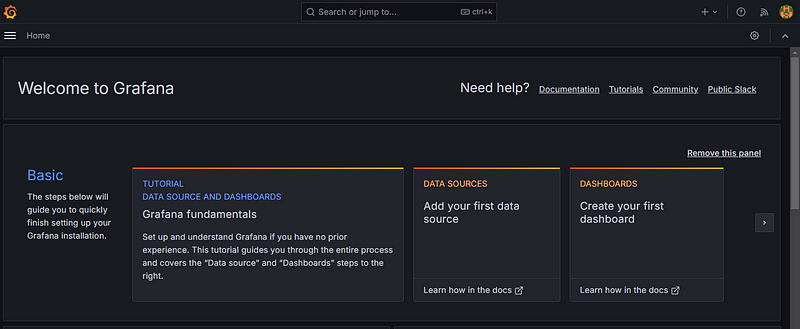
Here, we will add Prometheus as a data source to Grafana:
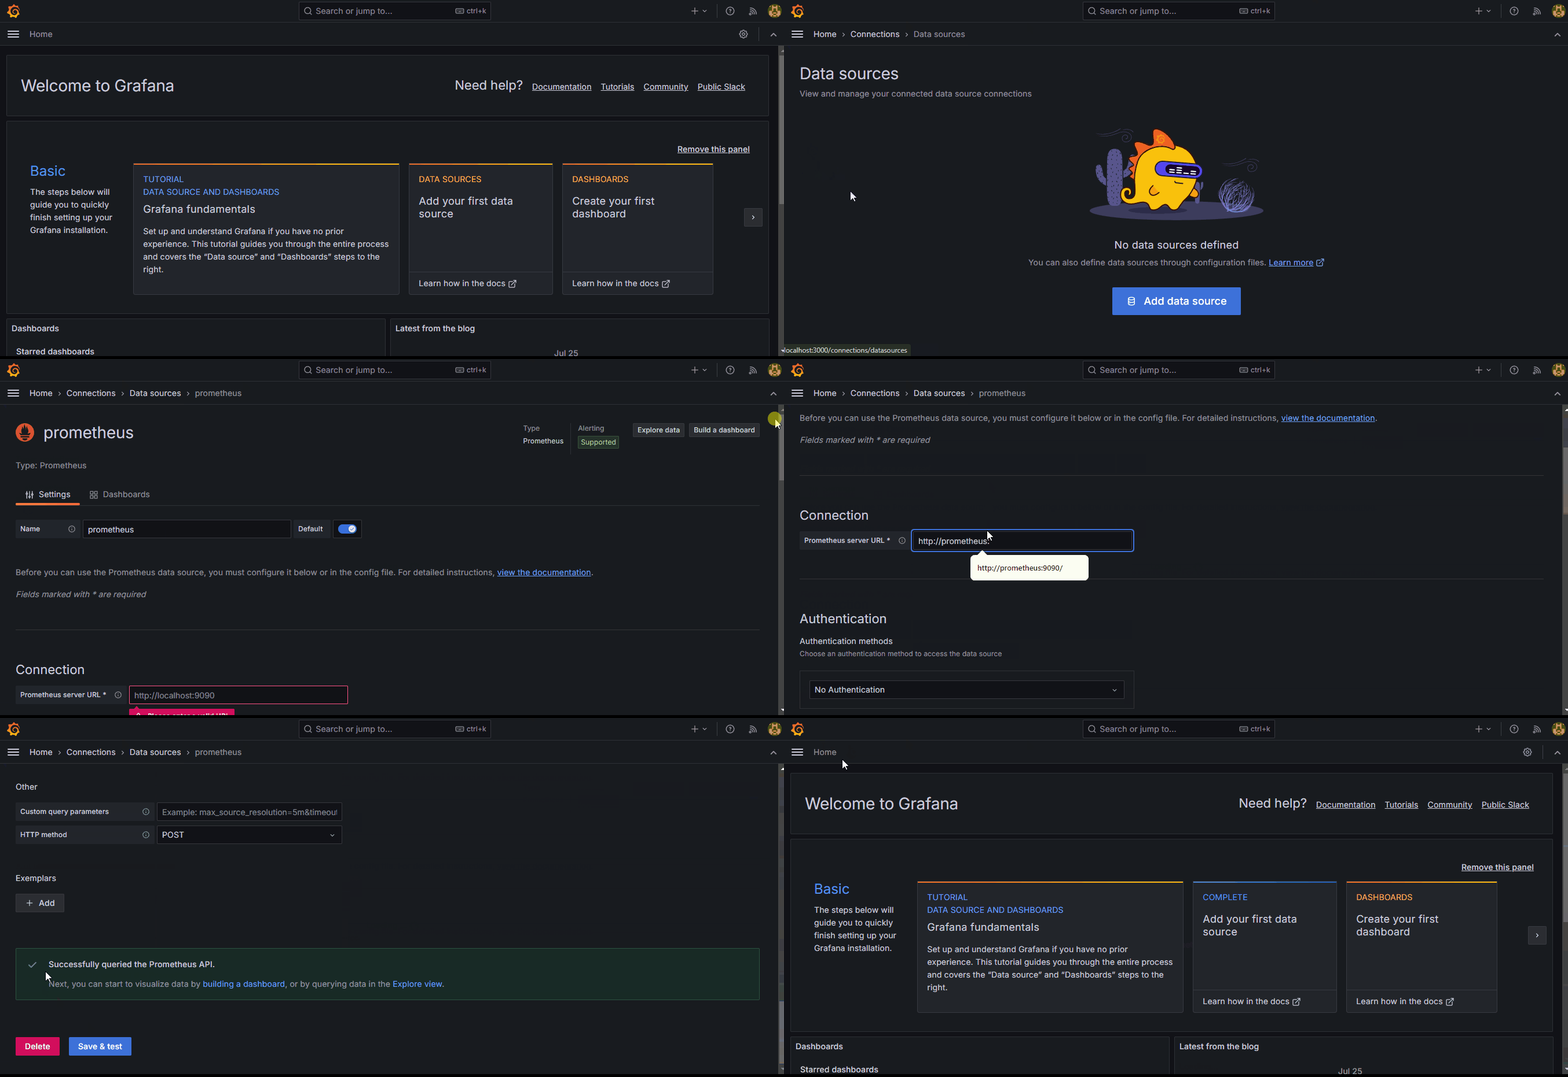
The key part of this process is providing the correct http://prometheus:9090/ URL to the Connection field.
7. Creating a Grafana dashboard with two panels
Now, let’s create our first dashboard. Click on the “+New dashboard” button to open the menu:
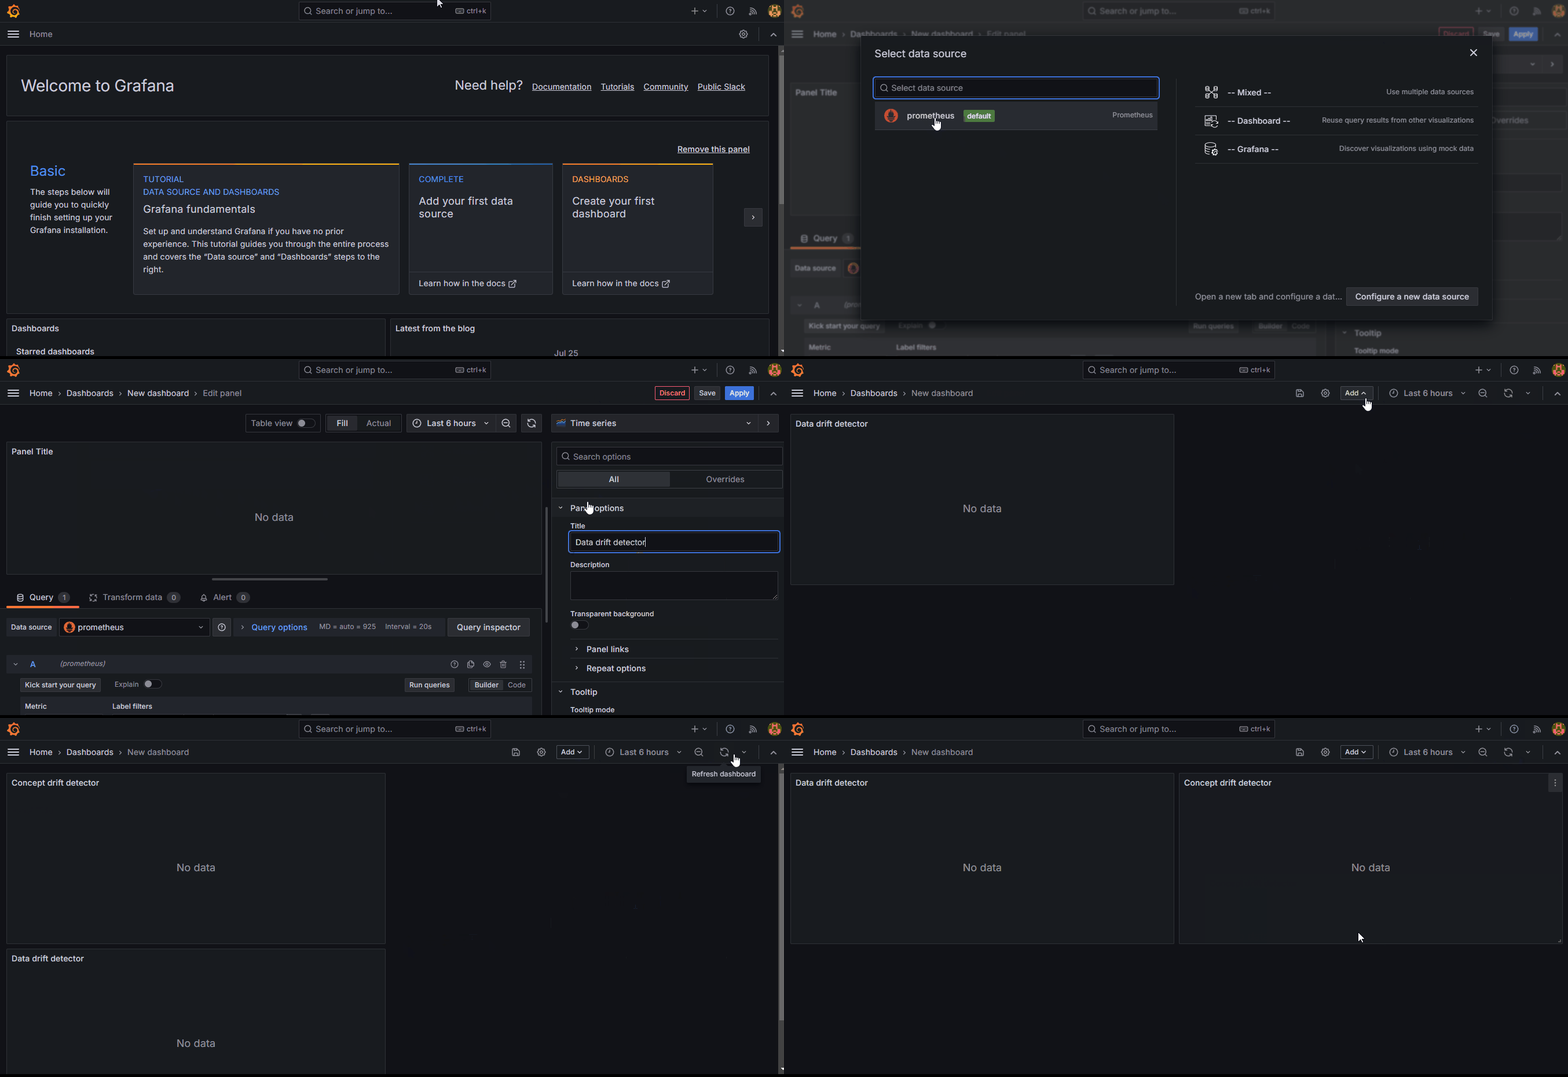
The +New dashboard button creates a blank space with no panes. To add a pane, click on "+Add visualization". This will bring you to the pane edit menu.
In the GIF, we create two visualization panes for two metrics, data drift and concept drift, and display them side-by-side.
Now, let’s connect the scraped drift scores from Prometheus to each pane:
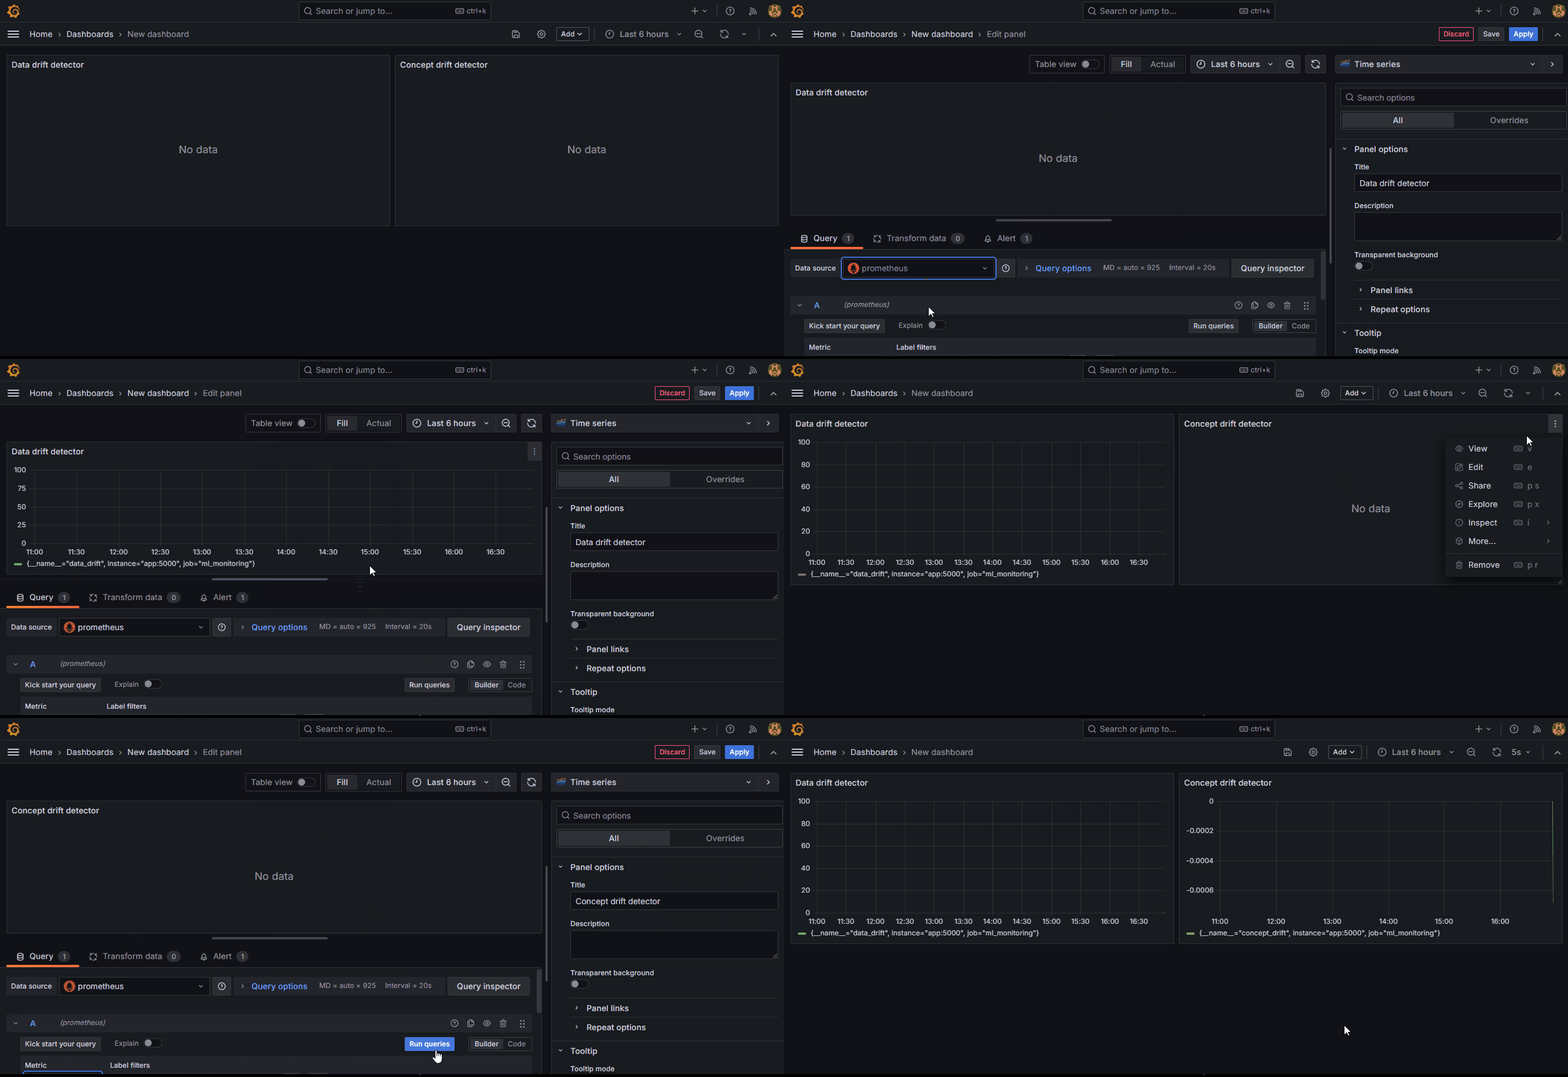
If you scroll down a bit, you will see the metrics explorer in the Query tab. If Prometheus was set up correctly, the data_drift and concept_drift metrics must show up there. Choose them and click on "Run queries" to display the graph.
We set the auto-refresh interval of our dashboard to 5 seconds, but the graphs will change every minute, just like we’ve scheduled our drift detectors in the app.py script.
Note: The following GIFs will only be instructions for the “Data drift detector” pane as the instructions for both panes are the same.
Now, let’s add some thresholds to both metrics to signify where our drift limits are:
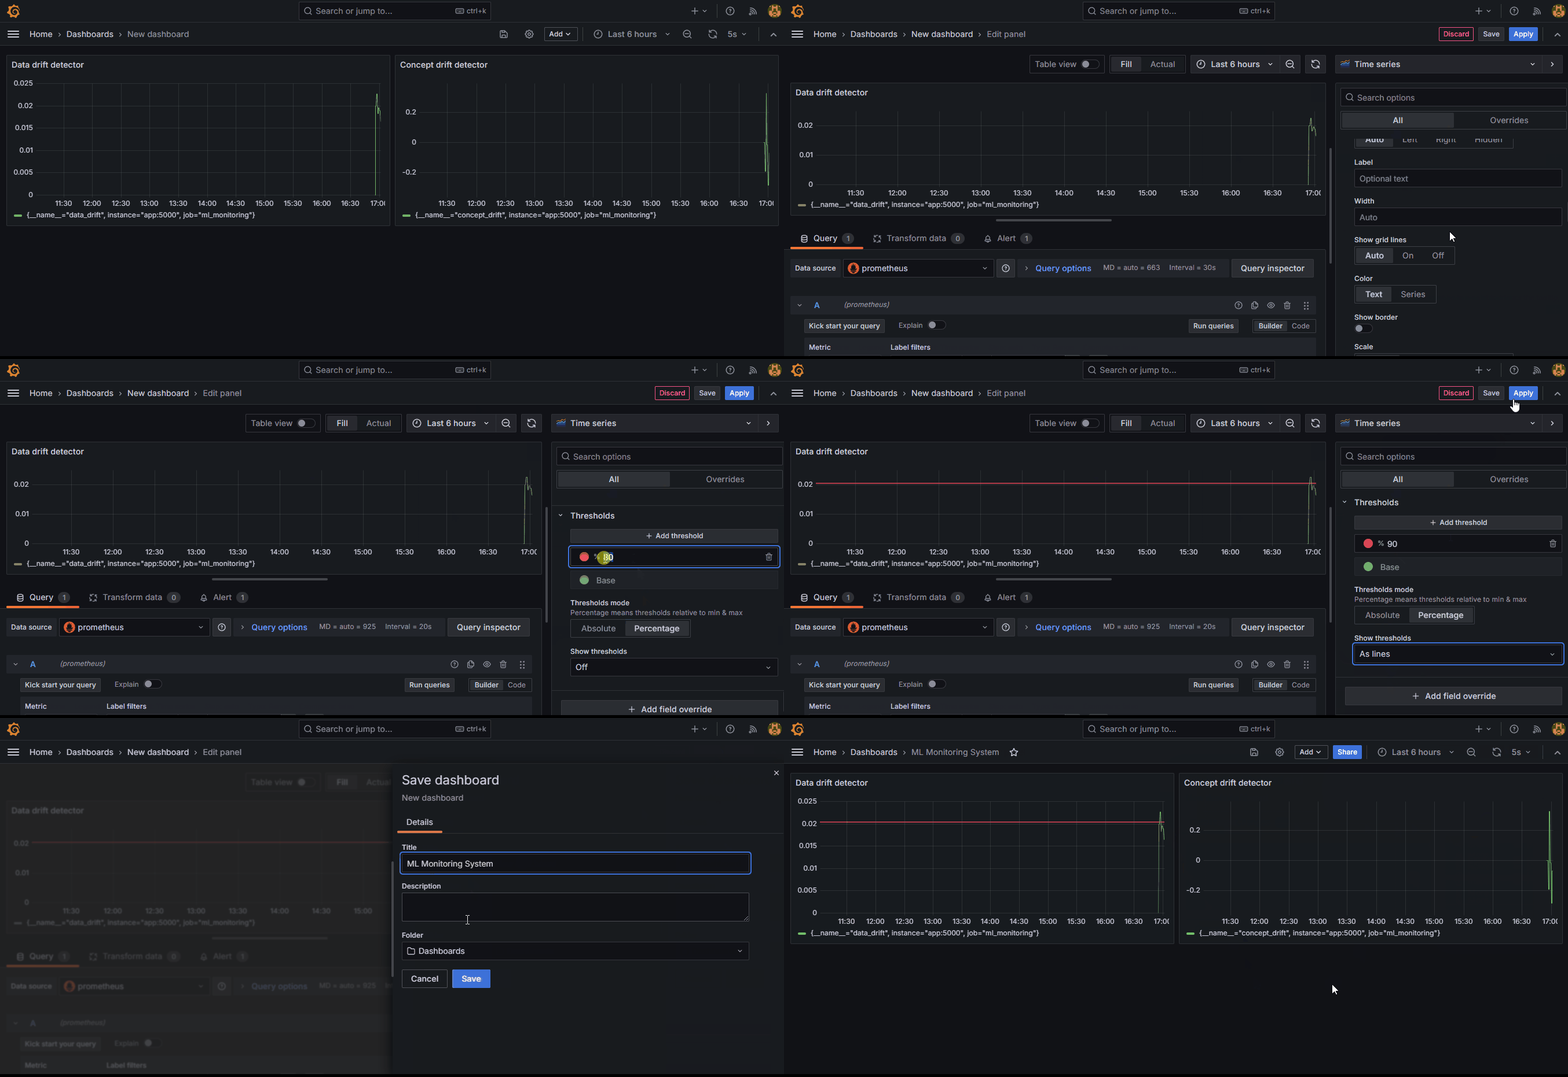
In the edit menu, scroll down to the bottom of the right-hand side and create a percentage-based threshold and optionally, add a threshold line.
Also, instead of clicking on “Apply,” you should click on “Save” to save the entire dashboard itself (only done once). Add the threshold to the concept drift pane as well.
Your dashboard must look like this now:

8. Setting up alerts for drifts
Now, let’s set up a Discord alert that will fire when the drift scores cross a custom threshold.
First, we need to create a new server in Discord and create a webhook. Here are the steps:
- Log in to your Discord account.
- In the bottom left corner, click on “Create server” button.
- Choose “Create my own” and “For me and my friends” options.
- Give your server a name like “Grafana alerts.”
Your Discord should look like this now:
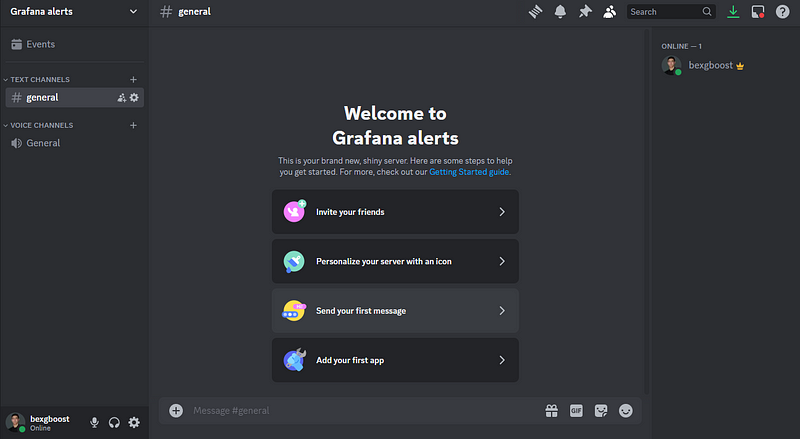
5. In the top left, click on the “+” button next to “Text channels” to create a new channel.
6. Give the channel a name like “grafana-alerts.
7. Click on the blue “Edit channel” button.
8. Switch to the “Integrations” tab and click on the “Create Webhook” button.
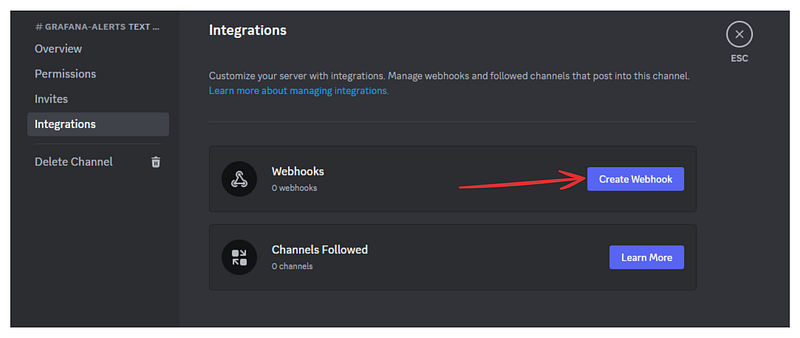
9. Click on the webhook and copy its URL.
10. Save the webhook URL to a text file or somewhere more secure than your clipboard.
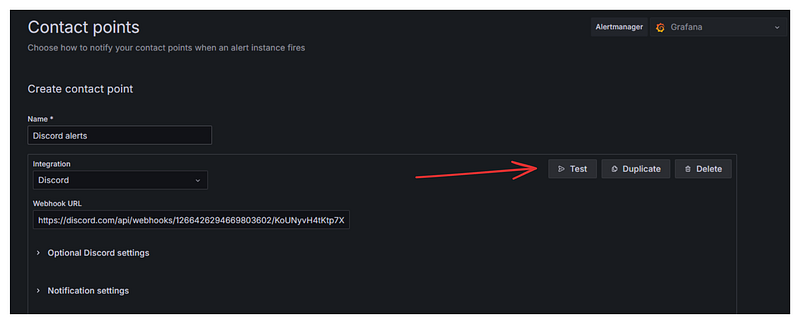
Now, we have to create a contact point in Grafana that can fire alerts through this Discord webhook. Here are the steps:
- Go to the “Home > Alerting > Contact points” page of the Grafana UI
- Click on “+ Add contact point”
- Give it a name like “Discord alerts”
- For the integration type, choose “Discord”
- Paste the Discord webhook URL
- Click on “Test” to send a test alert to the Discord channel
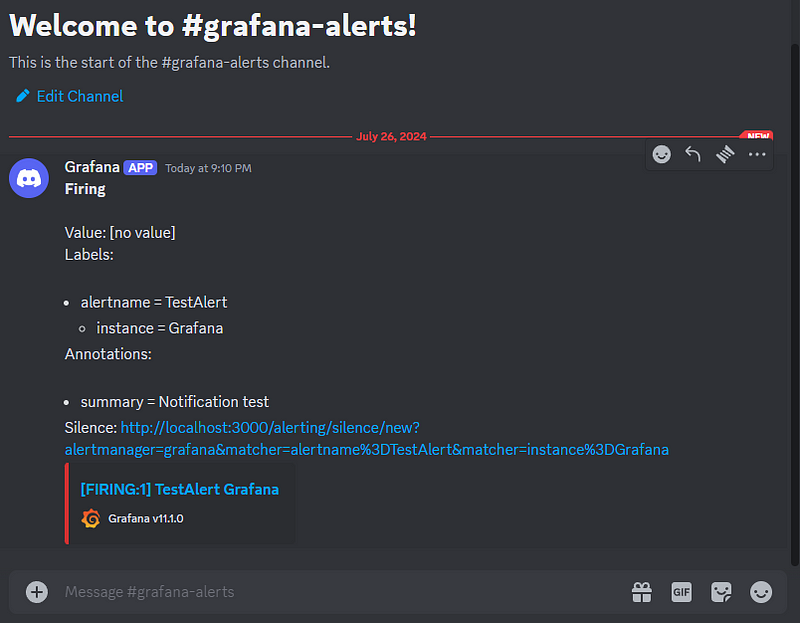
7. Switch to Discord to verify you’ve received the alert
8. Go back to Grafana and click on “Save contact point”.
Now, we need to go back to our dashboard and create alerting rules for both of our metrics. Here are the steps:
- Go to “Home > Dashboards > Your dashboard name”
- Choose the metric pane and click “edit”
- Switch to the “Alert” tab and click on “New alert rule”.
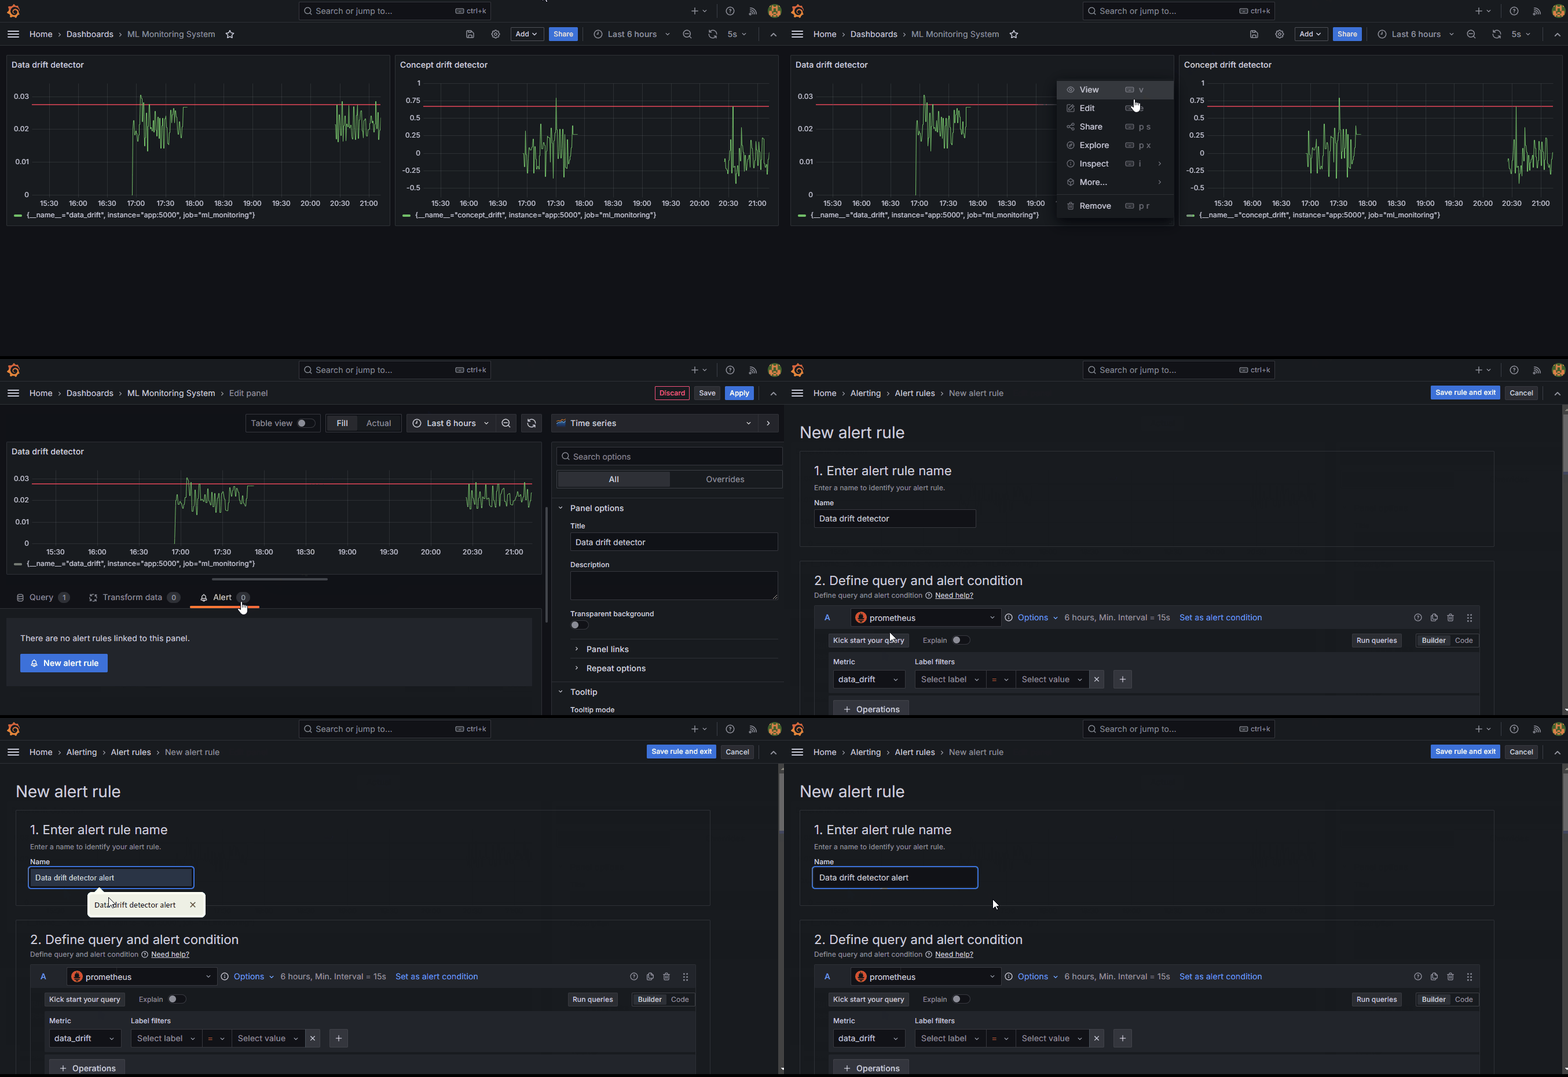
4. Under “2. Define query and alert condition”, click on “Code” and then, “Run queries” button:
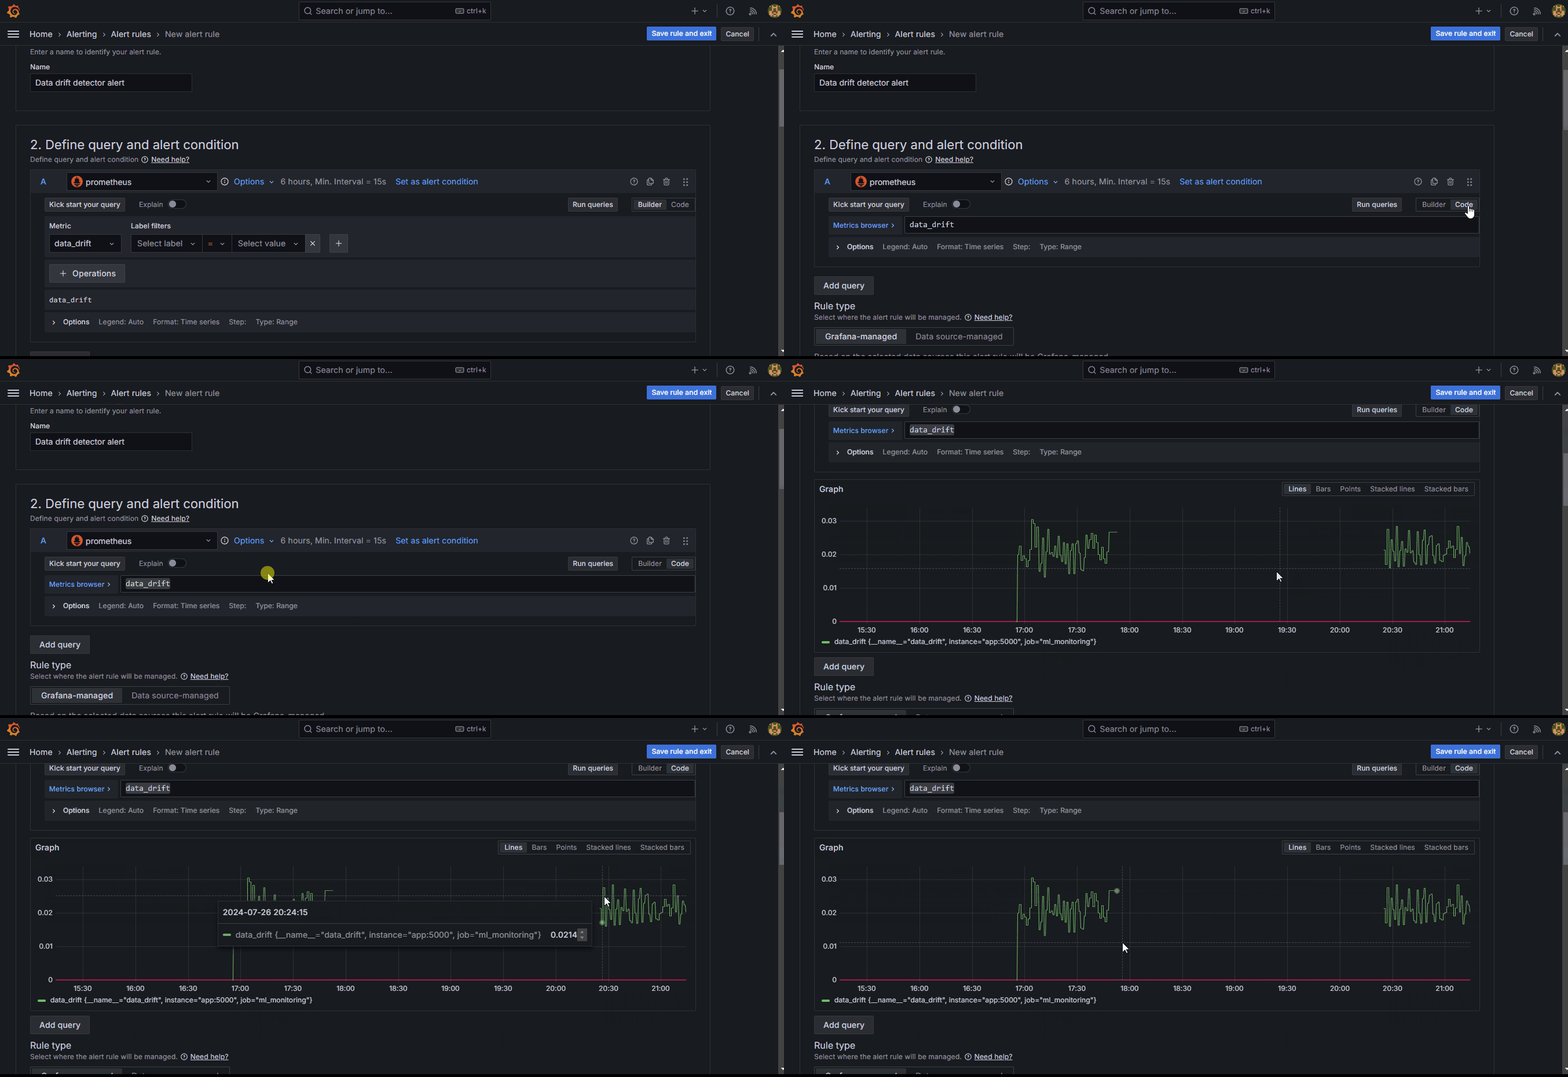
This will choose the “data_drift” metric as the first input (A) to the alert.
5. Scroll down to the “Expressions” section and under “Thresholds,” set a custom threshold.
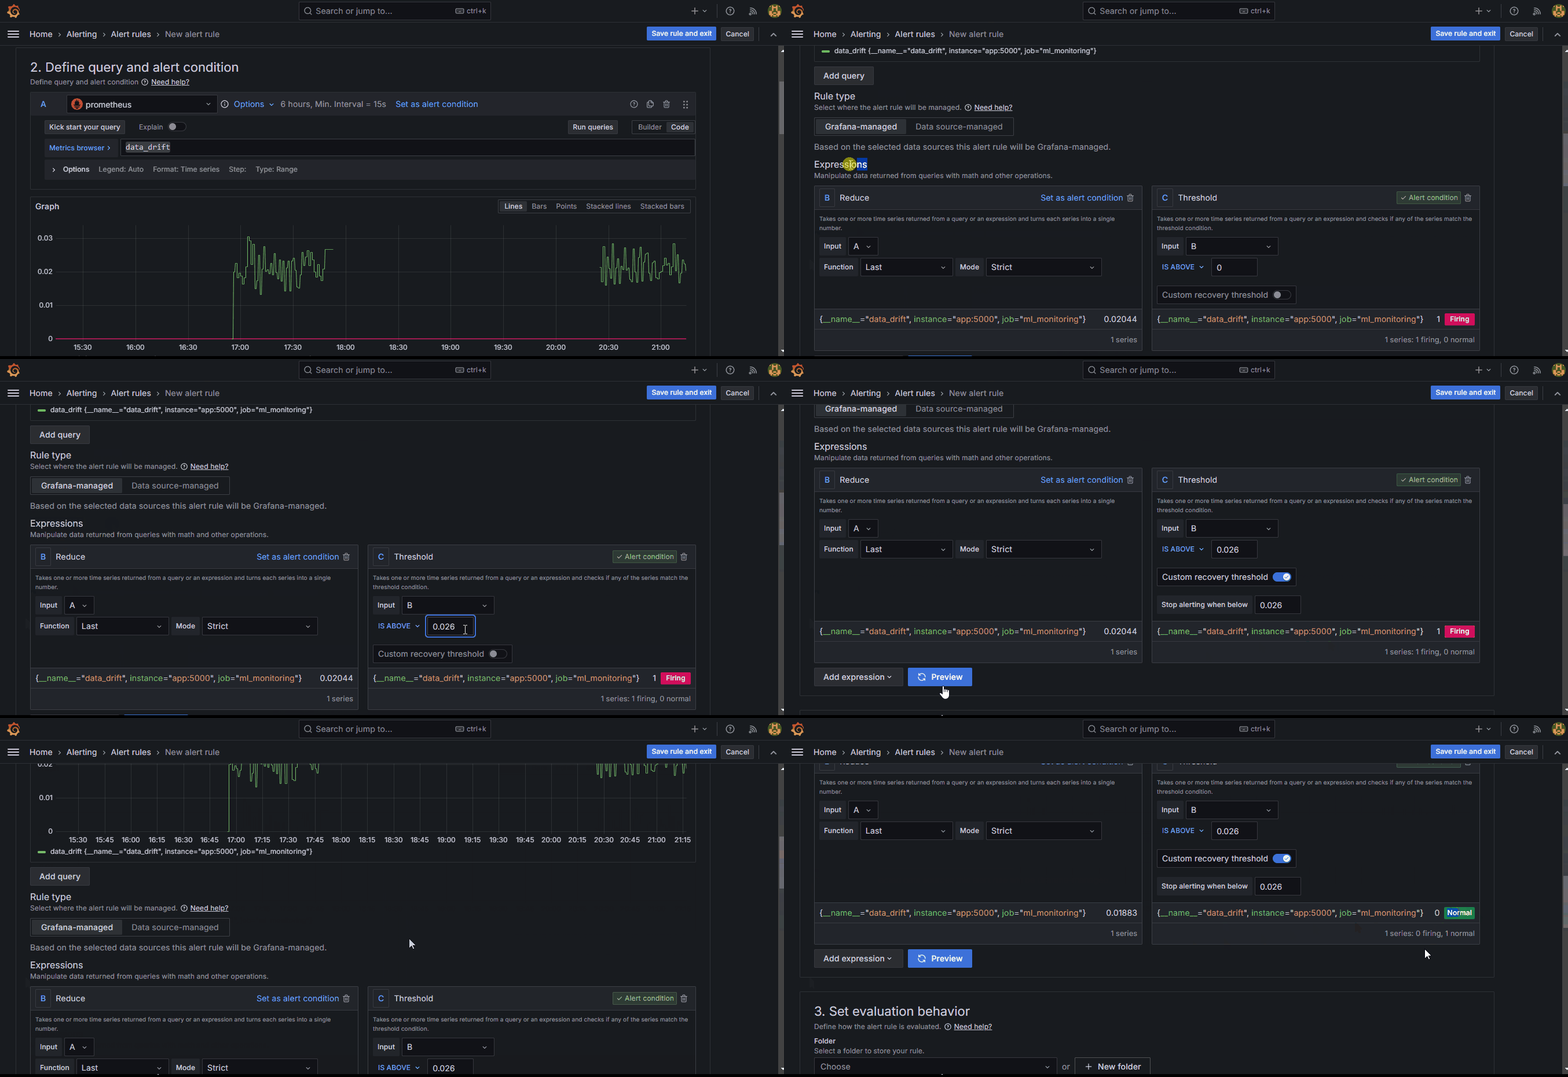
Setting the threshold to 0.026 makes the system fire an alert when the drift score exceeds that amount. As soon as you click “Preview,” you should see the red line above jump.
6. Scroll down to “3. Set evaluation behavior” section and set “Pending period " to "None". This causes alerts to fire immediately when the condition is met.
7. Also, choose folders and groups to save evaluation rules (this is a requirement).
8. Under “4. Configure labels and notifications”, choose the Discord webhook point as the contact point. You can choose it via its name.
9. Under “5. Add annotations”, add a brief but optional summary that will be displayed in the alert message.
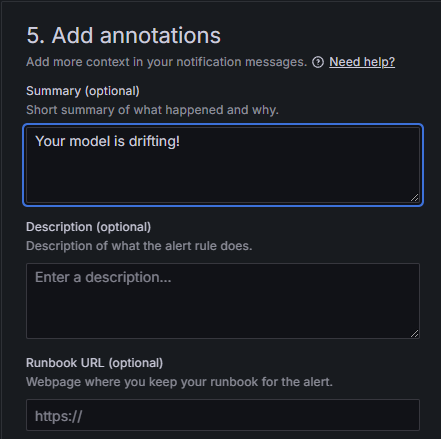
10. Finally, click on the “Save rule and exit” button in the top right corner.
That should return you to the metric alerts tab:
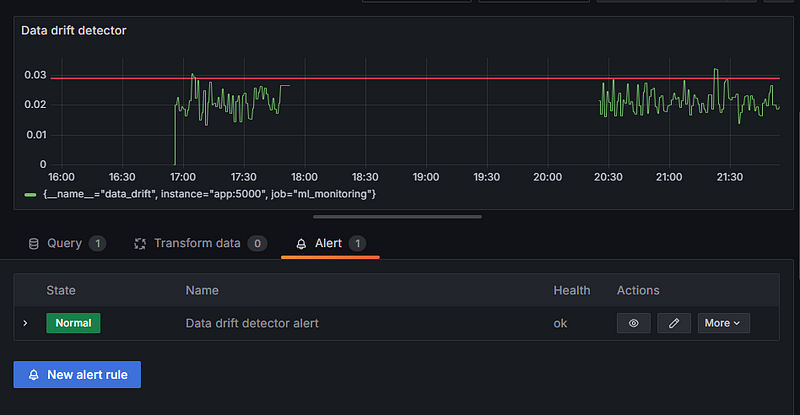
Click “Apply” to save all the changes.
Now, you can occupy yourself with other tasks while the system takes care of babysitting your model. When it starts misbehaving, you will receive an alert on Discord. Here is what it looks like:
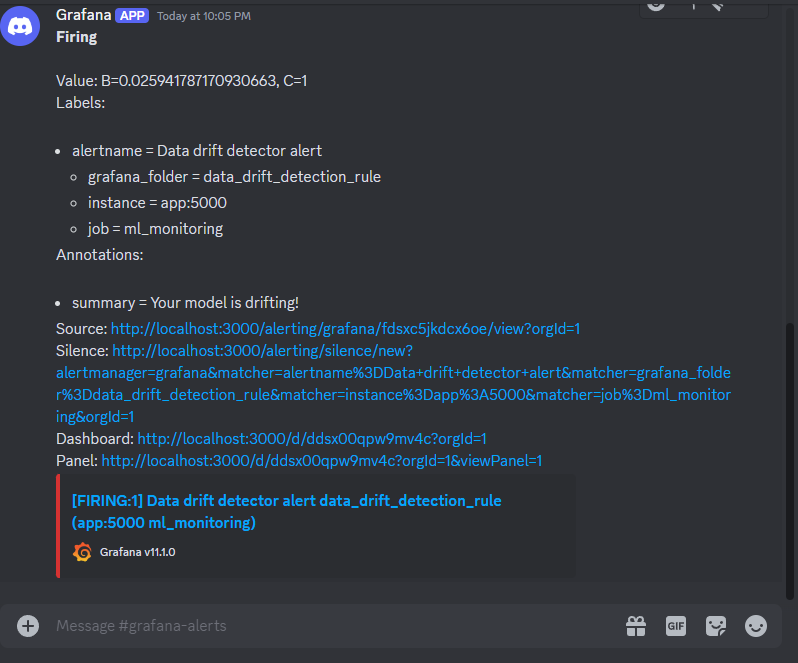
Conclusion
Even though we went through many steps, the system we’ve built is for a simple regression problem. Rebuilding the same system for a production environment could easily take a few weeks as you have so many aspects to think about:
- Developing a solid pipeline.
- Building a production-grade model.
- Implementing drift detection strategies.
- Shipping the model and detection algorithms into a single API.
- Containerizing the applications.
- Deploying the entire service online (which we haven’t covered).
Here is a list of resources that might help while you execute each of the above stages:
- MLOps Roadmap: A Complete MLOps Career Guide
- MLOps Fundamentals
- MLOps Deployment and LifeCycling Course
- Machine Learning, Pipelines, Deployment and MLOps Tutorial
Thank you for reading!

I am a data science content creator with over 2 years of experience and one of the largest followings on Medium. I like to write detailed articles on AI and ML with a bit of a sarcastıc style because you've got to do something to make them a bit less dull. I have produced over 130 articles and a DataCamp course to boot, with another one in the makıng. My content has been seen by over 5 million pairs of eyes, 20k of whom became followers on both Medium and LinkedIn.
