
Track
Machine Learning Fundamentals in Python
16 hr
A machine learning model with 98% accuracy sounds impressive–but is it? When you are dealing with rare events like fraud or disease, accuracy often creates a false sense of security.
That is where precision and recall come in. In this article, we will look at how these two metrics go beyond simple accuracy to measure not just how often you are right, but exactly how you are wrong.
If you want to move beyond theory and master classification, the Fraud Detection in Python course is the perfect next step.
In most situations, accuracy is the natural metric used to measure how well a statistical or machine learning model predicts a certain label. It is calculated by comparing the number of correctly predicted instances to the total number of observations.
Generally speaking, if a model consistently identifies the correct label with high accuracy, it is working well. However, imbalanced datasets, in which one class contains significantly more samples than the other, distort accuracy. Such datasets are common in fraud detection or disease diagnosis.
Let’s suppose a model classifies fraud with a 98% accuracy rate. At first blush, this rate seems fantastic. But what if fraud only accounts for 2% of the transactions in the dataset? In this case, a model could choose "not fraud" every time and still get that 98% accuracy rate while catching zero fraud, which is not what we want.
Clearly, these kinds of situations require more nuanced metrics. Two commonly used metrics are precision and recall.
Here is the short version:
To understand how to calculate these metrics, however, we first need to define the terminology used in a confusion matrix.
Consider a credit card company that uses a machine learning model to detect fraudulent credit card transactions. Suppose that for a sample of 10,000 transactions, there were 9,800 legitimate transactions and 200 instances of fraud.
To measure the effectiveness of the model, designate one of "fraud" or "not fraud" as the positive case and the other as the negative case. Since the fraud cases are of interest, label these as the "positive" cases. (This, of course, doesn't imply that fraud is positive in an ethical sense; the “positive” label just signifies which case we're interested in.)
When the model is run, transactions with a risk score above a certain probability threshold, say 70%, are considered to be fraud. The cases predicted to be fraudulent are compared to those that actually are.
To keep all this data straight, we use the following nomenclature.
The second letter (P or N) indicates whether the prediction was positive or negative, and the first letter shows whether that prediction was true (T) or false (F).
A "false positive" indicates that the system predicted the case to be positive, but it was actually negative. For instance, a false negative is a case that was predicted to be negative, yet is actually positive.
All this information is commonly displayed in the so-called confusion matrix, which tracks how often the model confuses incorrect predictions with actual results (FN, FP). The confusion matrix helps us distinguish between what the model predicted and what actually happened. The confusion matrix of our example looks like this:
|
Actual fraud (actual positive) |
Actual legitimate(actual negative) |
|
|
Predicted fraud(predicted positive) |
160 (TP) |
300 (FP) |
|
Predicted legitimate(predicted negative) |
40 (FN) |
9500 (TN) |
Now, let's take a look at the row and column totals. The row sums indicate total predicted cases, and the column sums indicate total actuals.
|
Actual fraud (actual positive) |
Actual legitimate (actual negative) |
||
|
Predicted fraud (predicted positive) |
160 (TP) |
300 (FP) |
460 (TP + FP) Total predicted positives |
|
Predicted legitimate (predicted negative) |
40 (FN) |
9500 (TN) |
9540 (FN + TN) Total predicted negatives |
|
200 (TP + FN) Total actual positives |
9800 (FP + TN) Total actual negatives |
10,000 |
What do these totals represent?
Precision measures the quality of your positive predictions. It tells us how many cases predicted to be positives were actually positives.
A precise model means having very few false alarms. If the model says something is true, it most likely is true. For instance, if an online game bans someone for cheating, it needs to be true. Too many undeserved bans alienate legitimate users and lead to negative reviews.
In the terminology examined above, precision equals the ratio of true positives to predicted positives.

In the example above, precision is 160/460, or about 34.8%.
Recall measures coverage. It shows us how many of the actual positives were predicted as such. It is defined as the ratio of true positives to total actual positives.

Consider cancer diagnoses for initial follow-up. Is it better to err on the side of over-diagnosing or under-diagnosing? Most people would agree on the former.
For early screening, it can be shocking to receive a false alarm. But it is catastrophic to be told you don't have cancer when you actually do, especially considering you might miss a potentially life-saving treatment.
In the example above, recall is 160/200, or 80%.
There is a tug-of-war relationship between precision and recall. Typically, as precision increases, recall decreases, and vice versa.
To see why, let's revisit the fraud example.
Most fraud was caught, but there were many false positives. Let’s say, because of customer complaints, management decided to increase the decision threshold from 0.7 to 0.8. For a transaction to be flagged as fraud, it must now have a score of at least 0.8 instead of 0.7.
This made the model more conservative. It predicted fraud less often. Fewer transactions were flagged incorrectly as fraud, but at the cost of more truly fraudulent cases slipping through. After changing the threshold, the number of false positives decreased from 300 to 60, but the number of false negatives increased from 40 to 80.
The confusion matrix of the new model looks like this:
|
Actual fraud (actual positive) |
Actual legitimate (actual negative) |
||
|
Predicted fraud (predicted positive) |
120 (TP) |
60 (FP) |
180 (TP + FP) Total predicted positives |
|
Predicted legitimate (predicted negative) |
80 (FN) |
9740 (TN) |
9820 (FN + TN) Total predicted negatives |
|
200 (TP + FN) Total actual positives |
9800 (FP + TN) Total actual negatives |
10,000 |
As we can see, 120 of the 180 predicted fraud cases were actually fraudulent, so the precision increased from 34.8% to 66.7%.
The price for this increased precision lies in a reduced recall: 120 of 200 fraudulent cases were predicted as such, which means the recall dropped from originally 80% to now only 60%.
The model now catches fewer fraud cases overall, but when it does flag fraud, it's much more confident. It shows us the importance of balancing both metrics, which we’ll get to later.
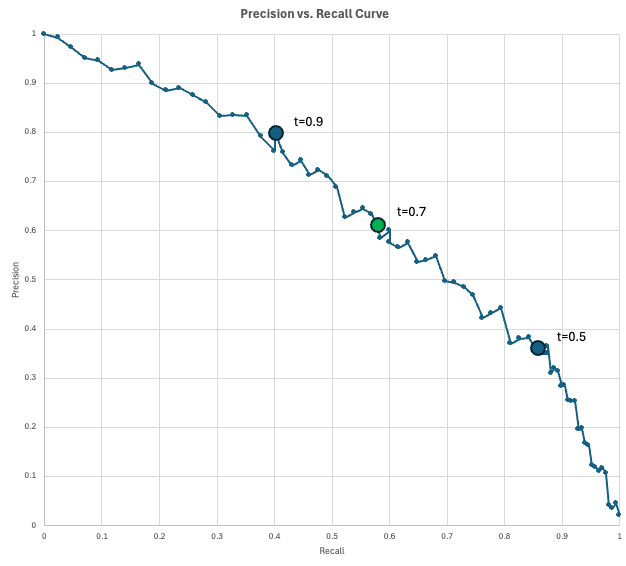
To visualize the trade-off between precision and recall, data scientists use the Precision-Recall (PR) curve.
This chart plots precision on the y-axis and recall on the x-axis for every possible decision threshold (from 0 to 1). As you lower the threshold to capture more positive cases (increasing recall), you inevitably flag more false alarms (decreasing precision).
The "perfect" model would reach the top-right corner (100% precision and recall), but in reality, you must choose a point on this curve that meets your specific business requirements.
In our fraud example, we have a model that outputs a fraud score for each transaction. If a transaction's score is at least the threshold, then it is flagged as fraud. As we lower the threshold, we get more predicted positives, which typically captures more true positives (increasing recall) but also more false alarms (decreasing precision).
Let's see what all this might look like in practice. Suppose your company processes 10,000 transactions per day. Since the fraud rate is estimated to be 2%, you expect 200 fraudulent transactions per day. Also, suppose the fraud operations team can review 200 flagged transactions (predicted positives) per day.
You evaluate a few thresholds and find these results:
The curve tells you what precision you can buy at a given recall rate (or vice versa).
Because of the trade-off relationship between precision and recall, the correct metric depends on your particular use case.
There is an inverse relationship between precision and false positives. Therefore, a precise model is one that correctly differentiates between true positives and false positives. It is trustworthy.
Optimize for precision when the cost of a false positive is high. Examples of cases include:
Similarly, there is an inverse relationship between recall and false negatives. Many false negatives induce a low recall. Accordingly, a model with high recall correctly differentiates between true positives and false negatives. It is safe.
If it is more important to avoid missing a real case than it is to accept false alarms, you should prioritize the recall metric over precision. Example use cases include:
If you are unsure whether to optimize a model for precision or recall, or simply want to take both into account, you can consult the F1 score.
The F1 Score is defined as the harmonic mean of precision and recall, and is used when you want to aim for a balance between the two metrics.

If precision and recall are equal, the F1 score is equal to that value. If one of the two approaches zero, however, F1 will also be very low.
In the example above, precision is 66.7% and recall is 60%. Using the formula mentioned above, we get a F1 score of about 63.2%:

The following table compares the F1 score to accuracy, precision, and recall.
|
Metric |
Question it answers |
When to optimize on this metric |
Examples |
|
Accuracy |
"How often are we correct overall?" |
Classes are balanced, and FP and FN costs are similar. |
Digit classification. |
|
Precision |
"Of all predicted positives, how often were we correct?" |
When FPs are expensive, punitive, or create customer pain. |
Fraud blocks, banning users, and invasive medical actions. |
|
Recall |
"Of all actual positives, how many did we flag?" |
False negatives are unacceptable. |
Medical screening, intrusion detection. |
|
F1 |
"What is the balance of precision and recall?" |
You care about both: positives and false alarms. |
Early model selection for imbalance problems. |
There are many ways to calculate precision, recall, and the F1-score in Python. In the following, I will present two approaches: applying the formulas directly and using designated formulas in the scikit-learn package.
If you know the numbers of the confusion matrix, you can easily calculate the metrics using their formulas presented above.
# Confusion matrix numbers
TP = 120
FP = 60
FN = 80
TN = 9740

# Formulas
precision = TP / (TP + FP)
recall = TP / (TP + FN)
f1 = 2 * precision * recall / (precision + recall)

# Output
print(f"{'Precision':<10} {precision:.1%}")
print(f"{'Recall':<10} {recall:.1%}")
print(f"{'F1':<10} {f1:.1%}")
Precision 66.7%
Recall 60.0%
F1 63.2%The output of this code agrees with our earlier calculations.
You can also learn the scikit-learn library to calculate metrics from the data itself. In the following example, we simulate y_true and y_predicted. We then calculate precision using the method precision_score(y_true, y_false). We calculate recall and the F1 score similarly. Finally, we will output the results.
import numpy as np
from sklearn.metrics import precision_score, recall_score, f1_score

# Simulate Data (y_true and y_pred)
TP, FP, FN, TN = 120, 60, 80, 9740
y_true = np.array(TP * [1] + FP * [0] + FN * [1] + TN * [0])
y_pred = np.array(TP * [1] + FP * [1] + FN * [0] + TN * [0])

# Compute metrics with scikit-learn
precision = precision_score(y_true, y_pred, zero_division=0)
recall = recall_score(y_true, y_pred, zero_division=0)
f1 = f1_score(y_true, y_pred, zero_division=0)

# Print aligned output using f-strings (no manual spaces, no colon)
print(f"{'Precision':<10} {precision:.1%}")
print(f"{'Recall':<10} {recall:.1%}")
print(f"{'F1':<10} {f1:.1%}")
Precision 66.7%
Recall 60.0%
F1 63.2%As expected, these numbers agree with our earlier calculations.
While accuracy is a helpful starting point, it often hides the details you need to understand why a model is failing. Precision and recall give you a clearer picture by forcing you to look at the trade-off between false alarms and missed detections.
Ultimately, choosing the right metric isn't just a math problem; it is a practical decision about which type of mistake your system can afford to make.
Ready to build your own machine learning models? Start with the Machine Learning Fundamentals in Python skill track today!
Machine Learning Courses
Track
Track
Course
blog
Abid Ali Awan
9 min
Tutorial
Vidhi Chugh
Tutorial
Vidhi Chugh
Tutorial
Mark Pedigo
Tutorial
Sayak Paul
Tutorial
Sayak Paul