HomeAbout TableauLearn Tableau

What can you do with Tableau?

Ever wondered what you can do when you master Tableau? We explore the potential uses for this versatile tool. Start your journey to Tableau mastery today
Jul 2022  · 3 min read

What can you do with Tableau

Many businesses have long forgotten about manual spreadsheets. What was once a laborious task is now transformed into a fast and intuitive one, thanks to business intelligence tools such as Tableau.

So how did Tableau transform spreadsheet-making from a daunting task that people avoided to a popular job that is enjoyable and interactive? First, tableau’s inclusive platform makes it easy for anyone to use it. Additionally, with Tableau, you do not need any prior data science or technical skills to make the most out of the platform. Instead, you can start turning raw data into actionable intelligence with relative ease. Check out some of the things you can do when you master Tableau with the examples below.

What Can You Do When You Master Tableau For Data Analysis?

1. Visualize your data with beautiful no-code plots and charts
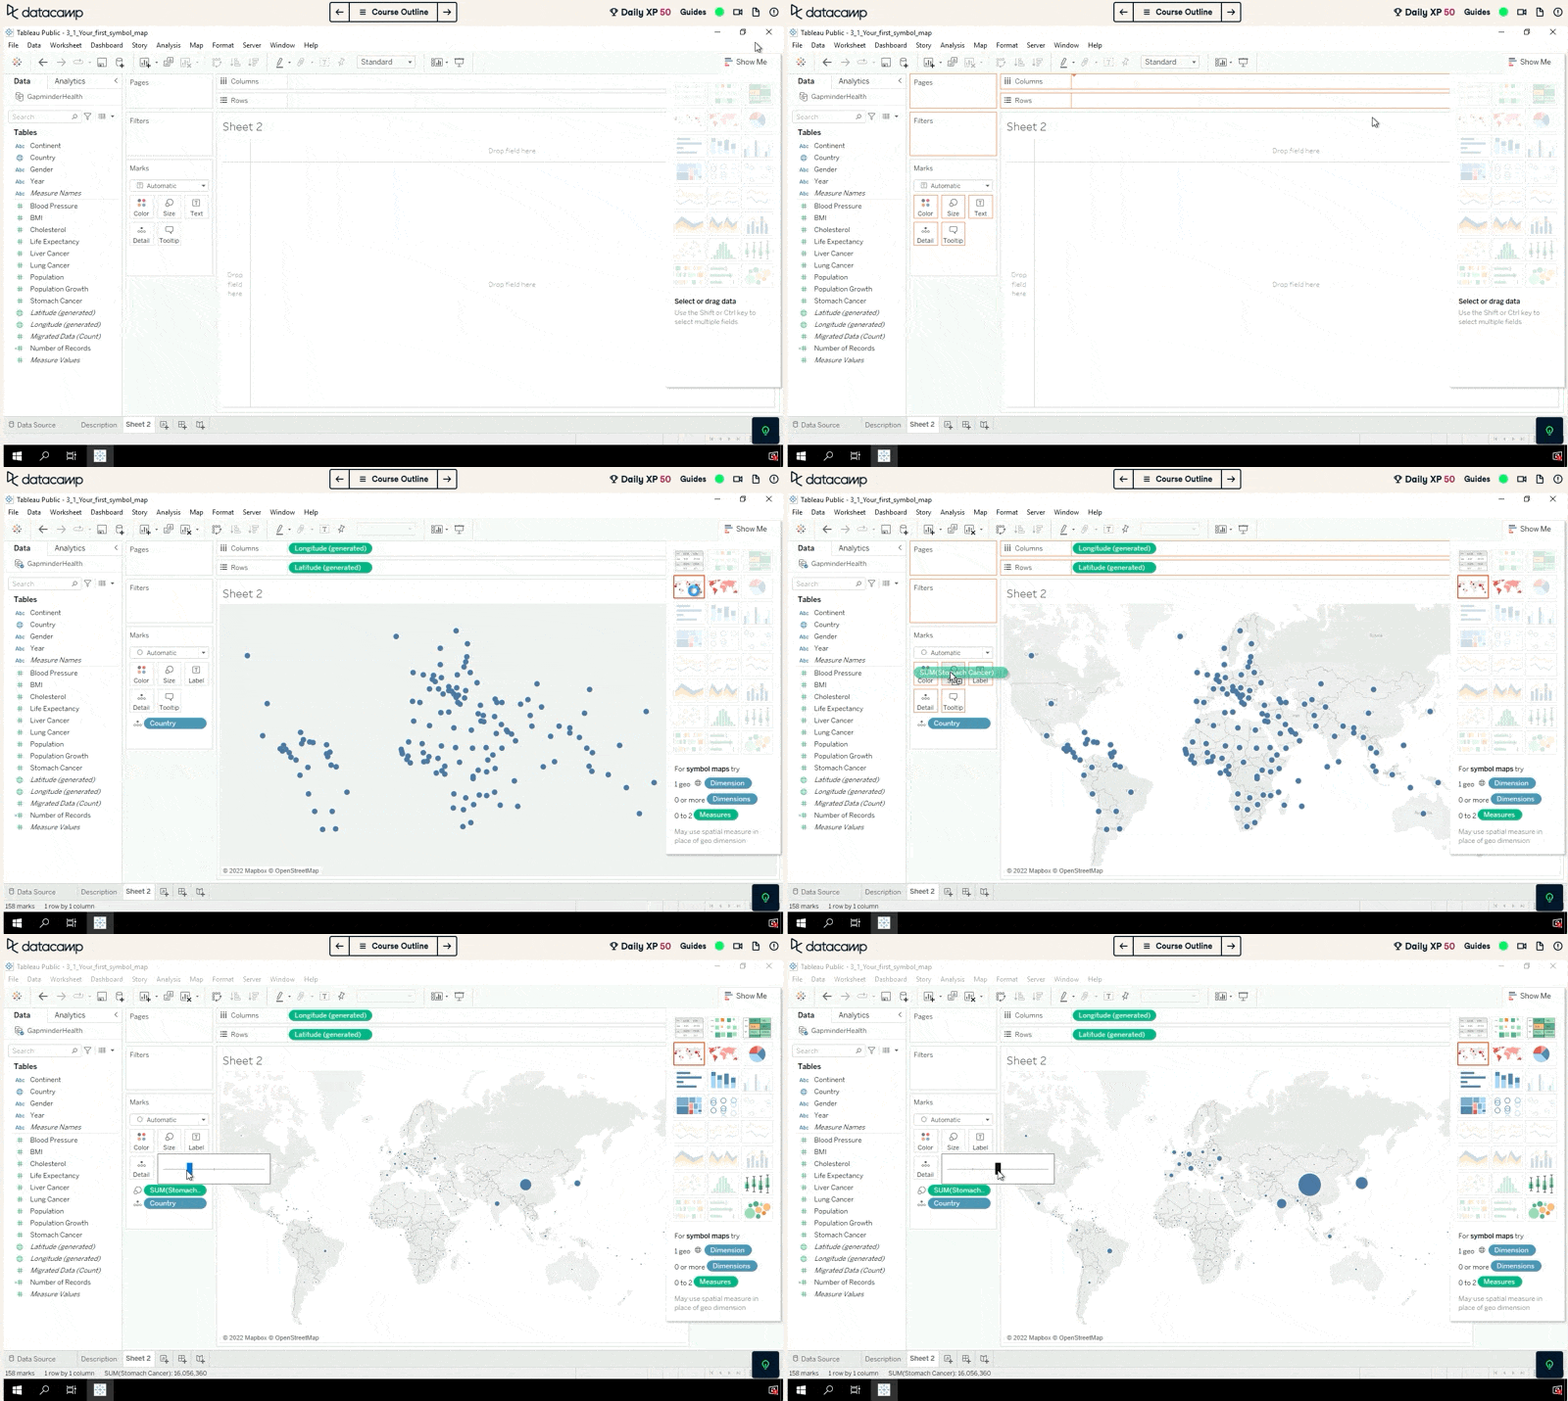
Visualize data with no-code plots and charts gif

Tableau's plotting and charting tools are powerful and easy to use and require no coding at all. From traditional plots like bar plots and line plots to business focussed charts and gauges, Tableau has it all. By mastering data visualization in Tableau, you’ll be able to create beautiful, customizable charts, and create impact with your analysis. 

How to get started

2. Manipulate, transform, and calculate on your data
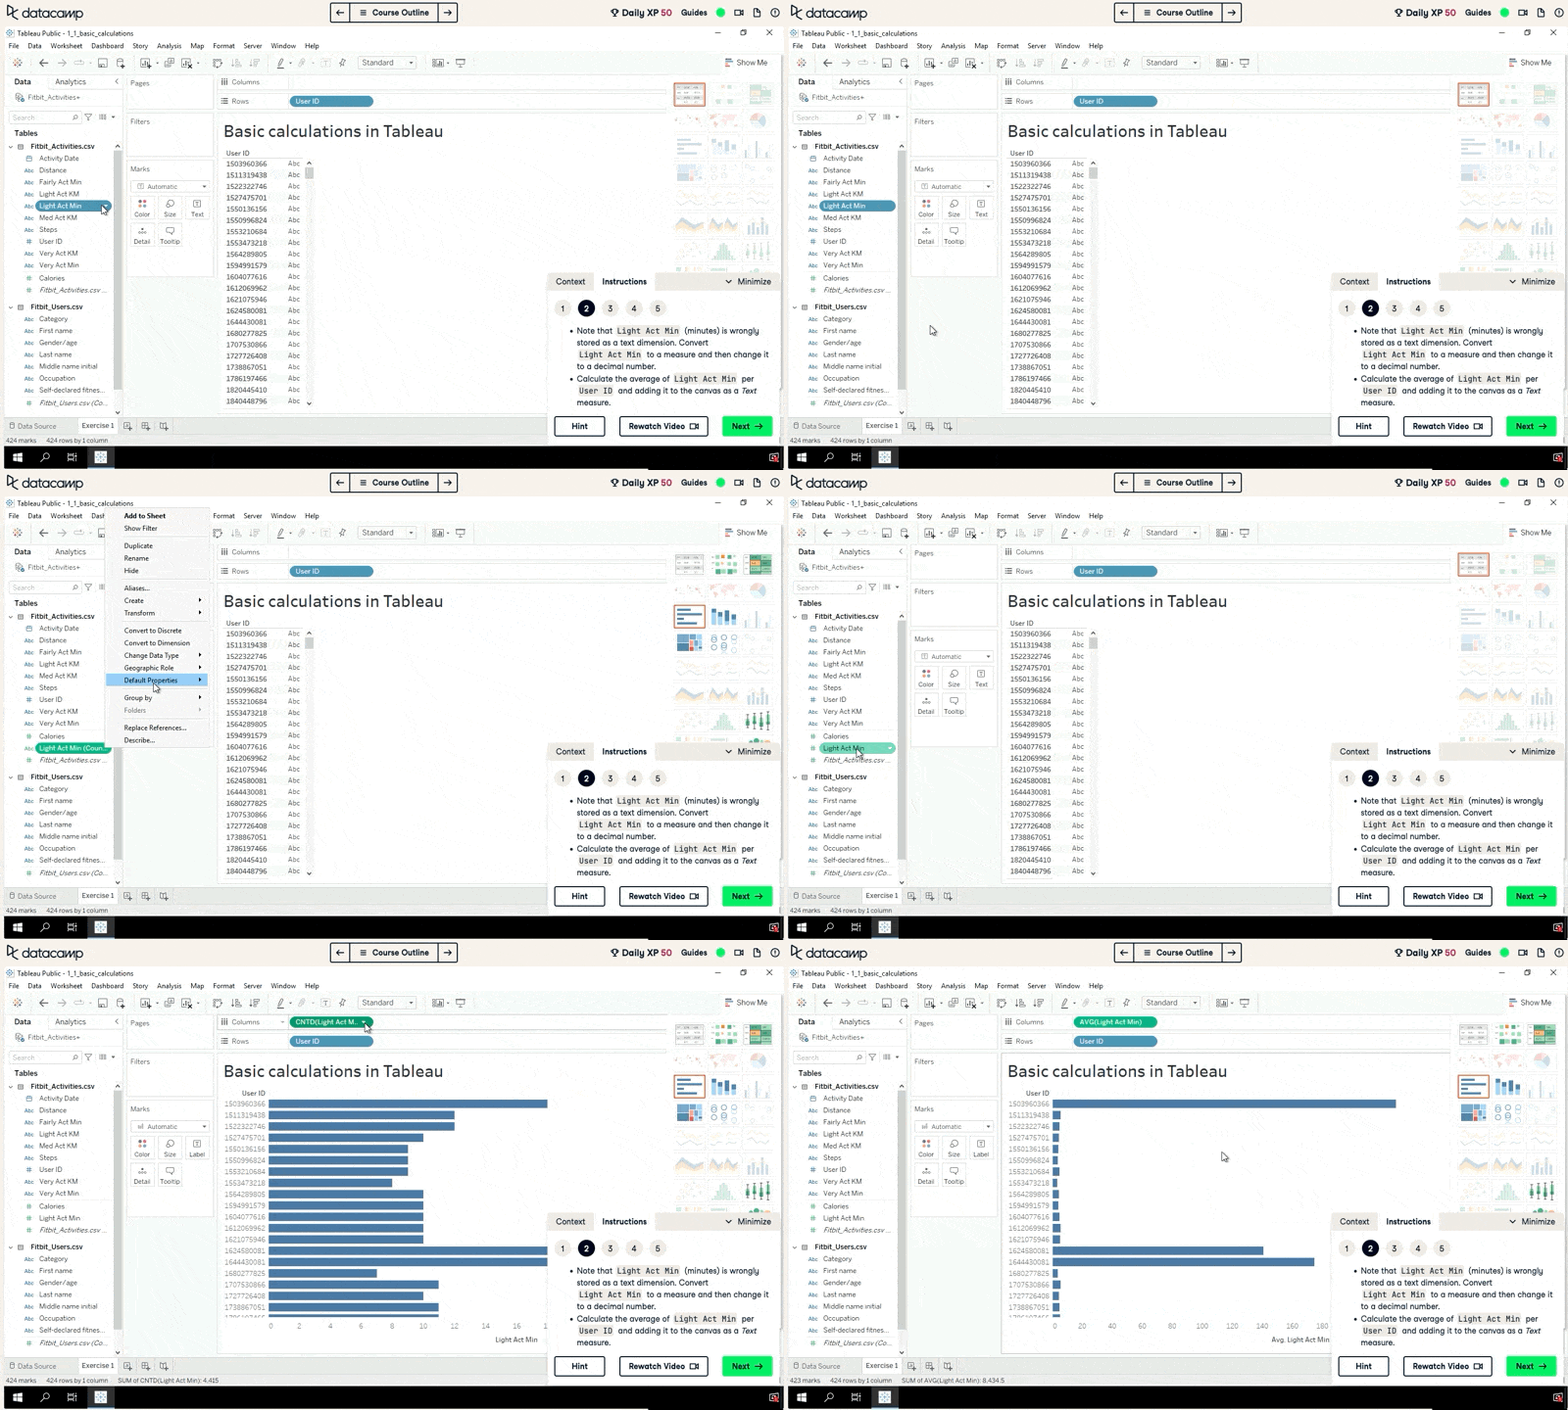
Manipulate, transform, and calculate on your data gif

As every data analysts know, data is never in the format you want when you get it. Fortunately, Tableau includes powerful tools to prepare and transform your data for analysis. With Tableau, you’ll create robust data transformations that take your data from raw, to ready for analysis. 

How to get started

3. Tell your data's story with interactive dashboards
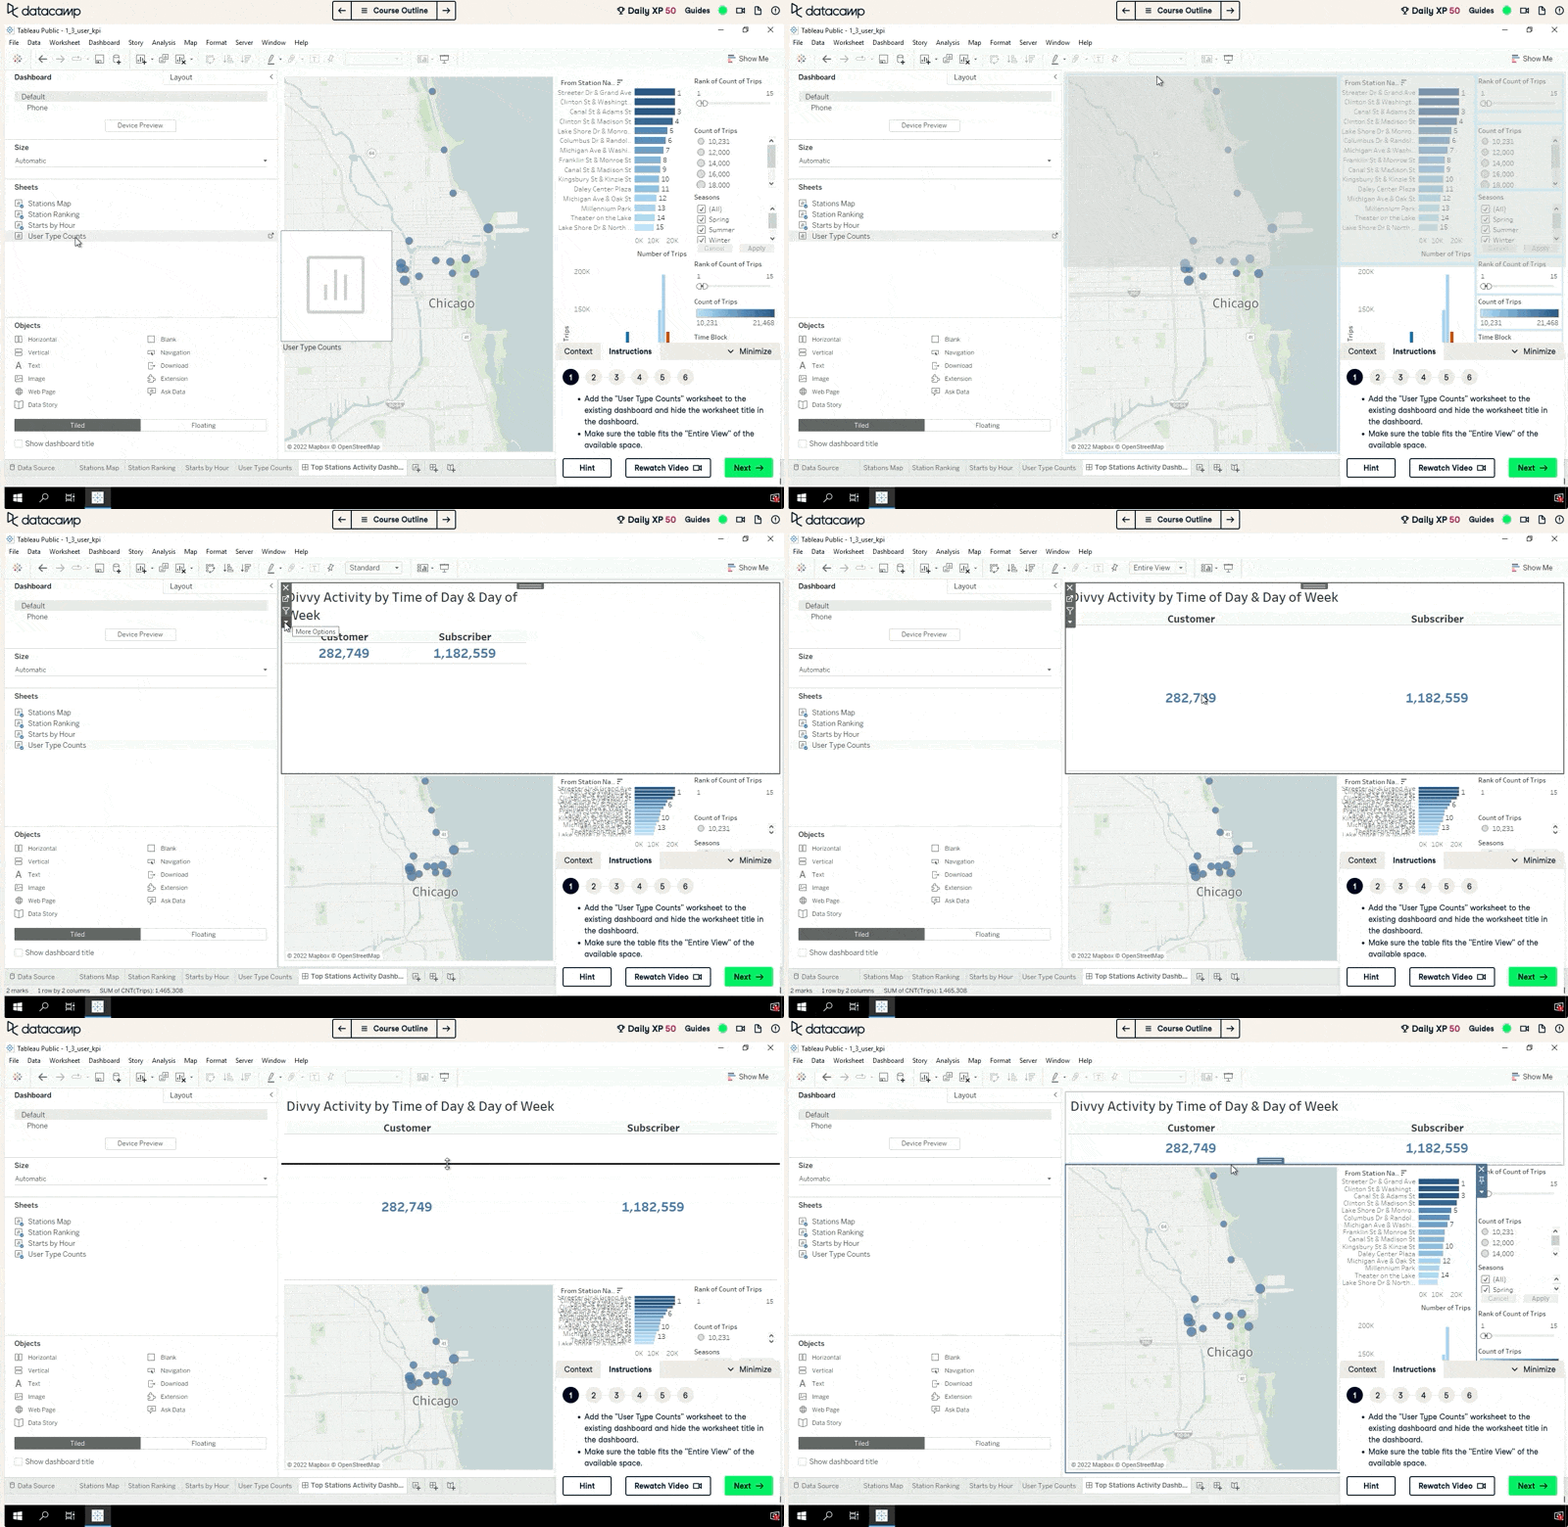
Tell your data's story with interactive dashboards gif

At its heart, Tableau is all about creating interactive dashboards to help you understand your data. DataCamp’s Tableau curriculum is designed to get you from zero to insights as fast as possible. 
How to get started

Tableau Courses

Introduction to Tableau

BeginnerSkill Level
6 hr
186.7K
Start your Tableau journey with our Introduction to Tableau course. Discover Tableau basics such as its features and dashboards.
See DetailsRight Arrow
Start Course
See MoreRight Arrow
Related

What is Data Analysis? An Expert Guide With Examples

Explore the world of data analysis with our comprehensive guide. Learn about its importance, process, types, techniques, tools, and top careers in 2023
Matt Crabtree's photo

Matt Crabtree

15 min

6 Tableau Projects to Help Develop Your Skills

Explore our list of Tableau projects for beginner and intermediate learners across different industries and use cases.
Jess Ahmet's photo

Jess Ahmet

6 min

11 Data Visualization Techniques for Every Use-Case with Examples

Discover the most popular analyses, techniques and tools to master the art of data visualization wizard
Javier Canales Luna's photo

Javier Canales Luna

16 min

What is Microsoft Fabric?

Discover how Microsoft Fabric revolutionizes data analytics and learn about how its core features empower businesses to make data-driven decisions.
Kurtis Pykes 's photo

Kurtis Pykes

10 min

How to Pass the PL-300 Power BI Certification

Learn how to pass the PL-300 certification exam for Power BI—one of the world’s most popular business intelligence tools—in this convenient cheat sheet!
Richie Cotton's photo

Richie Cotton

7 min

Performance and Scalability Unleashed: Mastering Single Table Database Design with DynamoDB

One table to rule them all: simplify, scale, and supercharge your NoSQL database!
Gary Alway's photo

Gary Alway

16 min

See MoreSee More