Staying competitive in the digital era
Most organizations have embarked on digital and data transformation to survive and thrive in an increasingly hyper-connected and digitized world. Because of this, businesses are now generating enormous volumes of data which they can use to make better decisions. To maximize the return on data, analysts need to be empowered with the best business intelligence tools to extract valuable insights for data-driven decision-making.
What are business intelligence (BI) tools?
Business intelligence (BI) is a set of capabilities and technologies that transforms data into actionable insights to help businesses make smarter, data-driven decisions. Business intelligence is delivered through BI tools which enable a simple drag-and-drop interface for analysts to perform activities such as:
-
Data preparation: Compiling data from multiple sources and formatting them for analysis.
-
Data querying: Obtaining answers from datasets to answer specific data questions.
-
Data visualization: Creating visual representations of analysis in charts, graphs, histograms, and more for easy understanding.
-
Performance metrics reporting: Comparing current performance to historical data and sharing results with stakeholders for decision-making.
-
Data mining: Using statistics and machine learning to uncover trends in big datasets.
Use of BI tools in the industry
The concept of BI has been around since the 1960s. Therefore, it is no surprise that dozens of well-established BI tools are already available in the market to help organizations leverage data for business analytics. The two most popular BI tools are Tableau and Microsoft’s PowerBI.
The main value of modern BI tools is that they enable self-service analytics, faster speed to insight, and an easy-to-use user interface. Instead of the conventional approach of sending requests to a central data team, modern BI tools empower staff to access data quickly and answer business questions by themselves.
Here are some examples of BI tools used in the industry:
Volvo Group used Qlik to improve the reporting efficiency of key financial results, leading to embedded, autonomous decision-making within the organization.
UChicago Medicine utilized Tableau to create real-time dashboards as part of the medical center’s data-driven operational response to the COVID-19 pandemic
Zurich Insurance Group turned to Power BI to build a unified platform for business users to mine and leverage company data more efficiently.
JPMorgan Chase adopted Tableau to shift from IT-owned to business-owned self-service analytics to keep up with rapid industry changes and optimize processes for business success.
What is Tableau?
Tableau is a BI and data visualization tool that leverages visual analytics to empower people and organizations in making the most of their data. The engaging visualizations created in Tableau help stakeholders make sense of the massive amounts of data available.
Started as a project at Stanford back in 2003, Tableau aims to make data more accessible to people through visualization. It is now a market-leading choice for modern BI and is used by organizations across all industries.
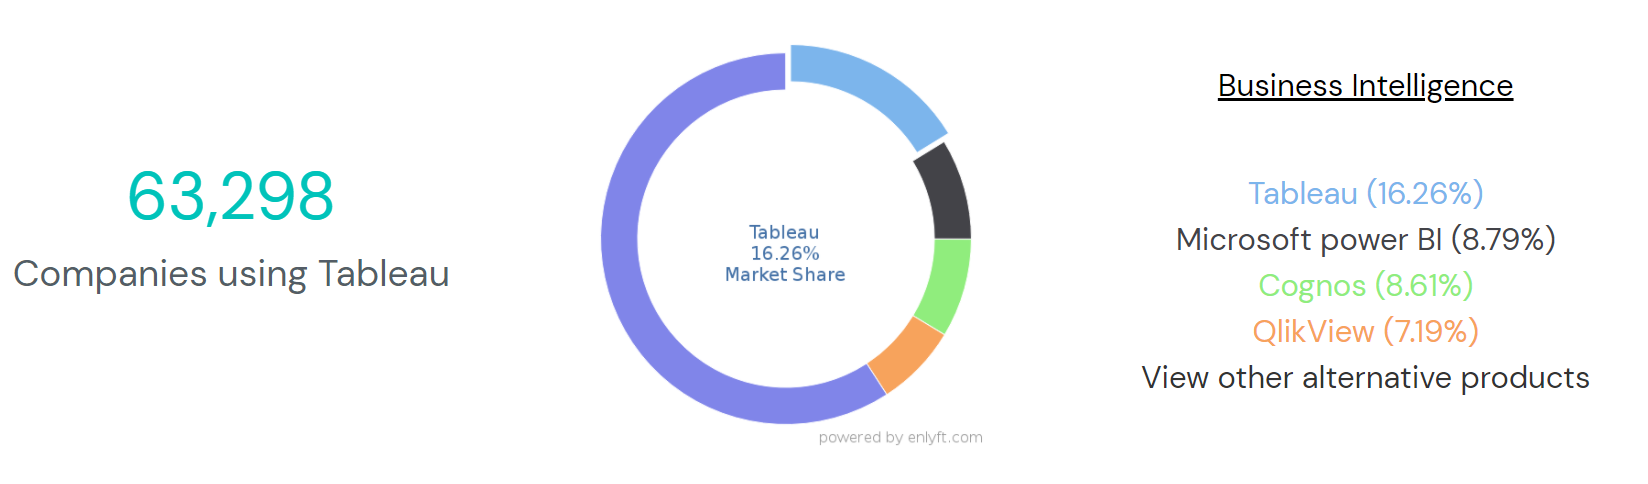
Amongst the BI tools in the market, Tableau is perhaps the most popular. Enlyft reported that Tableau has the largest market share (16.3%) amongst technologies in the BI category.
How is Tableau useful?
1. Extract data insights with no coding skills required
One of the main strengths of Tableau is its intuitive user interface that allows both technical and non-technical analysts to build data visualizations and analyses efficiently.
The user-friendly drag-and-drop interface makes it easy to answer complex data-related questions without the need for programming skills. This simplicity lowers the barrier for users to perform advanced analytics such as trend analyses, regressions, and statistical summaries.
Tableau also offers a suite of certifications for analysts to validate and prove their expertise in product knowledge and data visualization skills. This is useful in helping analysts become effective data practitioners since these certifications are highly relevant anywhere in any industry or role.
2. Democratize data insights with dashboards
A classic BI application most people will be familiar with is the dashboard, where data is obtained from multiple sources and presented visually in charts and graphs to give a sense of the company’s processes and strategies.
Tableau comes with many workbook features for users to readily create well-designed interactive dashboards. It can also connect to a wide range of data sources (e.g. SQL Server, Excel spreadsheets, Amazon Redshift etc.). As a result, these dashboards can be enriched with comprehensive data from various applications across the organization.
These dashboards go a long way in aligning an organization’s strategic efforts, uncovering critical insights, and speeding up enterprise-wide decision-making. When many users are trained to create such dashboards, data insights can be democratized at scale to help transform the business into a data-driven company.
3. Tell data stories with advanced data visualization
Compelling data storytelling is more important than ever, given the burgeoning amounts of data generated in the digital age.
Dashboards are great for monitoring data and telling users what is happening. However, data stories help shape the data into a step-by-step process to explain why specific trends are happening.
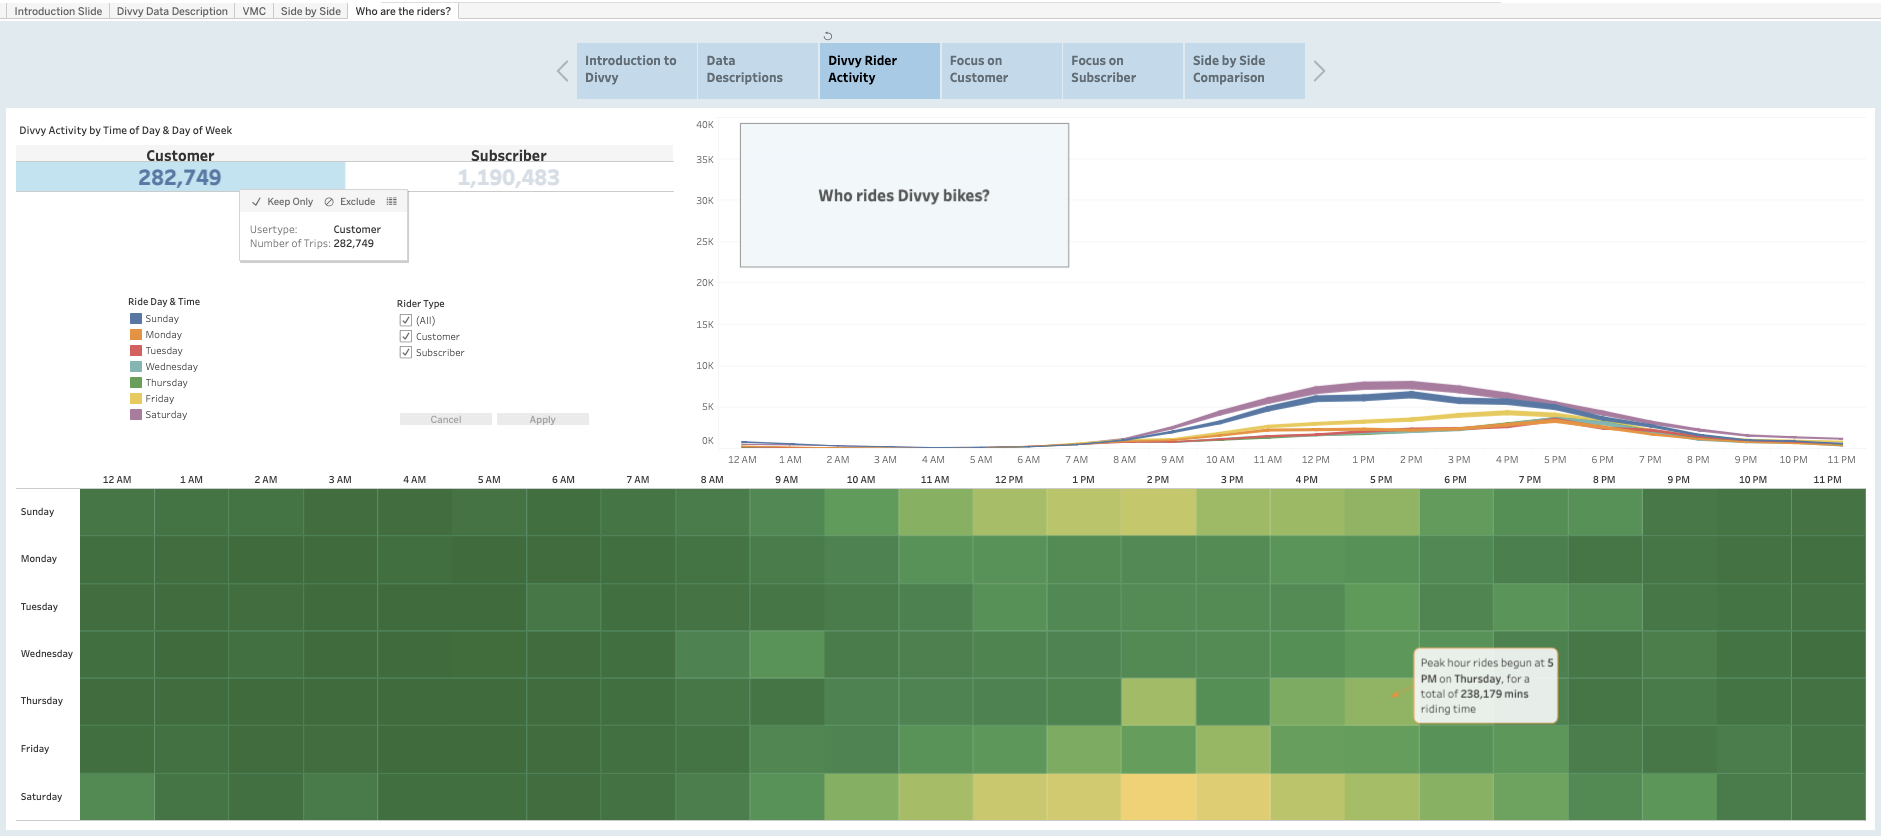
Tableau allows users to string together a series of visualizations (including dashboards) to form a visual story to communicate data insights, provide context, and demonstrate how decisions relate to outcomes. The ability to weave advanced visualizations (e.g. geospatial mapping) into a coherent data narrative is what sets Tableau apart from other tools like Excel. These data stories are highly effective in framing a compelling case to communicate actionable insights to decision-makers, which aligns with the primary goal of business intelligence.
Democratizing data science with Tableau and DataCamp
NewVantage Partners’ 2021 Big Data and AI Executive Summary revealed that only 24% of the firms are deemed data-driven. To unlock the value of data, employees need to equip themselves with tools to learn from their data effectively.
Tableau is a widely used business intelligence and analytics software trusted by companies like Amazon, Experian, and Unilever. With its user-friendly drag-and-drop functionality, Tableau empowers everyone in the organization to explore, analyze, share, and visualize business data and democratize insights for all.
DataCamp’s Tableau Fundamentals skill track will enable your team with the skills to democratize data at scale, and pass Tableau’s Desktop Specialist certification.