
Track
Alteryx Fundamentals
12 hr
Business intelligence (BI) transforms raw data into actionable insights, enabling individuals to make informed decisions and drive informed business decisions. It combines tools, methods, and strategies to help organizations understand what’s happening and respond more effectively.
In the past, BI mostly meant static reports built by analysts for executives. That’s changed. Today’s BI platforms are faster, more interactive, and designed for broader use. Teams can explore live dashboards, track key metrics, and spot patterns without needing technical expertise. From small teams improving daily workflows to large companies steering long-term strategy, BI has become part of how decisions get made. Interested in working in this field? Start with our blog post, How to Become a Business Intelligence Analyst.
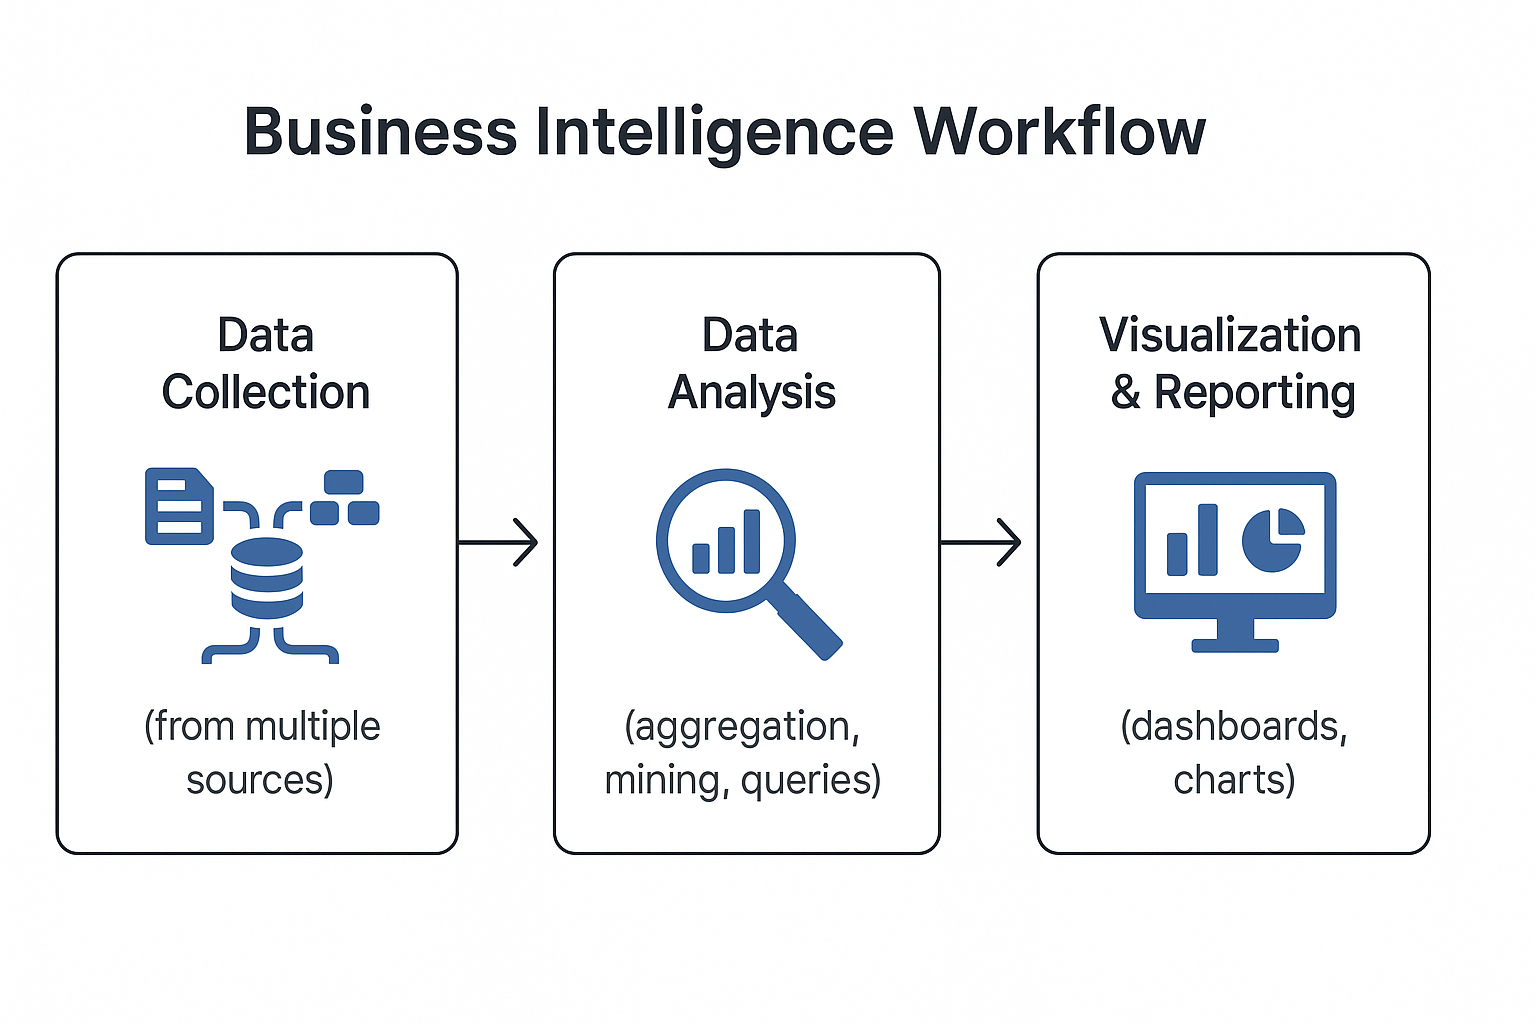
Let’s start with the basics: what does BI actually involve? At the heart of business intelligence is a straightforward goal help teams turn raw data into clear insights they can use. This usually happens in three main stages: collection, analysis, and visualization. Each stage builds on the last to support better decision-making.
It begins with data collection. Nearly every part of a business generates data, including sales records, website clicks, customer service tickets, and supply chain updates. BI systems extract this data from various platforms, clean it, and organize it in a single location, like a data warehouse or cloud database. Centralizing data like this makes it easier to work with and ensures everyone is using the exact source of truth.
Then comes data analysis. Once information is stored and structured, BI tools process it using techniques like aggregation, filtering, and pattern detection. For example, a retail company might analyze purchase trends to determine which products experience a surge in sales during the holidays or which regions exhibit declining sales.
Finally, there’s visualization and reporting. This is where insights become clear. BI tools convert processed data into dashboards, charts, or graphs that are easy to digest. These visuals help decision-makers quickly spot trends, compare performance, and dig into specific questions, without needing to sift through endless rows of raw data.
 Key components of business intelligence
Now that you’ve seen the high-level flow, let’s dig deeper into what makes BI actually work. These components are the building blocks that turn messy information into useful insights.
Data doesn’t always arrive in neat, usable formats. That’s where ETL (Extract, Transform, Load) pipelines come in. They pull data from various sources, clean it, and load it into centralized storage systems. Without solid ETL pipelines, even the best analysis would be built on shaky ground.
Once the data’s in shape, tools like Power BI and Tableau help you make sense of it visually. These platforms are built for spotting patterns quickly, even if you don’t have a technical background. If you want to get hands-on, check out Data Analyst in Power BI or Tableau Fundamentals.
BI isn’t just about pretty charts—it’s about clarity. Good BI highlights what’s important and what needs attention. That clarity leads to faster decisions, more targeted actions, and better outcomes across the board—from adjusting pricing to refining marketing.
With the core components in place, let’s look at what organizations actually gain from using BI. Across departments and industries, the benefits are tangible.
BI helps you move from guesswork to data-backed choices. With live dashboards and real-time reports, teams can respond more quickly. Whether it’s noticing a sales dip or spotting a trend in customer behavior, fast insights lead to smarter calls.
When teams work from the same data, collaboration improves. BI platforms integrate multiple data sources, breaking down silos and reducing duplicated effort. That shared visibility makes it easier to pivot when needed—and stay ahead of the competition.
BI isn’t just for leadership. Frontline teams benefit too. Sales representatives can track pipeline health in real-time. Customer support can instantly pull relevant metrics. On the customer side, data helps personalize interactions, resolve issues more efficiently, and enhance overall service. Everybody wins.
So, how does all this play out in real-world scenarios? Here are two practical examples that demonstrate BI in action within everyday operations.
An electronics company managing a global supply chain might use BI dashboards to monitor delivery times and supplier performance. If one region’s shipments are regularly delayed, BI makes that clear early, giving teams time to reroute orders or tweak schedules before delays snowball.
A SaaS company could use BI to examine its sales funnel. If a large number of leads drop off after the demo stage, BI reports can flag that bottleneck. From there, the sales team can revise their messaging or process to boost conversions.
You might have heard BI and business analytics used interchangeably, but they’re not quite the same. Let’s break it down.
Business intelligence looks backward. It focuses on descriptive analytics, helping you understand what has already happened. For instance, a retailer might review last quarter’s sales to spot high-performing products.
Business analytics, on the other hand, looks ahead. It’s about predicting future outcomes and recommending actions using predictive and prescriptive models. That same retailer could use analytics to forecast demand for next season and adjust inventory accordingly.
Ultimately, both are valuable. BI shows you where things stand today; analytics helps you prepare for what’s next.
Let’s shift gears and explore the actual tools companies use to bring BI to life. These platforms do the heavy lifting, from data integration to visualization.
Several major players dominate the space, each with strengths suited to different needs:
Dashboards and reporting features
Dashboards are where BI tools shine. They present key metrics in a glanceable view using charts, heatmaps, and more. Rather than reading through rows of numbers, you get insights at a glance. Reporting features take this further, letting you generate recurring updates or tailor views for different audiences. Need a summary for execs or a deep dive for a team? Most tools handle both. Real-time dashboards ensure decisions are based on the most current data available. Curious how AI is improving this experience? See How to Use Tableau Einstein Copilot or Power BI Copilot in Microsoft Fabric to watch these tools in action.
Of course, getting BI right isn’t automatic. Many teams hit roadblocks, especially when starting from scratch. Here’s what to watch for and how to get ahead of it.
Best practices for a smoother rollout
So where’s BI headed next? The big trend is toward self-service tools powered by AI. Instead of waiting on analysts, users can ask natural-language questions and get instant charts or summaries. Features like Tableau Einstein Copilot and Power BI Copilot are leading this change.
What’s more, modern BI tools now go beyond surface-level reports. They’re using machine learning to spot anomalies, suggest insights, and even recommend next steps based on past patterns. The result? Faster decisions and broader team participation in data work.
Business intelligence is no longer a niche tool, it’s a core part of how organizations operate. It helps teams cut through complexity, surface meaningful trends, and act with clarity.
Whether you’re streamlining internal workflows, fine-tuning marketing, or improving customer service, BI provides the visibility and speed to do it better.
If you're ready to explore how BI can enhance your team or career, start with How to Become a Business Intelligence Analyst in 2024 or explore The Top 6 Business Intelligence Tools For 2024.
The future of decision-making is data-driven—BI just makes that future a lot easier to reach.
Learn Business Intelligence with DataCamp
Track
Course
Course
blog
Joleen Bothma
9 min
blog
Wendy Gittleson
12 min
blog
Amole Oluwaferanmi
10 min
blog
Joleen Bothma
12 min
blog
Kurtis Pykes
13 min
Tutorial
Allan Ouko