Course
Business Process Analytics in R
4 hr
6.9K
One of the most valuable investments a company can make is in developing its analytical capabilities. Business analytics provides numerous benefits, and its importance cannot be overstated.
In this article, we explain what business analytics is, why it's important, the different aspects of business analytics, and the tools most commonly used. At the end of the article, we give examples of how you can use business analytics in an organization.
If you’re a business leader and you’re interested in how you can leverage data and business analytics in your company, DataCamp has an excellent skill track that will take you through everything you need to know to get there. You can also learn about business analyst certification and your options to becoming certified in a separate article.
The primary purpose of business analytics in business is to inform and drive decisions and solve problems. This is achieved through quantitative data analysis, visualization, and predictive modeling. Naturally, this requires many different skills and technologies and can differ significantly from company to company.
At a high level, business analytics can be considered an umbrella term for all analytics and data-based roles in a company. This can range from business intelligence to data analysis and even includes data science. These roles all facilitate decision-making in some way but do so using different sets of skills and technologies.
Ultimately, if a company uses data to make decisions and solve problems, then they are doing business analytics.
Business intelligence can be thought of as a sub-field of business analytics. Whereas business analytics contains broader aspects of data analytics, visualization, and predictive modeling, business intelligence is primarily concerned with building reports and dashboards to tell a story or describe the current or past state of the business.
It is essential to distinguish between business analytics and business intelligence problems so that you use the right tools and technologies or hire the right people to achieve the best solution. Business intelligence typically involves specialized software for data visualization like Power BI, Tableau, Sisense, or Qlik.
DataCamp has some highly recommended courses that will get you up to speed on how to perform data analyses in two of the most popular business intelligence tools: Power BI and Tableau.
Choose business intelligence if:
On the other hand, choose business analytics if:
Business analytics can seem overwhelming, with so much involved that you may be unsure how it can benefit your organization.
Here are four main benefits of business analytics:
Thomas Davenport describes four types of business analytics in his book Competing on Analytics. These are typically implemented gradually and in stages according to the business objectives and available technical infrastructure. As businesses advance their analytical capabilities, they also gain a more significant competitive advantage.
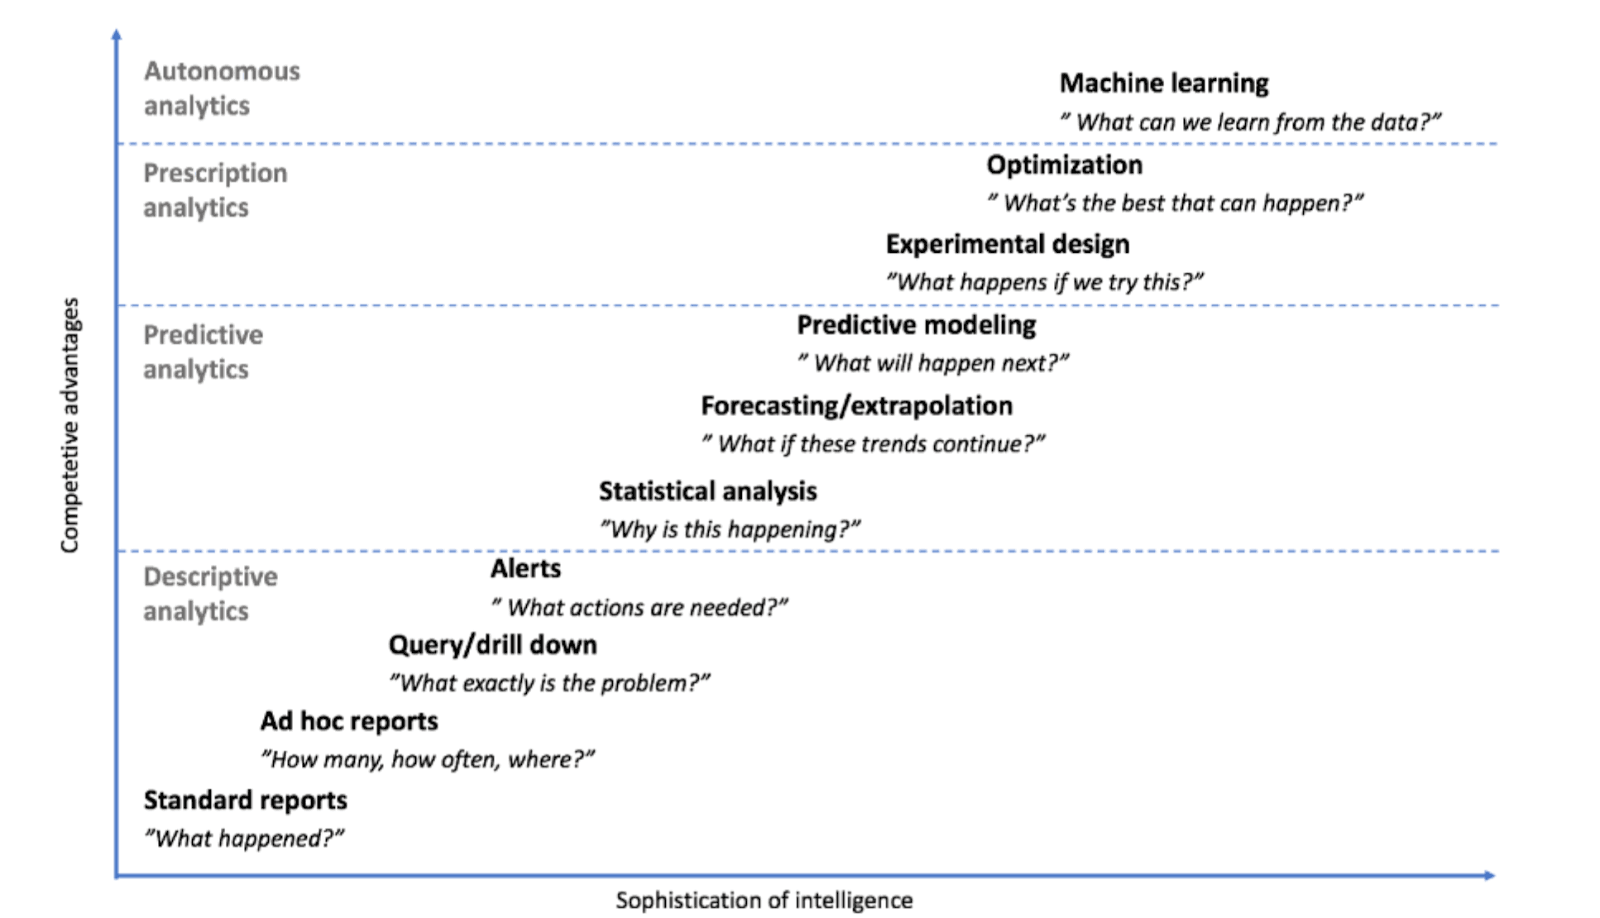
Source: Competing on Analytics
Since business analytics is often used to solve a wide variety of business problems with data, there are likewise many different tools and technologies available to achieve this. However, this is not a case of choosing a single tool to solve all problems, as no single tool exists. Instead, it's good to understand the different tools available that can be used together holistically according to the stage of analytics your business is in.
There are so many tools, technologies, and software available today that it's difficult to choose the right one for a particular problem. However, three core groups of tools can be used for most business problems and offer a great place to start:
Business analytics is used by companies in almost every industry and business unit. There is a massive opportunity for business analytics to revolutionize how a company operates daily. In this section, we go over four ways business analytics is leveraged in a company:
Bear in mind that every company is different, and business analytics is applied slightly differently based on the industry and unique use case of each company. However, the core leverage points remain similar in most cases.
One of the most crucial aspects of any marketing campaign is knowing what works and what doesn't. Using business analytics, companies can understand how effective their advertising campaigns are and why.
One of the most common ways to use business analytics in the marketing department is by running large numbers of experiments and comparing their effectiveness with A/B testing and statistical analyses. Not only do companies know which adverts and campaigns work well, but these experiments also tell them why.
Companies can also use business analytics to run advertising campaigns that target the right customers based on data such as demographics, location, and previous buying behaviors. Predictive analytics can be a powerful tool in this case to predict the likelihood that someone will respond positively to an advert.
With our online course, Marketing Analytics for Business, you can learn more about how marketing analysts use data to understand customers and drive growth.
Sales teams have two core objectives: sell to new customers and retain current customers. Business analytics can help achieve both these objectives in many different ways.
Customers can be retained by understanding why they leave in the first place - is it the customer experience, service delivery, pricing, availability of features, and so on?
The sales and marketing teams can work closely together depending on the insights uncovered from analyzing historical sales trends. For example, if it is found that there is a seasonal trend in sales volume at specific times of the year, then marketing campaigns can be targeted around these dates to get further improvements in sales.
Customer analytics is most beneficial to e-commerce and brick-and-mortar stores. It involves analyzing customer behaviors and trends and how these are influenced by pricing, brand, placement of products, and so on.
For example, using statistical techniques and concepts such as price elasticity, companies can determine the optimal price for their products and the effectiveness of promotions and discounts.
You can use technologies such as Python to gain such insights, and you can explore this topic more in our Customer Analytics and A/B Testing in Python course.
Business analytics can be applied to operations in many different ways.
In human resources departments, this can be focused on better resource planning, improved hiring practices, and retaining talent within an organization. You can learn more about HR Analytics with our online course.
Within operational teams, the focus can be on productivity, efficiencies, and assisting managers with performance assessments.
For systems, infrastructure, and IT, the focus can be on reducing downtime, better timing and frequency of maintenance, and ensuring systems are always running smoothly.
Business analytics now forms a core pillar of any company. It is no longer as feasible to grow and scale a business without some analytical capabilities. If you are a business leader, it is crucial to understand how to make data-driven decisions and solve problems with data. Take your business and your skills to the next level and reap the benefits that come when you truly take advantage of business analytics.
You can also find out more about things like business analyst salaries and how to become a business analyst with our other resources.
Business Analysis Courses
Course
Course
Course
blog
Kevin Babitz
6 min
blog
Javier Canales Luna
14 min
blog
Austin Chia
8 min
blog
Matt Crabtree
10 min
blog
Joyce Chiu
5 min
blog
Kurtis Pykes
13 min