
Track
Associate Data Engineer in SQL
30 hr
When I first started working with large datasets, I quickly ran into a familiar problem: fragmented data scattered across systems. There was no easy way to analyze it all together. I needed to compare trends over time, across regions, and by product, but traditional databases could not handle such analysis. That’s when I heard about data cubes and I started to study the idea of them.
In this guide, I will explain the fundamentals, structure, and significance of data cubes. For complementary material, I recommend taking our Data-Driven Decision Making in SQL and Database Design courses.
I'll define the idea and place it in historical context:
Data cubes are tools for managing multidimensional data in data analysis, such as in business intelligence. Unlike traditional flat data structures, such as spreadsheets or relational databases, data cubes enable a more efficient exploration of complex datasets in three or higher dimensions.
All of this is often not especially present for the analyst, so let me illustrate the idea of a data cube using an example. I’ll speak from the place of a BI analyst:
Assume you want to track retail store sales. The available data might include revenue and quantity sold, categorized by dimensions like time, product type, and store location. A data cube, which is really more of a logical or conceptual model, organizes your data so that whatever BI tool you are using can quickly generate visualizations of any combination of the dimensions I named. For example, it can be used to view total sales by product across all stores in a specific year.
Now, imagine you are looking at a spreadsheet with the columns “Time (Months)”, “Product Type”, “Store Location”, and “Revenue”. This spreadsheet doesn’t represent a data cube in structure, but it could be used to help build or populate a data cube, where each row becomes a cell formed by the unique combination of Time, Product Type, and Store Location, with Revenue as the value inside that cell.
|
Month |
Product Type |
Store Location |
Revenue |
|
January |
Electronics |
Chicago |
10,000 |
|
January |
Clothing |
Chicago |
5,000 |
|
January |
Furniture |
New York |
12,000 |
|
February |
Electronics |
Los Angeles |
8,000 |
|
February |
Clothing |
Chicago |
6,000 |
|
March |
Electronics |
New York |
9,000 |
|
March |
Furniture |
Los Angeles |
11,000 |
In a cube, these become dimensions. That is, each unique combination of time × product × location points to a cell containing revenue or quantity, and this is going to be an aggregate that pre-stored and retrieved fast (more on this later).
Data cubes first became popular in the 1990s, during the rise of data warehousing and OLAP (Online Analytical Processing). Back then, businesses needed faster, more interactive ways to analyze growing amounts of data. Data cubes met that need by organizing information into flexible, multidimensional views that made spotting trends and patterns much easier.
As technology evolved, so did data cubes. They have adapted to handle larger, more complex datasets thanks to improvements in computing power, storage, and parallel processing. Today, data cubes are no longer limited to traditional on-premise systems. They are now widely integrated into cloud-based analytics platforms. This supports real-time processing and scalable, on-demand insights for modern business intelligence needs.
It is important to break down data cubes' core components to understand how they work fully. Below are examples of each component.
Dimensions are the categorical attributes that define the structure of a data cube. You can use the dimensions to categorize and filter your data based on different segments.
Here are some common examples of dimensions used in data cubes:
Measures are the quantitative data points stored within the cube to provide insights. You can aggregate these numeric values using mathematical operations, such as sum, average, count, or maximum.
The following are examples of measures you may come across
Hierarchies organize dimensions into levels that help provide advanced analysis through operations like drill-down and roll-up. By structuring dimensions hierarchically, you can navigate from simple summaries to more detailed data views. Examples of hierarchies may include the following:
Let’s break down how a data cube is built and why its structure makes analysis so much easier.
Think of a data cube like a 3D spreadsheet where each axis represents a different way to look at your data, such as time, location, or product type. This setup lets you explore complex datasets from multiple angles at once.
For example, imagine you are analyzing retail sales. Your cube might have:
The advantages of multidimensional modeling include the following.
I will visualize the data cube to help you understand its structure and how to interpret the data it contains. Below is a simple representation of a 3D data cube:
In the diagram below:
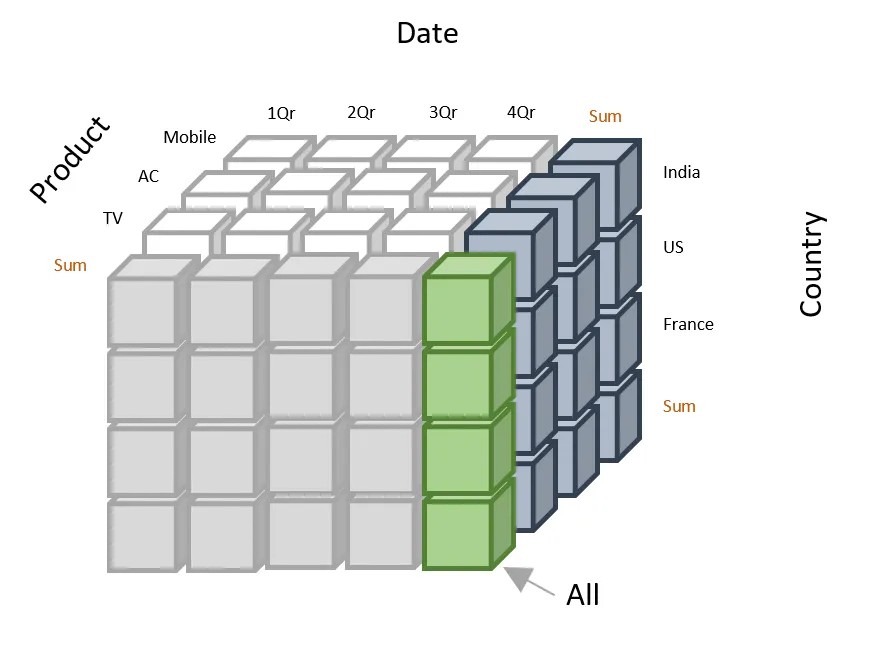
Example of data cube representation. Source: Mastering Revenue Operations
You can interpret the above data cube as follows:
The following are reasons why data cubes are used:
As I mentioned earlier, data cubes help make sense of complex information by sorting it into clear layers. This facilitates easier data access and analysis from databases.
Data cubes are designed to answer questions fast because they store pre-calculated summaries and use advanced indexing. This structure allows for fast navigation through dimensions and measures. For example, a query to find quarterly sales across all stores is executed almost instantly, as the data cube already holds these pre-calculated aggregates. I started to mention this earlier, and it’s really one of the key points, in my opinion.
Data cubes also enable interactive data exploration through operations like slicing and dicing. Slicing lets you focus on a specific dimension, like examining sales for just one month. In contrast, dicing lets you view data across multiple dimensions simultaneously, such as sales by product category in New York during January.
For example, you can start an analysis with annual sales, drill down into quarterly performance, and then slice by region for a specific product category.
Data cubes are built to grow with your needs. They handle large datasets well, especially when paired with modern tools like cloud storage or big data platforms. You can easily bring in new data, add custom dimensions, and set up measures that match exactly what your business needs to track.
Imagine you are running a fast-growing online store. As you expand your product range, open in new regions, or add more recent data, your data cube can grow with you, without messing up the reports and insights you already rely on.
Although data cubes are helpful for analyzing your datasets, they come with different challenges. Below are some of the known issues.
Building a data cube isn’t just a technical task, but it also requires a good understanding of your business. The complexities involved may include the following:
Working with data cubes comes with some challenges, especially as your data grows. These include:
When you integrate data cubes with existing systems, you may experience the following challenges:
Data cubes are a great way to organize and make sense of complex data from different angles. They help you spot patterns faster, run queries more efficiently, and explore information by slicing it up however you need.
If you are looking to advance your skills, I recommend taking our Data Warehousing Concepts course to learn about data warehouse properties and how to integrate data cubes with existing systems, if your role requires this. Our Understanding Data Engineering course will also help you with skills in maintaining and processing data.
Learn with DataCamp
Track
Course
Course
blog
Tim Lu
13 min
blog
Amberle McKee
8 min
blog
Kevin Babitz
6 min
blog
Kurtis Pykes
13 min
blog
Patrick Brus
14 min
blog
Javier Canales Luna
14 min