Have you ever analyzed experimental data or survey results and wondered if the results you observed are just a coincidence, or if it truly reveals something important? This question lies at the very heart of statistics, and the answer is in a powerful concept called the p-value.
This beginner-friendly guide will equip you with the knowledge to confidently find p-values in Excel. We'll break down what p-value means, and explore some of the common places where a p-value shows up, such as the in output of common functions used in hypothesis testing, such as t-tests and Z-tests. We will also look at the Data Analysis ToolPak, an Excel add-on great for finding p-values. Most importantly, in the end, you'll learn how to interpret these p-values to make data-driven decisions with clarity. Ready? Let's dive in!
What is a P-Value?
To understand p-value, we’d have to understand statistical significance. Statistical significance is a measure used in data analysis to assess the likelihood that the results observed in a study are caused by a specific factor, rather than by chance. It is closely associated with the p-value, which is a statistical metric that calculates the probability of obtaining results as extreme as those observed, under the assumption that there is no real effect or difference.
P-value acts as a benchmark when checking for statistical significance. If the p-value is small, it suggests that your data are very unlikely under the null hypothesis in which case you should consider rejecting the null hypothesis in favor of an alternative that suggests a real effect or difference exists.
How to Calculate P-Values in Excel
Excel offers two main ways to find p-values. We could either use the appropriate function for the test we are conducting, or else we could use the Data Analysis Toolpak for the same end. In this section, I will pick two of the most common functions, the t-test and Z-test.
How to find p-value in Excel using functions
Let’s look at finding p-values in the function output. In this first example, we will be using the T.TEST() function in Excel. The T.TEST() function in Excel compares the means of two datasets and assesses if their difference is statistically significant. Here’s the formula to calculate it:
=T.TEST(array1, array2, tails, type)Where:
array1: The range of data for the first group.array2: The range of data for the second group.tails: Specifies whether you're performing a one-tailed (1) or two-tailed (2) test. (A two-tailed test considers both directions of the difference, while a one-tailed test focuses on a specific direction.)type: Denotes the type of t-test (1 for paired, 2 for two-sample assuming equal variances, 3 for two-sample assuming unequal variances).
For example, let us compare the click-through rates (CTR) of randomly generated advertising campaign data, campaigns A and B using the T.TEST() function to see if there's a statistically significant difference.
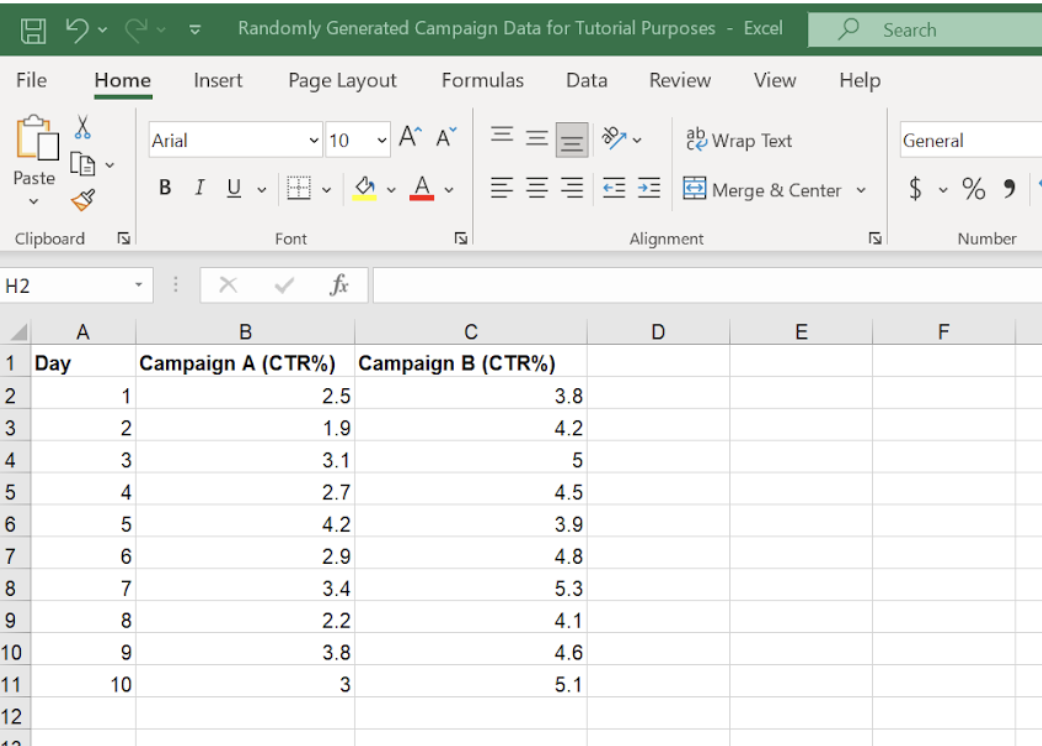
Excel sheet containing the campaign data. Image by Author
Steps:
Ensure the CTR values for Campaign A and those for Campaign B are in separate columns.
Have a blank cell where you want the p-value to be displayed.
Enter the
T.TEST()formula:=T.TEST(B2:B11, C2:C11, 2, 2)Press Enter. The cell will display the calculated p-value.
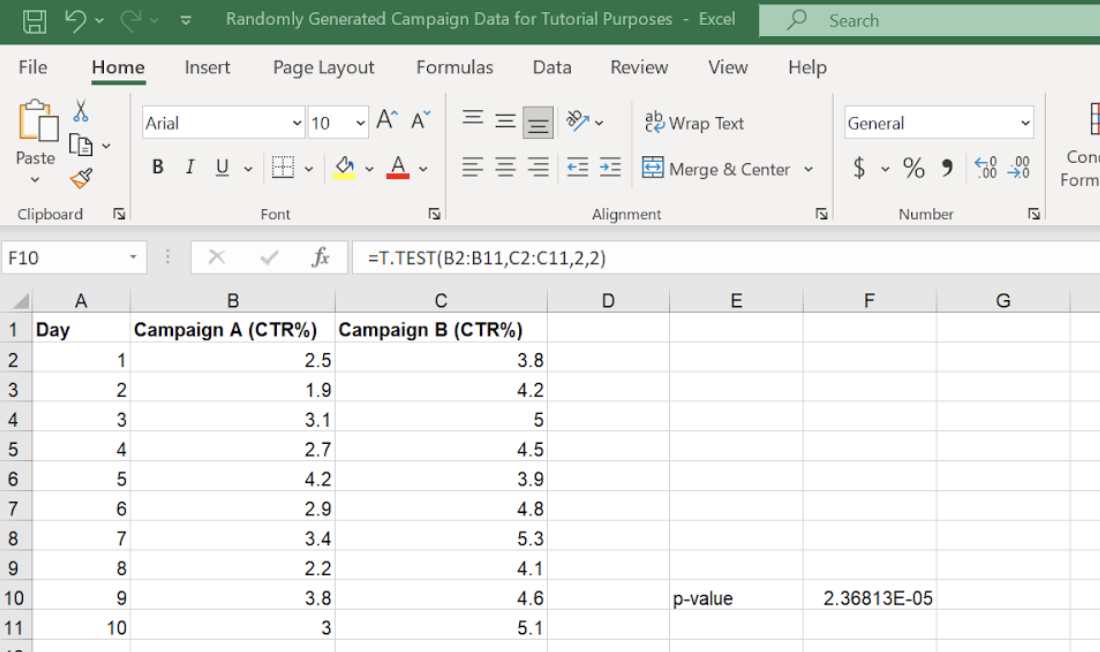
Obtaining the p-value from our t-test. Image by Author
In this example, we found the associated p-value from a t-test, a p-value of 2.36813E-05 (or 0.0000236813) indicating a very small probability that the observed results happened by chance. So, we can be confident that our results are statistically significant.
We could have found the p-value using a Z-test instead, in the event that we know the population standard deviation. P-values show up in many places, including, as further examples, in linear regression, where p-values assess the significance of model coefficients, or in ANOVA testing. Take our Introducton to Statistics course to keep learning.
How to find p-value in Excel using the Data Analysis Toolpak
The Data Analysis ToolPak is an add-in for Excel that provides various statistical functions. If not already enabled, you can activate it by following these steps:
- Go to the File tab.
- Click on Options.
- In the Options menu, select Add-Ins.
- In the dropdown menu, select Excel Add-ins and click Go.
- Check the box for Analysis ToolPak and click OK.
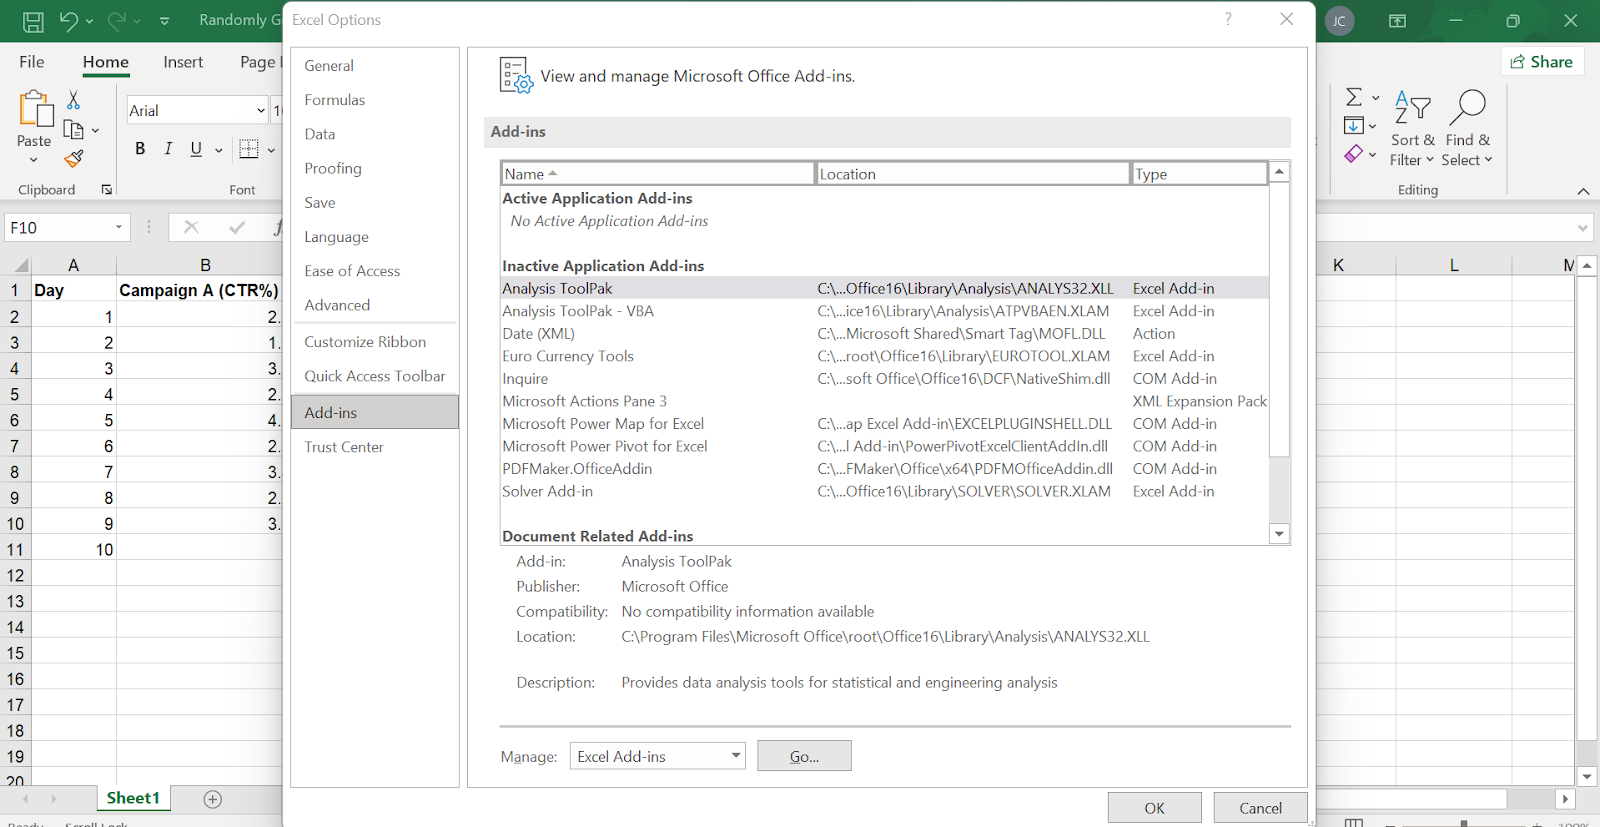
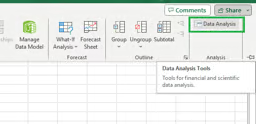
Finding the Data Analysis Toolpak in Excel. Image by Author
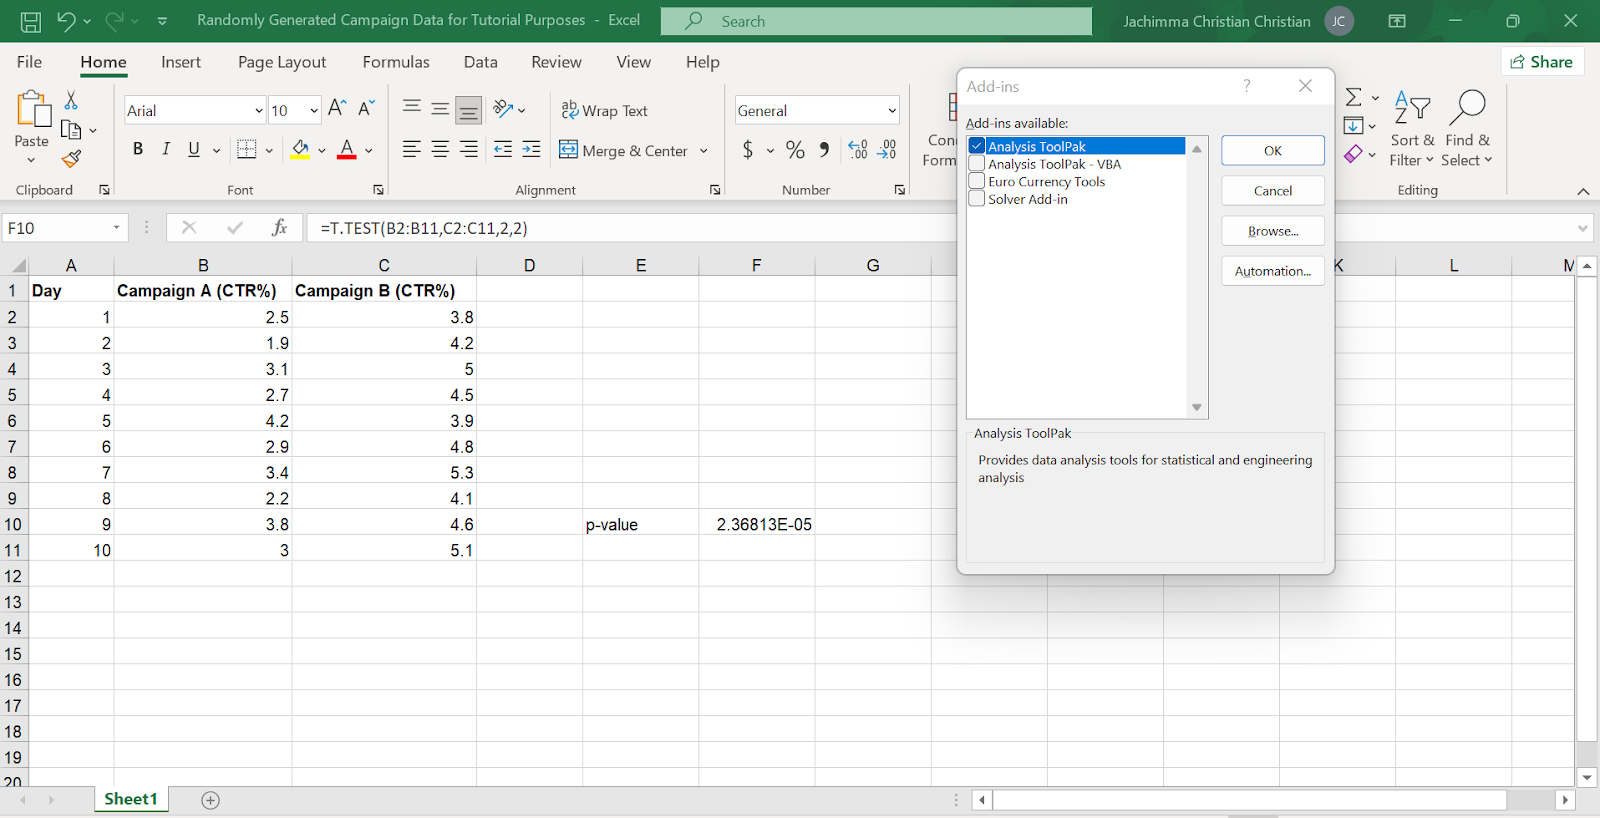
Enabling the Data Analysis Toolpak in Excel. Image by Author
Once enabled, we can use the ToolPak to perform something like a t-test and obtain the p-value. Lets now compare the click-through rates (CTR) of our advertising campaigns A and B using the Data Analysis Toolpak. We expect the same result but it doesn't hurt to practice.
Steps:
Ensure the CTR values for Campaign A are in one column and those for Campaign B are in another column.
Click on the Data tab in the Excel ribbon.
Locate the Analysis section within the Data tab.
Click the Data Analysis button. A pop-up window will appear.
In the Data Analysis window, scroll down the list of analysis tools and select t-Test: Two-Sample Assuming Equal Variances. This specific test is suitable for comparing the means of two independent groups, assuming their variances are similar.
Click OK.
A new pop-up window titled "t-Test: Two-Sample Assuming Equal Variances" will appear. Here, you'll define the parameters for the test.
Variable 1 Range: In this field, enter the cell range containing the CTR values for Campaign A. For example, if our data is in Column B, we would type
B2:B11.Variable 2 Range: Enter the cell range containing the CTR values for Campaign B. In our example, if our data is in column C, you would type
C2:C11.Labels: If the first row of your data table contains column headers, check the box next to Labels.
Click OK.
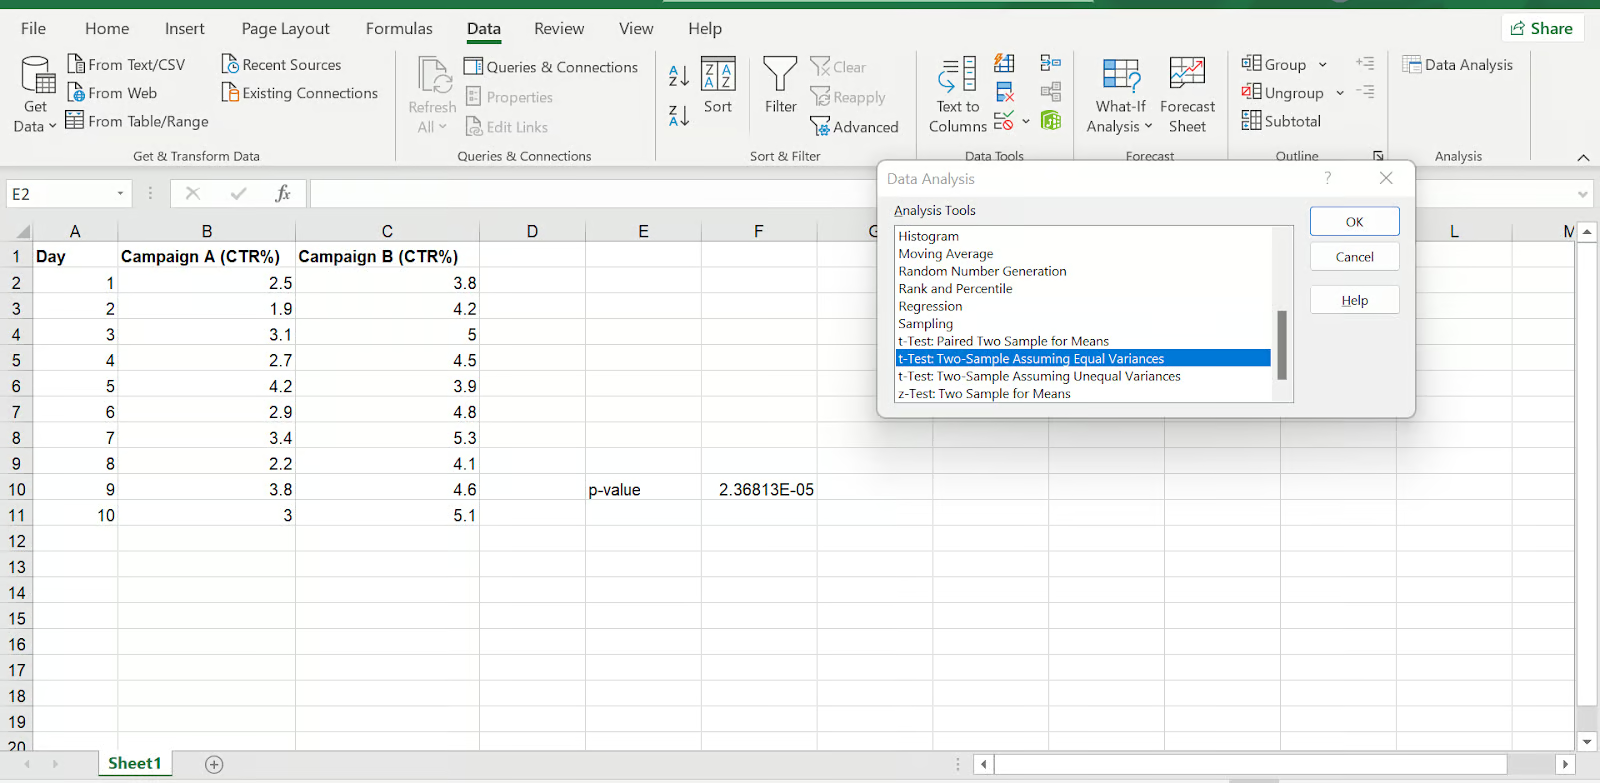 Use the Data Analysis Toolpak to obtain a p-value in Excel. Image by Author
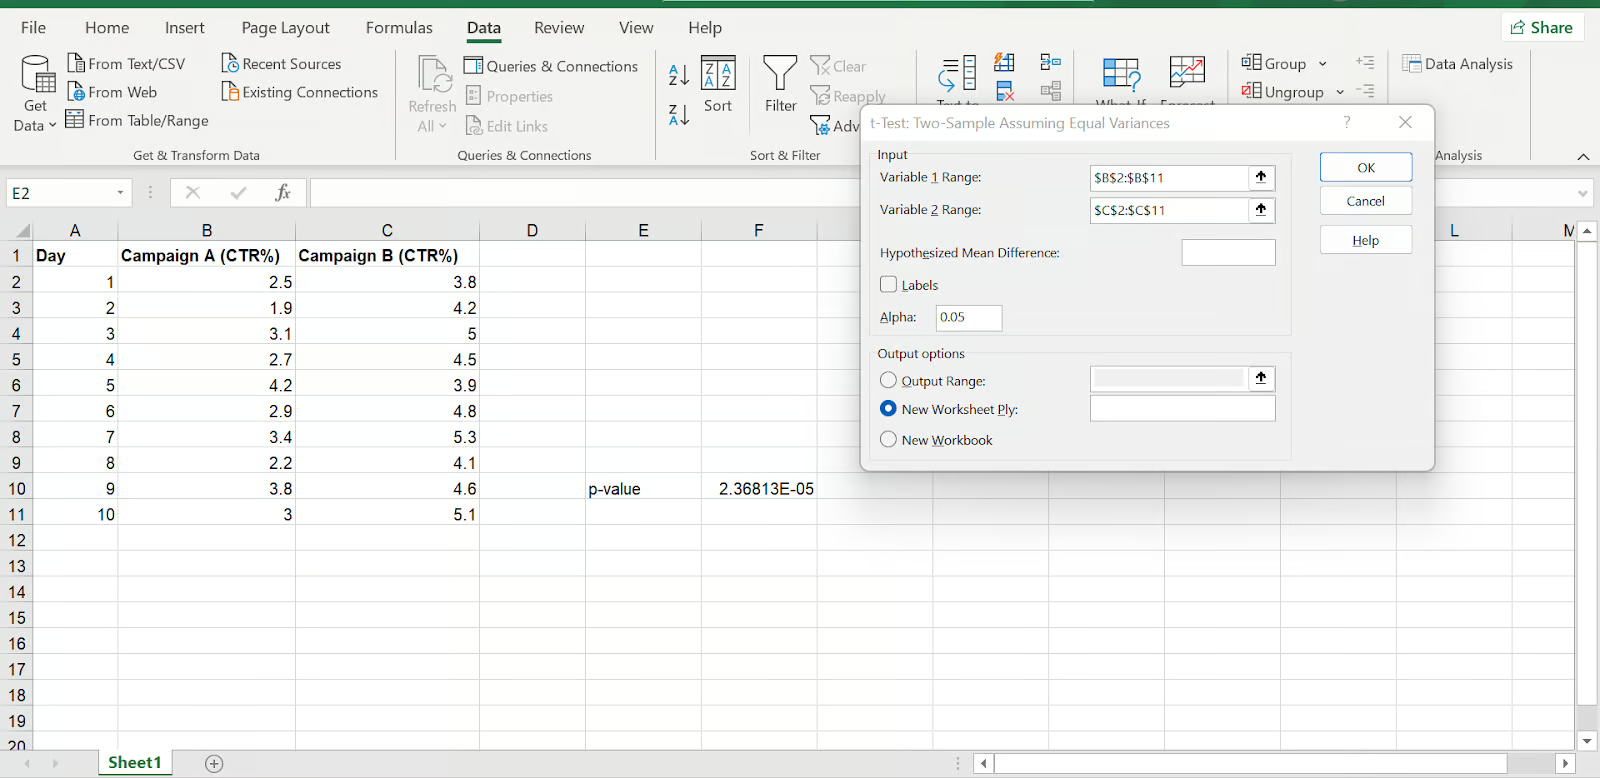
Perform t-tests and obtaining the p-value in Excel. Step 7-10. Image by Author
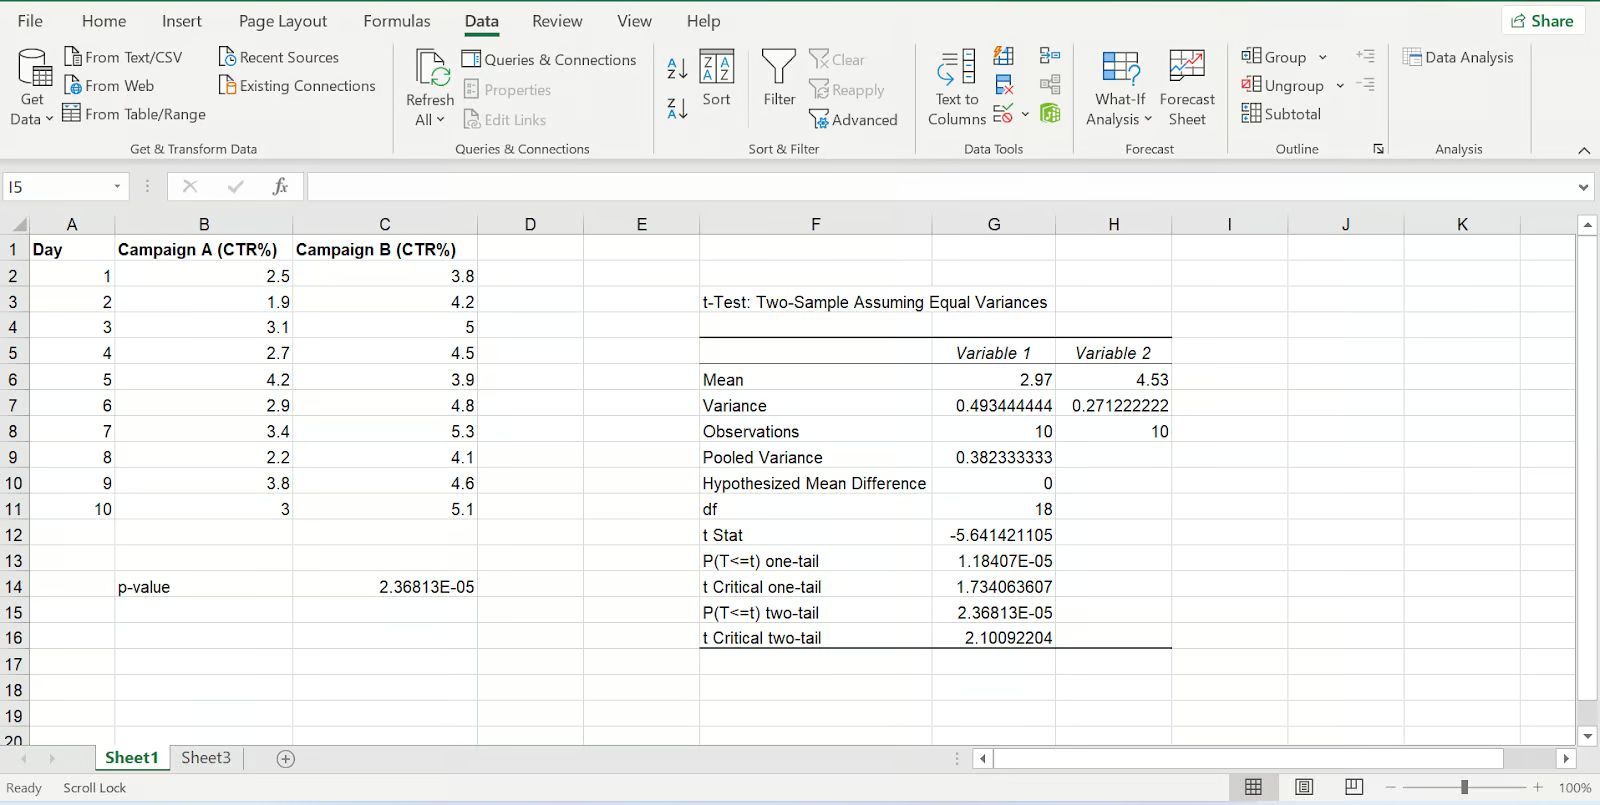
Image showing results of the t-test using the Data Analysis Toolpak. Image by Author
How to find p-value in Excel manually
As a final option, we could calculate a p-value manually. Here, let’s do a Z-test without using the Z.TEST() function. Instead, we will use other functions: STANDARDIZE() and NORMSDIST().
Standardize the test statistic
First, we use the STANDARDIZE() function to calculate the z-score, which represents how many standard deviations our sample mean deviates from the hypothesized population mean.
=STANDARDIZE(x, mean, standard_dev)Where:
xis the sample meanmeanis the population meanstandard_devis the population standard deviation
Calculate the p-value
Next, we use the NORMSDIST() function to find the probability of observing a z-score as extreme as the one you calculated or more extreme (depending on your test, one-tailed or two-tailed).
=NORMSDIST(z-score)Note: When using a manual approach, you may need to consider other things. In this case, we need to think about if we are performing a one-tailed or two-tailed test and adjust the NORMSDIST() function accordingly. For a one-tailed test, we would use the NORMSDIST() function directly with your z-score. For a two-tailed test, we would double the result of the NORMSDIST() function for our z-score, because we’re considering both tails of the distribution.
How to Interpret P-Values in Excel
To interprete p-values we must first understand significance level (α). The significance level, denoted as alpha (α), is a threshold that defines how strong your evidence must be to reject the null hypothesis. Commonly, α is set at 0.05.
Interpreting Results:
- p-value ≤ alpha:When the p-value is less than or equal to alpha, reject the null hypothesis. This suggests a statistically significant difference or effect exists between the compared groups or variables.
- p-value > alpha:When the p-value is greater than alpha, fail to reject the null hypothesis. There's not enough evidence to conclude a significant difference or effect, indicating a need for more data for a more conclusive analysis.
Important Considerations
Finally, let’s consider some important aspects.
Assumptions
Both t-tests and z-tests assume that our data follows a normal distribution. For t-tests, it’s also assumed that variances are equal if we’re conducting a two-sample test.
One-tailed vs. two-tailed tests
In a one-tailed test, we have a prior expectation about the direction of the difference (e.g., We would expect Group A to have higher values than Group B). The one-tailed test looks for an effect in one direction. For the two-tailed test, we are interested in a difference in either direction (higher or lower in Group A compared to Group B). As the name implies, the two-tailed test looks in both directions.
The choice of a one-tailed or two-tailed test affects how we interpret the p-value. A one-tailed test has a stricter threshold for significance compared to a two-tailed test for the same p-value.
Limitations of Excel
We need to know that while Excel offers valuable tools for basic statistical analysis, it has limitations for complex analyses. Specialized statistical software might be necessary for more advanced calculations or when dealing with non-standard data distributions.
Conclusion
By understanding p-values and their role in hypothesis testing, We can make more informed decisions based on our data using Excel. To learn more about Excel and its wealth of capabilities, check out DataCamp’s Introduction to Excel, Excel Fundamentals, and Data Analysis in Excel.
Also, check out these DataCamp resources to deepen your knowledge of statistical concepts for data analysis:
As a final note, in this article, we showed how to find p-values using two of the most common tests: t-tests and Z-tests; but if you still feel unsure about the difference, we have a more comprehensive tutorial for you: T-test vs. Z-test: When to Use Each.
See you in the next one!
Advance Your Career with Excel
Gain the skills to maximize Excel—no experience required.
Data analyst and analytics mentor specializing in Excel, SQL, and Python. Focusing on actionable insights, I empower businesses of all sizes to drive meaningful change while inspiring new data learners on their journeys.
Frequently Asked Questions
Is there a difference between p-value and significance level (alpha)?
Yes, there is a key difference. The p-value is the probability of obtaining a result (or a more extreme outcome) as extreme as the one observed in the data, assuming the null hypothesis is true (that is there's no real effect). The significance level (alpha) is a predefined threshold we set (usually 0.05) to decide if we reject the null hypothesis. If the p-value is less than alpha, we reject the null hypothesis and consider the results significant.
My data isn't perfectly normal. Can I still use the methods in this article?
The t-test and Z-test both assume your data is normally distributed. If your data deviates significantly from a normal distribution, the results might be less reliable. Consider using specialized statistical software for robust analysis.
When should I use a one-tailed vs. two-tailed test?
Use a one-tailed test if you have a strong prior expectation about the direction of the difference (e.g., Group A performs better than Group B). A two-tailed test is used when you're interested in a difference in either direction (higher or lower). The choice of test affects how you interpret the p-value.
Are there any limitations to using Excel for p-value calculations?
Yes, Excel is great for basic statistical analysis like t-tests, but it has limitations for complex analyses. For very large datasets, specialized statistical software might offer better performance and handle more complex statistical models.
What other resources can I use to learn more about p-values and statistics?
DataCamp offers various resources like Introduction to Statistics, Probability and Statistics and Statistics fundamentals with Python. Courses that will help deepen your understanding.
