Course
Introduction to Statistics
4 hr
150.8K
Understanding skewness can help identify potential outliers or anomalies in the data, which could indicate data quality issues or areas that require further investigation. Skewness also provides insights into the asymmetry of the data, which impacts the choice of statistical methods and downstream models. Thus, understanding the skewness of the underlying data is crucial in analytics projects.
In this tutorial, we will learn the concept of skewness, its mathematical definitions, and the different types of skewness in data distributions. Using a simple real-world example, we will calculate skewness using Microsoft Excel and interpret the results. If, at the end of this tutorial, you are looking to expand your skills further, consider exploring our Data Analysis in Excel course.
To calculate skewness in Excel, use either the SKEW() function or the SKEW.P() function.
Follow these steps:
=SKEW(range) or =SKEW.P(range), where range is the range of your data cells.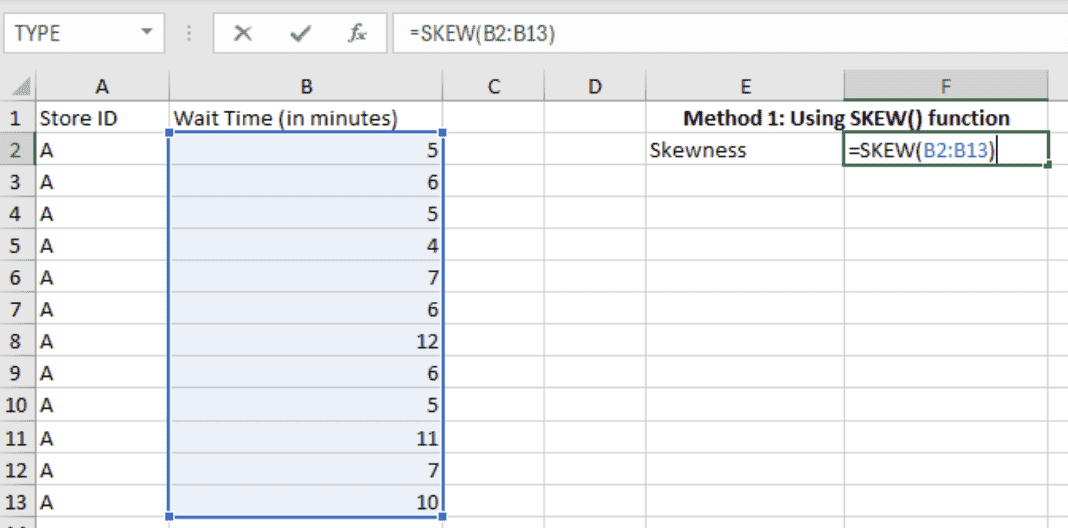
Calculating skewness using the SKEW() function. Image by Author
The SKEW() function assumes that the data provided represents a sample from a population. It divides by n−1 where n is the number of data points. This is known as Bessel's correction.
The SKEW.P() function calculates the skewness of an entire population. It divides by n, not n-1.
Skewness is a statistical metric that measures the asymmetry of a distribution. It indicates whether the data points tend to fall more to one side of the mean than the other.
The four moments of a distribution are:
Depending on whether the skewness coefficient is positive, negative, or zero, there are three types of skewness.
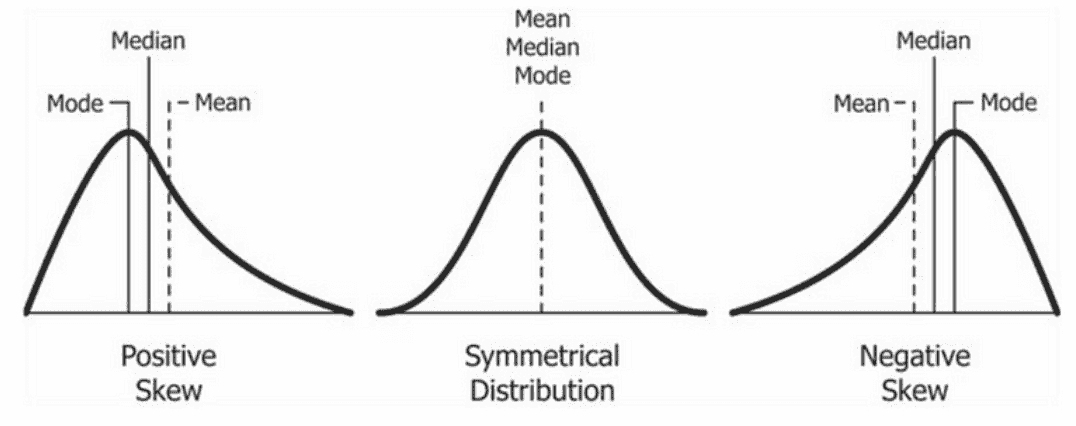
Skewed distributions. Source: Wikipedia
While skewness focuses on the spread (tails) of the distribution, another statistical metric, kurtosis, focuses more on the height. It tells us how peaked or flat our normal (or normal-like) distribution is. Together, they highlight both the asymmetry and the extremity of deviations in the dataset. Our separate tutorial, Understanding Skewness And Kurtosis And How to Plot Them, explains why these metrics are used together to provide a complete picture of data distribution.
Now that we’ve understood the concept of skewness and its various types, let’s calculate it for sample data using Excel.
Gain the skills to maximize Excel—no experience required.
Imagine you’re a data analyst tasked to analyze customer wait times at a popular retail chain. The company is experiencing varied customer satisfaction levels across its stores, and management suspects long wait times at checkout might be a contributing factor.
To address this, they have sampled data on customer wait times from a store over a few days.
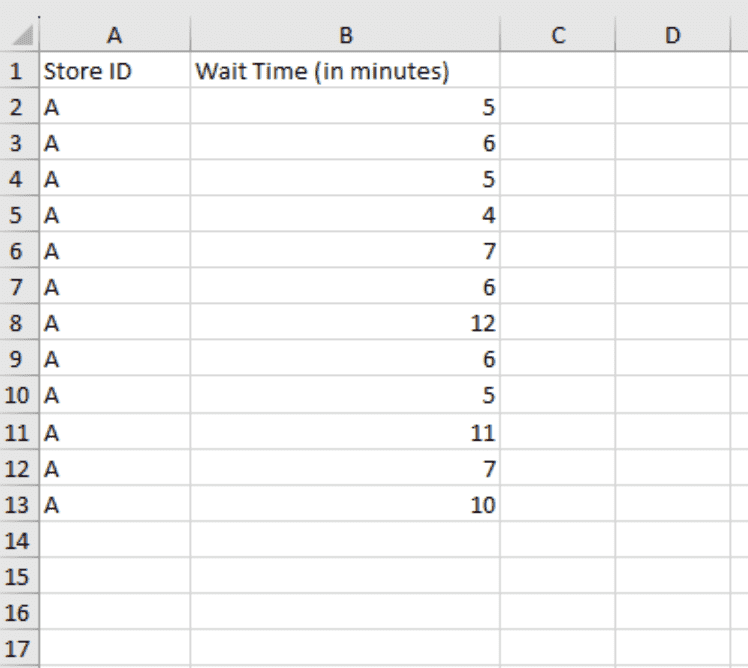
Customer wait time dataset. Image by Author
As part of analyzing customer wait times, you’ve realized that calculating the skewness metric will provide useful insights. Here are two methods you could utilize to calculate the skewness metric using Microsoft Excel.
The function computes the degree of skewness of a sample. Here is the syntax of the SKEW() function:
SKEW(number1, [number2], ...)For the SKEW() function, we can include up to 255 parameters, each of which can be a single data point or an array of data points.
For our data in hand, we would enter the following formula in a cell, say F2:
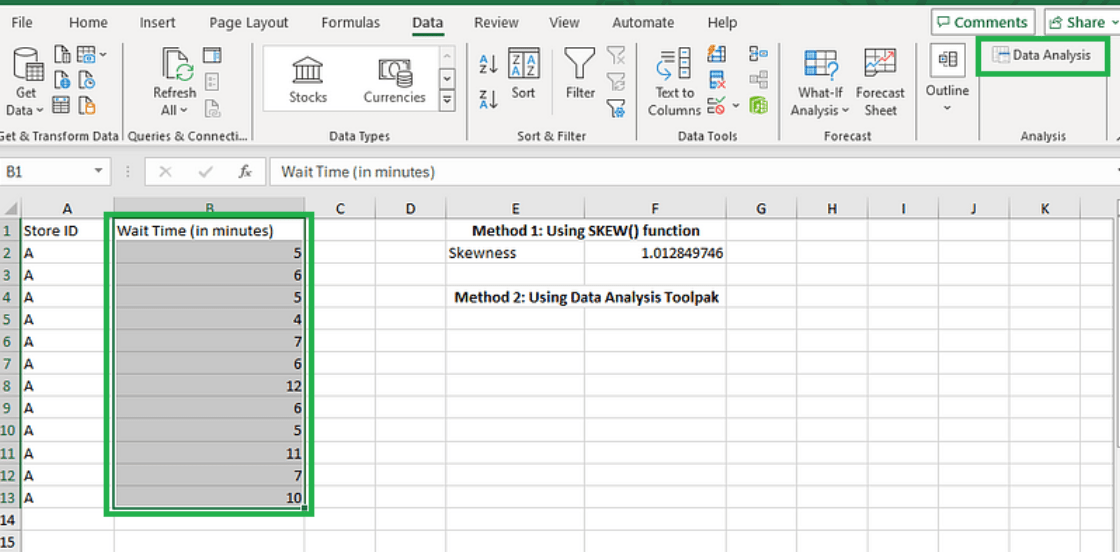
=SKEW(B2:B13)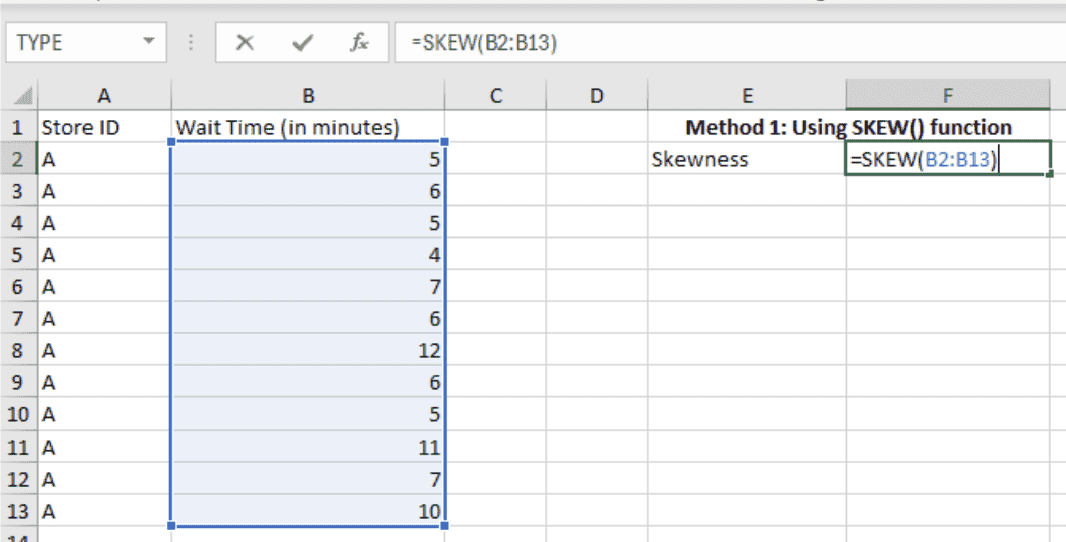
Calculating the skewness using the SKEW() function. Image by Author
Next, once we press Enter on the cell, we can see the skewness coefficient calculated:
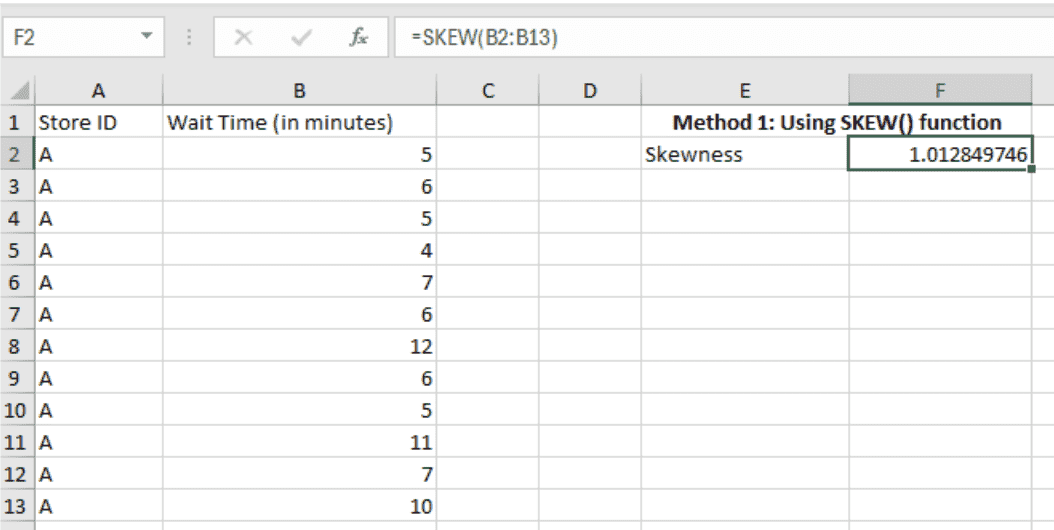 Skewness result. Image by Author
The positive output indicates that the wait times are right-skewed. Before interpreting the value, let’s explore another method to find the skewness metric.
The Data Analysis Toolpak is an additional add-in for Microsoft Excel that helps calculate metrics commonly used in data analytics tasks.
Since this add-in isn’t enabled by default, you must check the top right of your Excel workbook for the Data Analysis icon under the Data tab, as shown below.
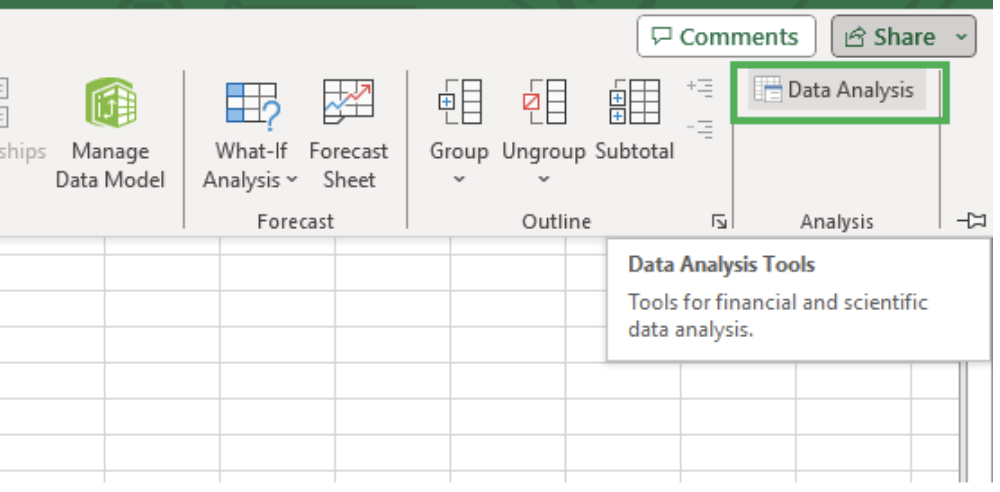
Data Analysis ToolPak in Excel. Image by Author
If you don’t see the icon, it hasn't been enabled. To enable it, click on File from the menu and select Options.

Selecting Options from the File Tab. Image by Author
Select Add-ins when the Excel Options dialog box opens.
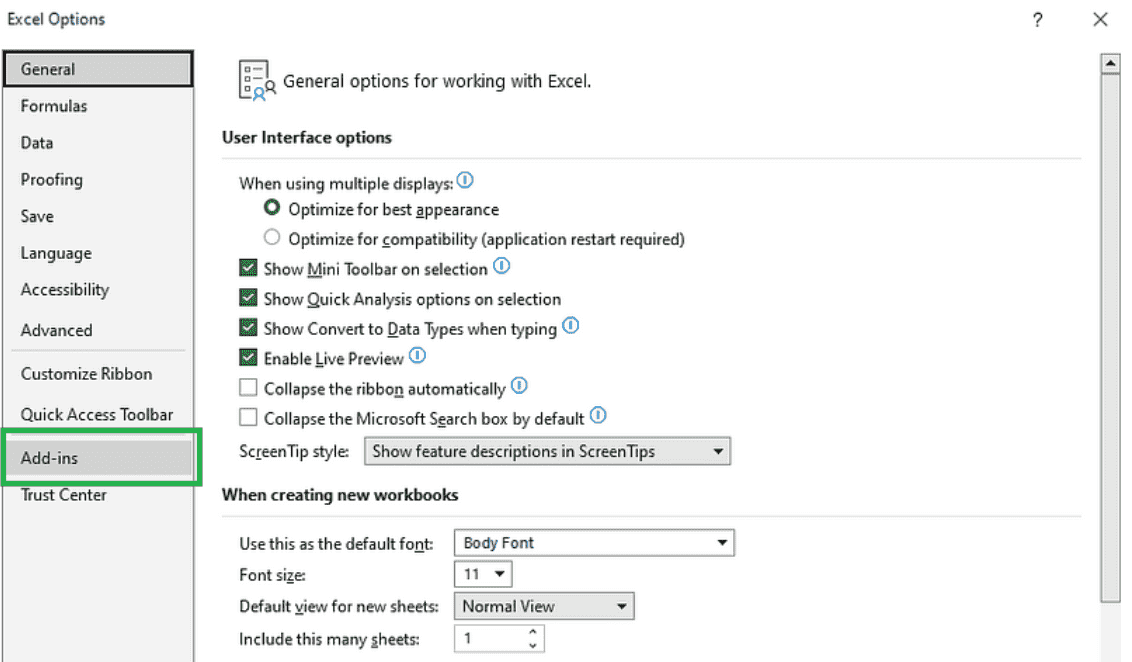
Select Add-ins from the Excel Options dialog box. Image by Author
Next, select Excel Add-ins in the Manage box at the bottom, and click Go.
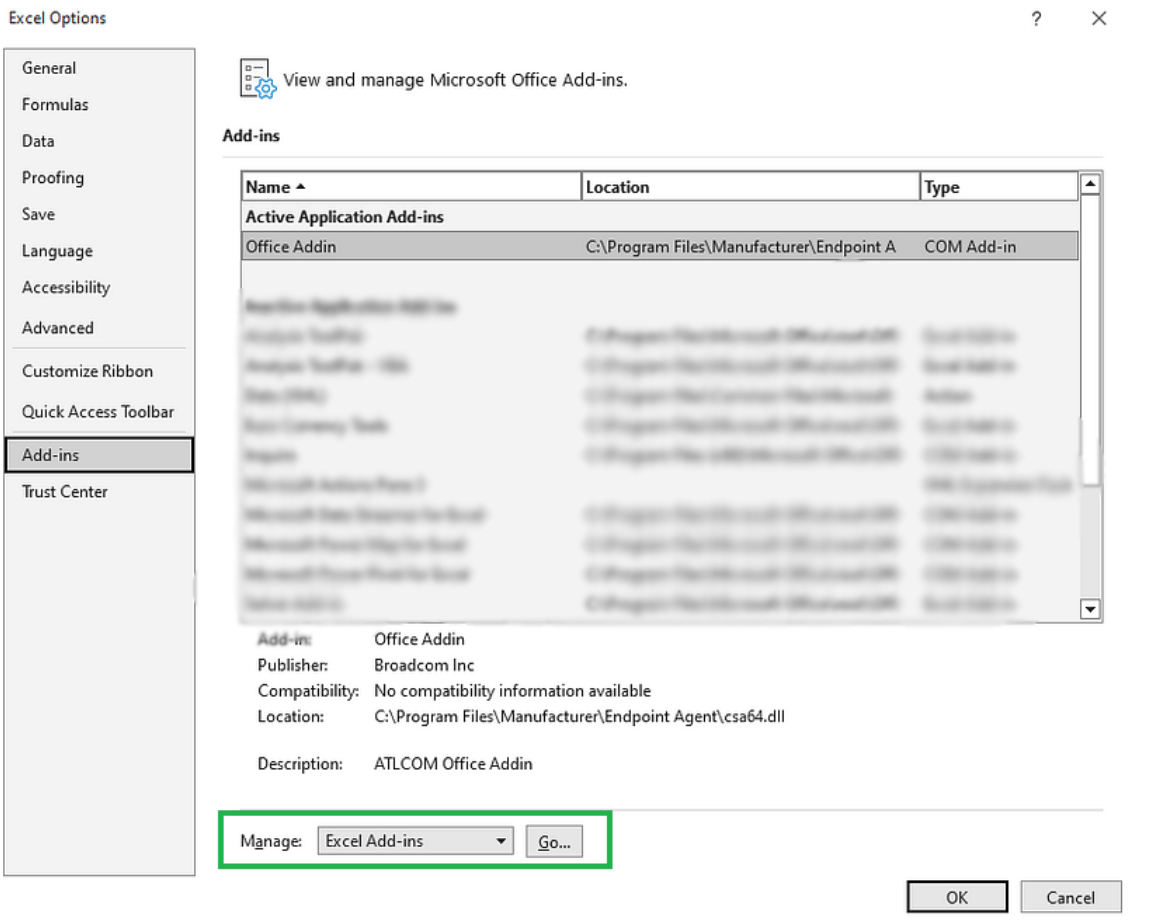 Managing Excel add-ins. Image by Author
Check Analysis ToolPak once the Add-Ins dialog box opens and click OK.
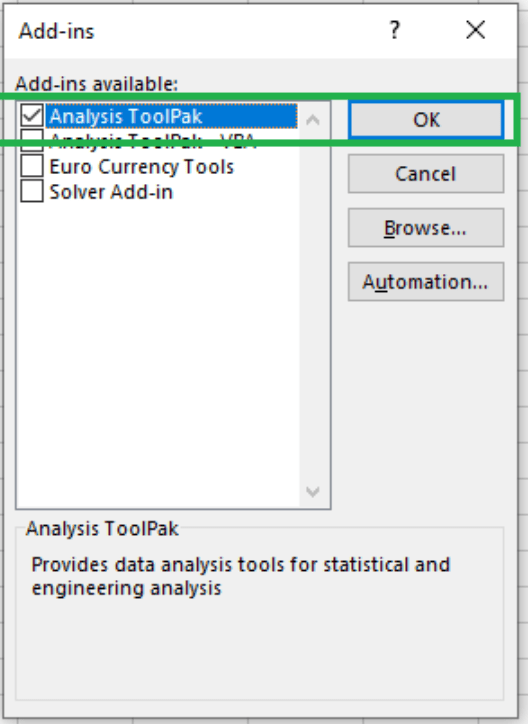
Enabling Data Analysis ToolPak. Image by Author
The Data Analysis icon will be visible under the Data tab now, and you need not repeat this process, as enabling the add-in is a one-time task.
As the first step towards calculating the skewness using the enabled add-in, select the range of data points, including the column header, and click on the Data Analysis icon, as shown below.
Invoking the Data Analysis Toolpak add-in. Image by Author
Next, select Descriptive Statistics from the dialog box and click OK.
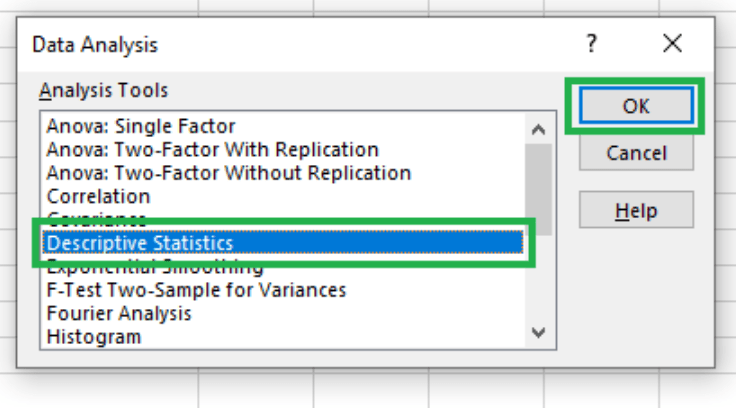
Selecting descriptive statistics. Image by Author
You will be prompted with a dialog box, as shown below.
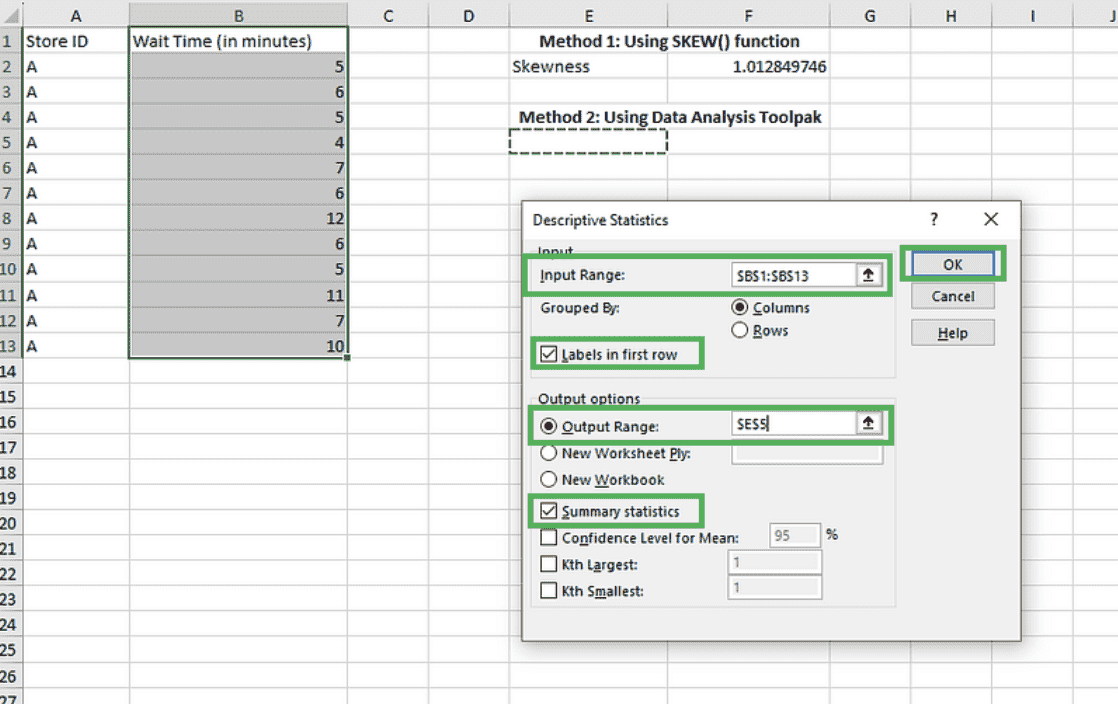 Filling in details for descriptive statistics. Image by Author
The Input Range has been prefilled since we selected it before invoking the add-in. Check the Labels in the first row box, and for the Output Range, we select a cell in the same sheet, say $E$5. Check the Summary statistics box, which includes the skewness metric.
Click OK to see the calculated results in the same Excel sheet.
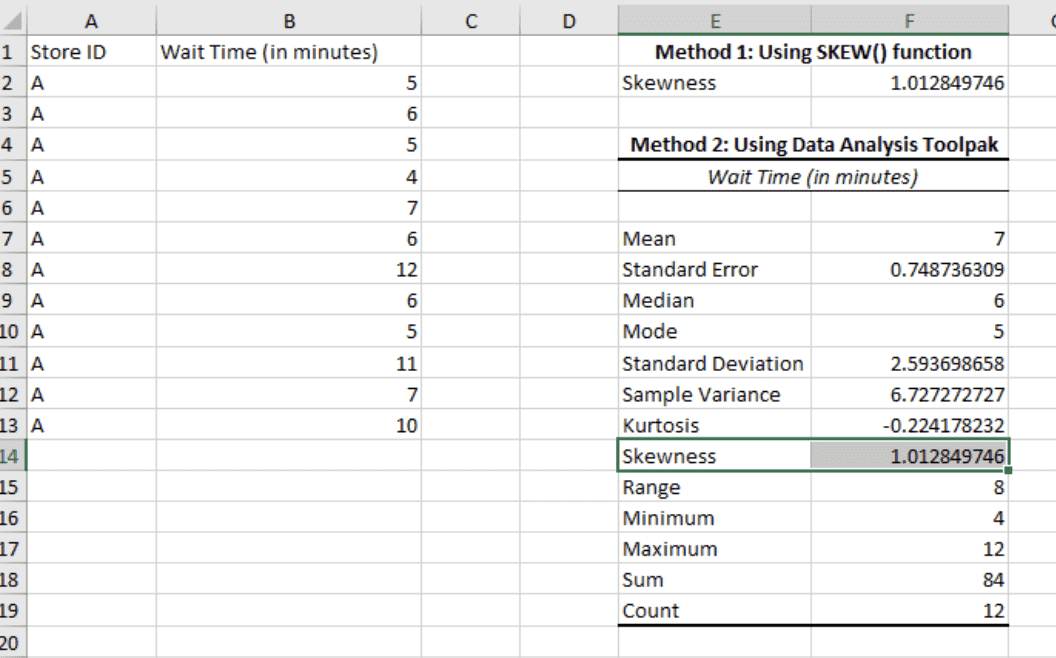 Descriptive statistics results. Image by Author
That’s it! You’ve calculated the skewness and other useful descriptive statistics in one go.
If you are interested in learning more about the Data Analysis Toolpak, check out our Comprehensive Guide to Using ANOVA in Excel tutorial for another useful example.
Now that we have the skewness and other descriptive statistics, we can interpret and uncover some useful insights about the sample of data.
Suppose the obtained skewness coefficient is negative — how would your interpretation change? Here’s how we can interpret negative skewness values for customer wait times.
Keep in mind that Calculating other descriptive statistics that complement the skewness metrics helps us reinforce our findings. This is a common practice in data analytics.
In most practical applications, particularly those involving general statistical analysis or software tools like Excel, the momental skewness is commonly used due to its robustness and comprehensive nature. It is often the default choice unless specific characteristics of the dataset or analysis goals suggest otherwise.
Momental skewness, also known as the third standardized moment, is a statistical measure used to quantify the asymmetry of a data distribution around its mean.
The theoretical definition calculates this by dividing the third central moment of the distribution, which captures the degree of deviation from the mean cubed, by the cube of the standard deviation. However, when analyzing a sample from a larger population, particularly in practical data analysis scenarios, the derived formula for sample skewness is:
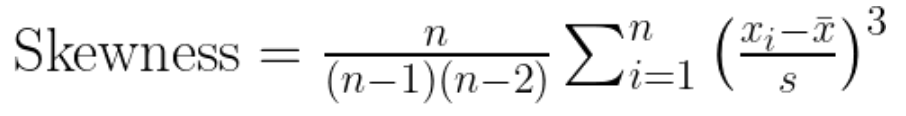
Momental skewness equation. Image by Author
Where:
Pearson’s measures of skewness include two coefficients, using mode and median.
Let's take a look at Pearson’s first coefficient of skewness (mode skewness). It compares the mode to the mean and normalizes this difference using the standard deviation. The formula is given as:
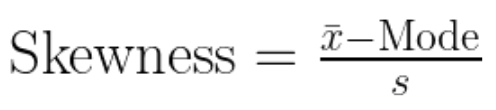 Mode skewness equation. Image by Author
Where:
This version of skewness is least used due to the difficulty in accurately determining the mode in many datasets.
Now let's take a look at Pearson’s second coefficient of skewness (median skewness). It quantifies the asymmetry of a distribution by comparing its median to the mean and scaling the result by the standard deviation. The formula is given as:
 Median skewness equation. Image by Author
Where:
Since this measure uses the median, it is less affected by outliers, providing a more robust skewness indicator.
Kelly’s measure of skewness is based on the data's percentiles. It measures the asymmetry of the distribution based on how the median is positioned between the 10th and 90th percentiles.
The formula for Kelly’s skewness is given by:
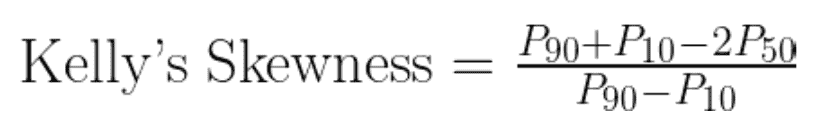 Kelly’s skewness equation. Image by Author
Where:
Kelly’s measure focuses on the tails of the distribution and is useful for understanding the skewness in datasets where extreme values are of particular interest.
Bowley’s skewness, also known as the quartile skewness coefficient, is a way to measure the skewness of a distribution based on quartiles. The formula for Bowley’s skewness is given by:
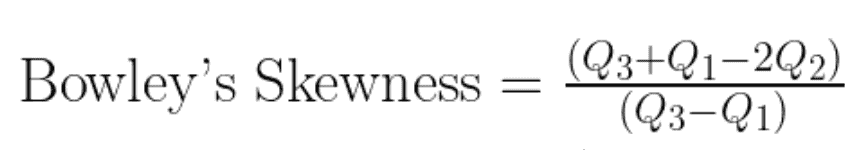
Bowley’s skewness equation. Image by Author
Where:
This measure is less sensitive to extreme values and provides a robust measure of skewness based on the interquartile range.
This tutorial introduced you to multiple definitions and the concept of skewness in data distributions. Using a simple example, we learned multiple methods to calculate skewness in Excel and interpreted the results.
Your learning doesn’t have to stop here. The beginner-friendly Introductions to Statistics course comprehensively covers commonly used statistical techniques and metrics in data analytics. The Excel Fundamentals track would be excellent for learning more about similar analytical tasks using Excel, and the Excel Formulas Cheat Sheet is also helpful for quick reference.
Happy learning!
Gain the skills to maximize Excel—no experience required.
Learn Excel and Statistics with DataCamp
Course
Course
Course
Tutorial
Bex Tuychiev
Tutorial
Arunn Thevapalan
Tutorial
Arunn Thevapalan
Tutorial
Arunn Thevapalan
Tutorial
Laiba Siddiqui
Tutorial
Elena Kosourova