
Course
Databricks Concepts
4 hr
22K
Databricks serves as a unified analytics platform, enabling the integration of data engineering, machine learning, and business analytics. At the core of this ecosystem are Databricks Notebooks, interactive workspaces designed for data exploration, model development, and production workflows.
In this article, I will show you how to get started with Databrick Notebooks. If you are totally new, you might want to start by enrolling in our Introduction to Databricks course so you can understand the ins and outs of Databricks and how it modernizes data architecture. Our course is very thorough and it teaches about many things, including catalog management and data ingestion, so give it a try.
Databricks Notebooks are interactive, cloud-based workspaces that enable users to perform data exploration, engineering, machine learning, and analytics in a collaborative environment. They use a cell-based execution model, where users can write and run code in discrete blocks or cells.
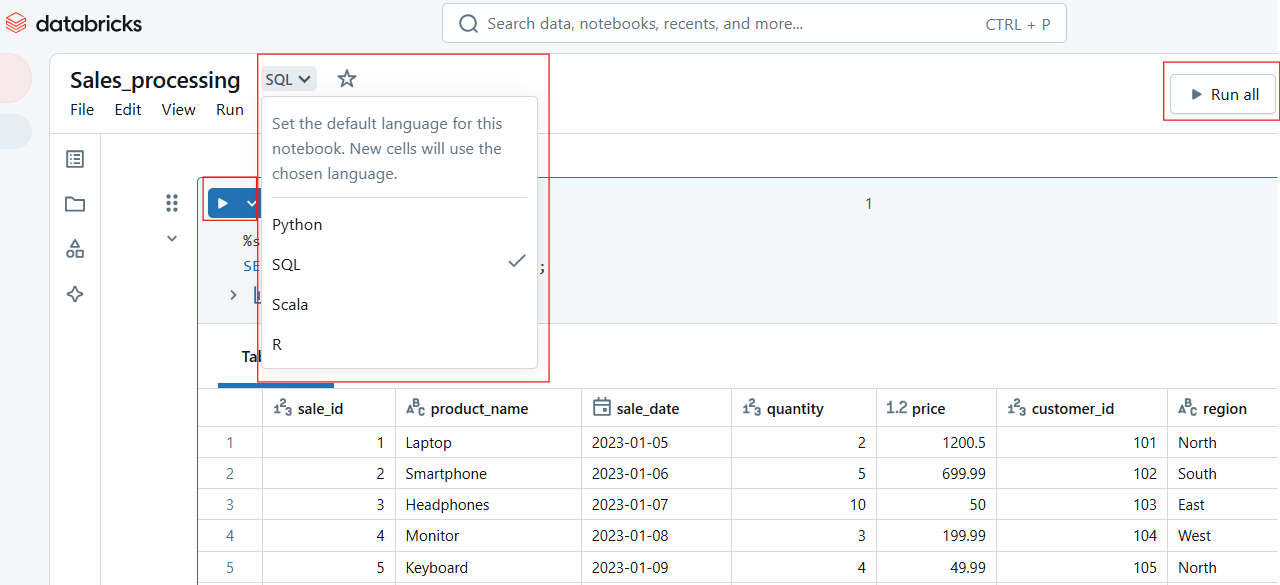
Databricks Notebooks has multi-language support, so you can not only pick your favorite language but also switch between languages within the same notebook. The languages include Python, SQL, Scala, and R, all of which we offer introductory courses for.
Now, to facilitate multi-language interoperability, Databricks provides what are known as magic commands:
%python: Runs a cell using Python.
%sql: Executes SQL queries.
%scala: Processes Scala-based commands.
%r: Executes R code.
Databricks Notebooks go beyond traditional coding environments by offering the following key capabilities:
It's one thing to read about the features, but it's another thing to see it for yourself. The best way to appreciate Databricks is to start doing things for yourself. So, in this section, I will help you get started creating, managing, and navigating notebooks in the Databricks workspace. Then, I'm sure you will start to see for yourself how useful it is.
In the Databricks workspace, you can create new notebooks or manage existing notebooks. Let us look at these methods below.
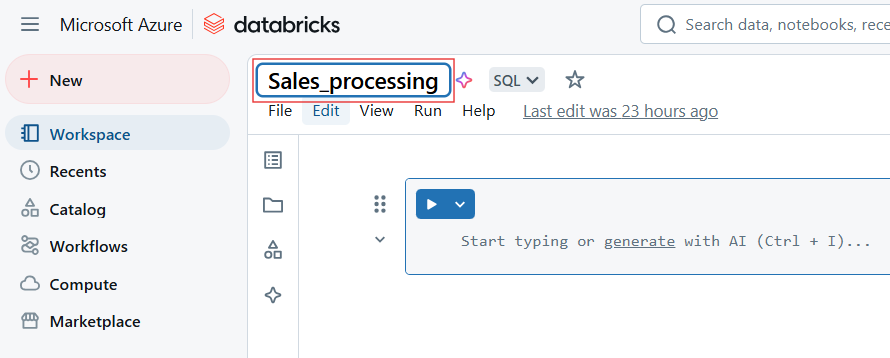
To create a new notebook in Databricks:
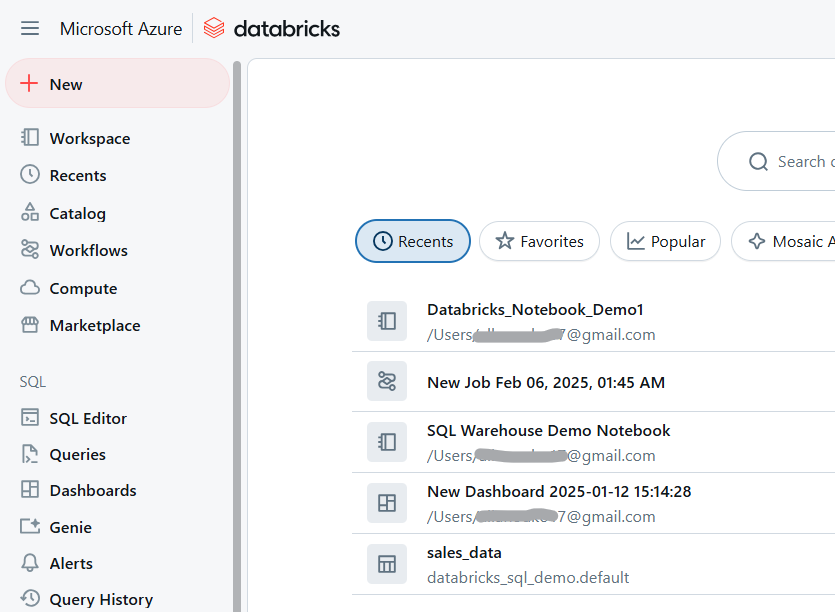
Databricks Workspace. Image by Author.
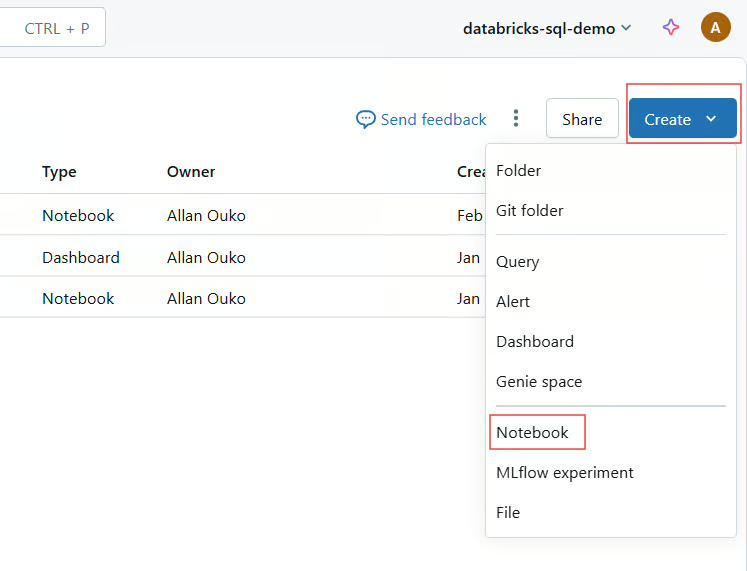
Create Databricks Notebook. Image by Author.
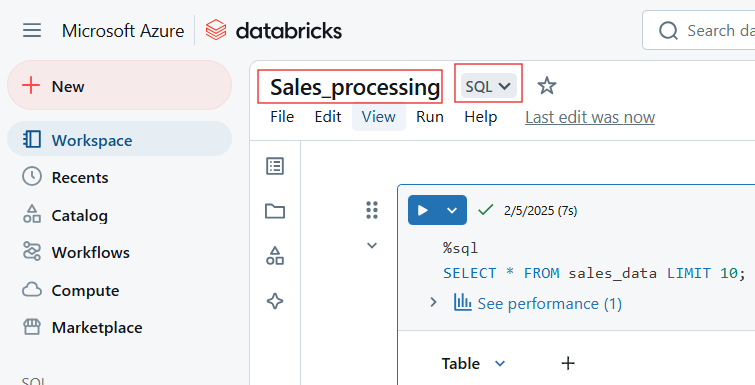
Select the name and default language for Databricks Notebook. Image by Author.
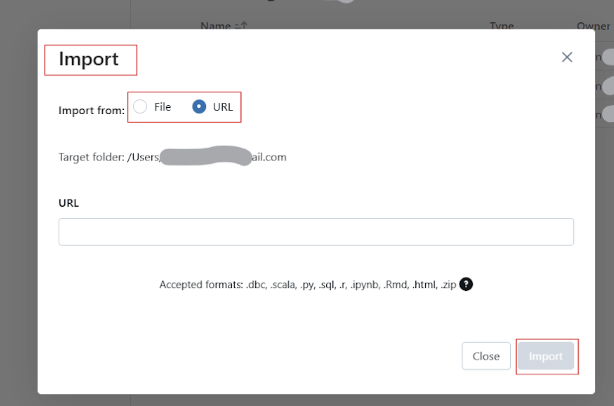
Databricks allows users to import notebooks from multiple sources, such as GitHub and Git Repositories, external URLs, or local files uploaded as .dbc (Databricks archive) or .ipynb (Jupyter) files.
Follow the following steps to import existing notebooks to Databricks Workspace:
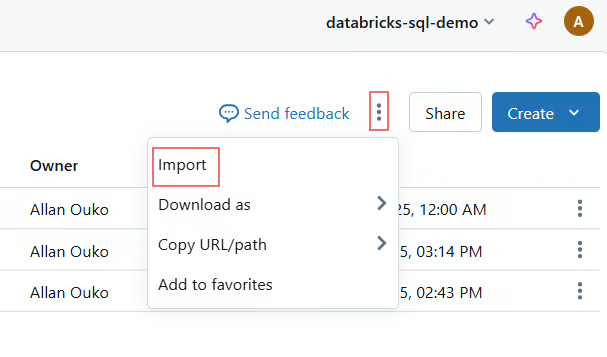
Import existing notebook to Databricks Workspace. Image by Author.
To rename Databricks Notebook, Click the notebook title and edit the name.
You can also move notebooks into folders for better structuring.
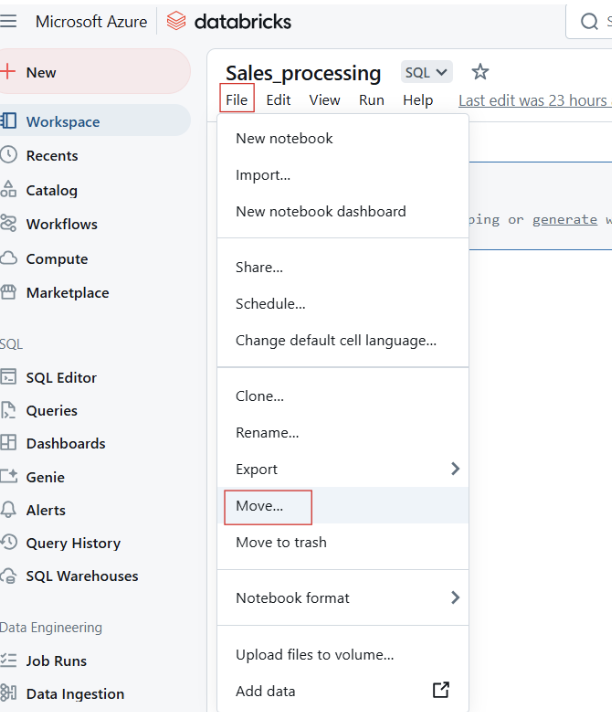
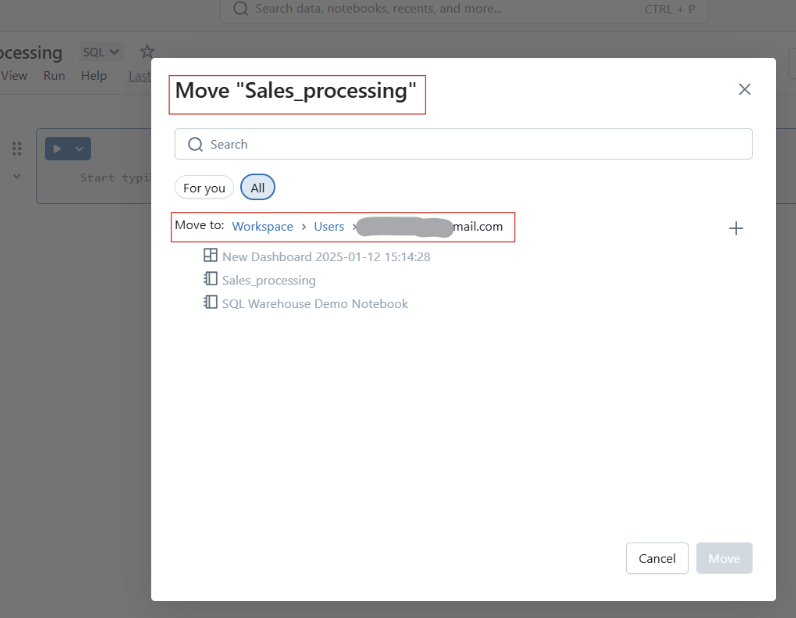
Moving Databricks Notebooks to folder. Image by Author.
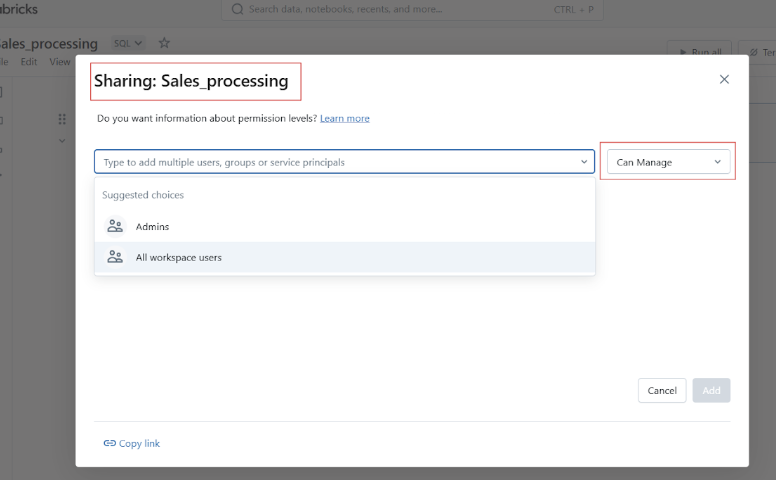
Before you share your Datbricks Notebook, you can manage access and permissions to control who can view, edit, or manage the notebook.
Before we proceed to hands-on examples of using Databricks Notebooks, let me walk you through the platform's UI and navigation.
The Databricks Notebook toolbar provides quick access to the following actions:
Running, editing, deleting, or moving the cell.
Changing cell types such as code, markdown, SQL, or Scala.
Setting magic commands like %python or %sql.
Running a cell in Databricks Notebook. Image by Author.
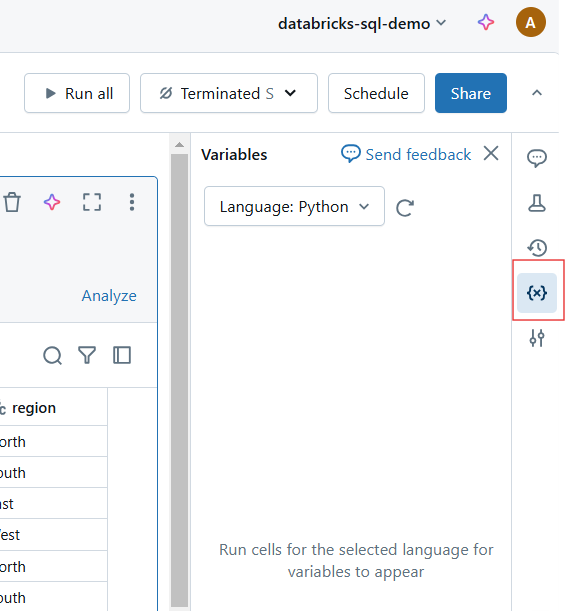
Reset variables and execution state in Databricks Notebook. Image by Author.
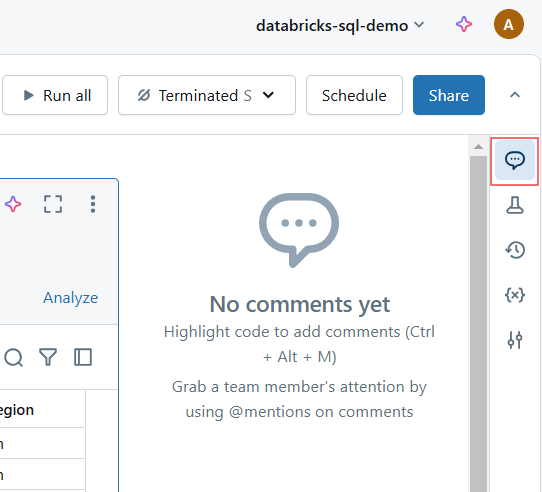
Comments in Databricks Notebook. Image by Author.
Version history in Databricks Notebook. Image by Author.
Databricks has introduced several UI improvements for a more intuitive experience. With these enhancements, Databricks Notebooks offer an even more streamlined and powerful development environment for data professionals. They include the following:
Databricks Notebooks provide an interactive coding environment where users can write, execute, and document their code. In this section, I will cover working with code cells, Markdown, and running code efficiently.
Databricks Notebooks support multiple languages, including Python, SQL, Scala, and R, within the same notebook.
Use the magic command %python to write Python code in a cell within Databricks Notebook.
%python
import pandas as pd
# Load sample data and display the first few rows
df = spark.read.format("csv").option("header", "true").load("/databricks-datasets/airlines/part-00000")
pd_df = df.limit(5).toPandas()  # Convert to Pandas DataFrame
display(pd_df)  # Works in Databricks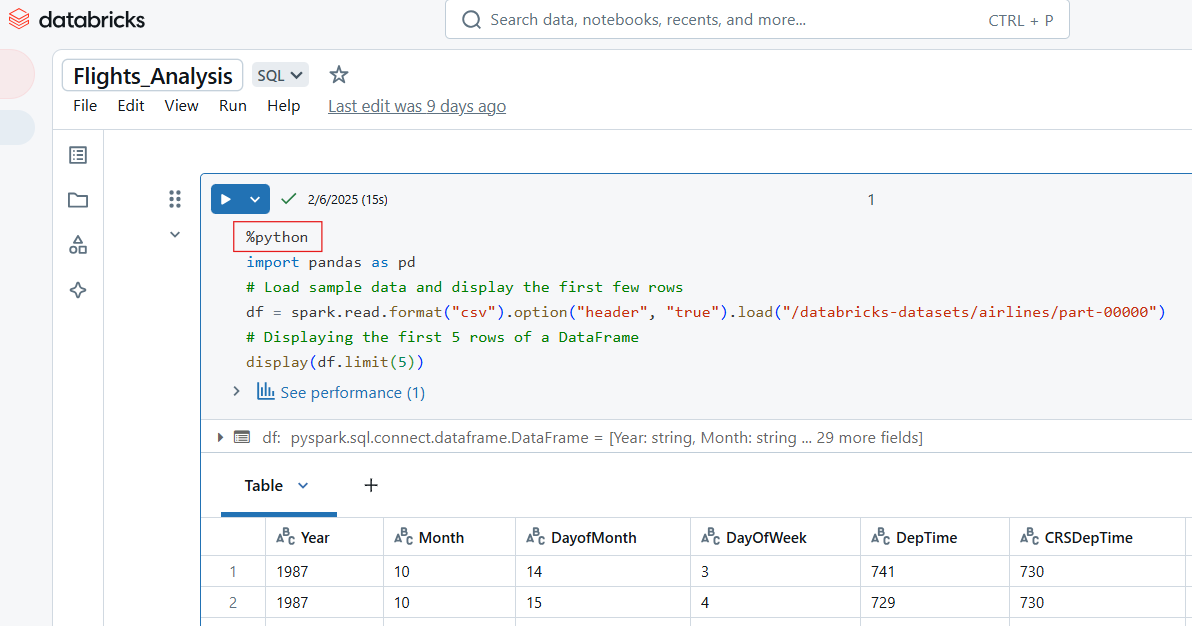
Example of Python code in Databricks Notebook. Image by Author.
To write SQL code in Databricks Notebook, use the magic command %sql. If you have set SQL as the notebook’s default language, you can run the cell without including the %sql magic command.
-- Querying a dataset in SQL
SELECT origin, dest, COUNT(*) AS flight_count
FROM flights_table
GROUP BY origin, dest
ORDER BY flight_count DESC
LIMIT 10;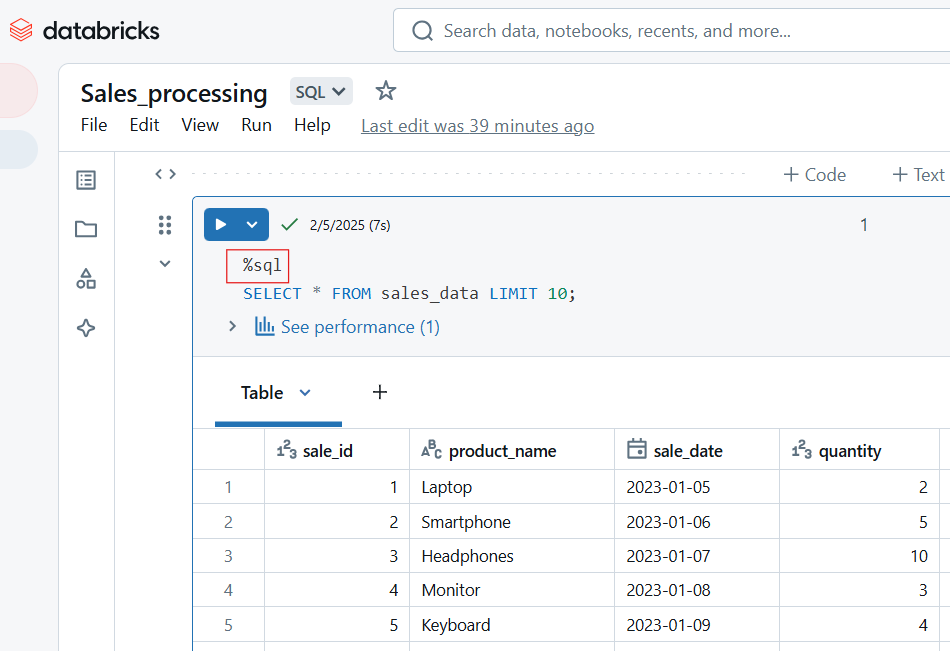
SQL code in Databricks Notebook. Image by Author.
Use the magic command %scala to write Scala code in a cell within Databricks Notebook.
%scala
// Reading and displaying data in Scala
val data = spark.read.option("header", "true").csv("/databricks-datasets/airlines/part-00000")

// Display as a table in Databricks
display(data)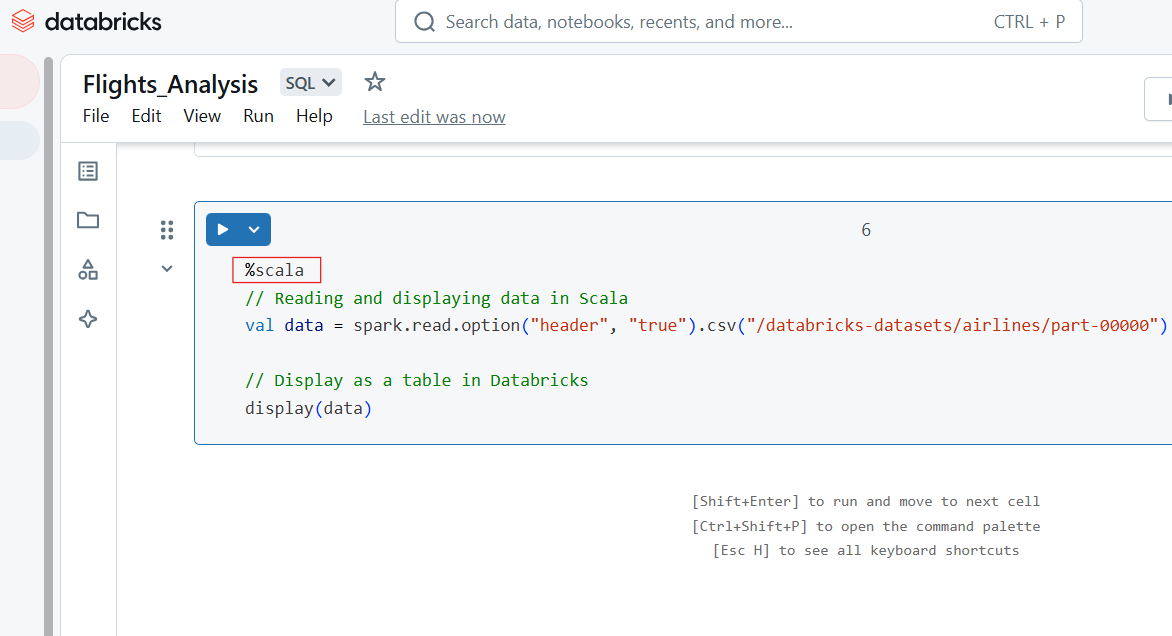
Scala code in Databricks Notebook. Image by Author.
You can also write R code in the Databricks Notebook cell using the %r magic command.
%r
# Load a sample dataset in R
library(SparkR)
df <- read.df("/databricks-datasets/airlines/part-00000", source = "csv", header = "true")
head(df)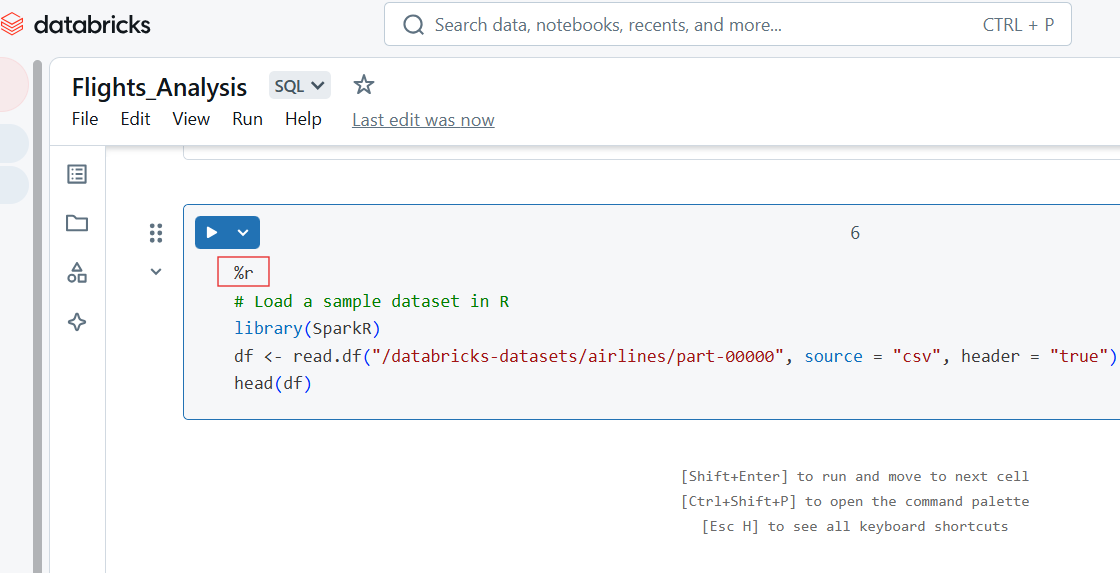
R code in Databricks Notebook. Image by Author.
Markdown cells are used for adding text, headings, lists, and other documentation. The following example shows how to write a Markdown cell and how the results are displayed in Databricks Notebook.
%md
# Data Exploration Notebook
This notebook explores airline flight data, providing insights into flight frequency and destinations.

## **Steps:**
1. Load and display the dataset
2. Query data using SQL
3. Generate visualizations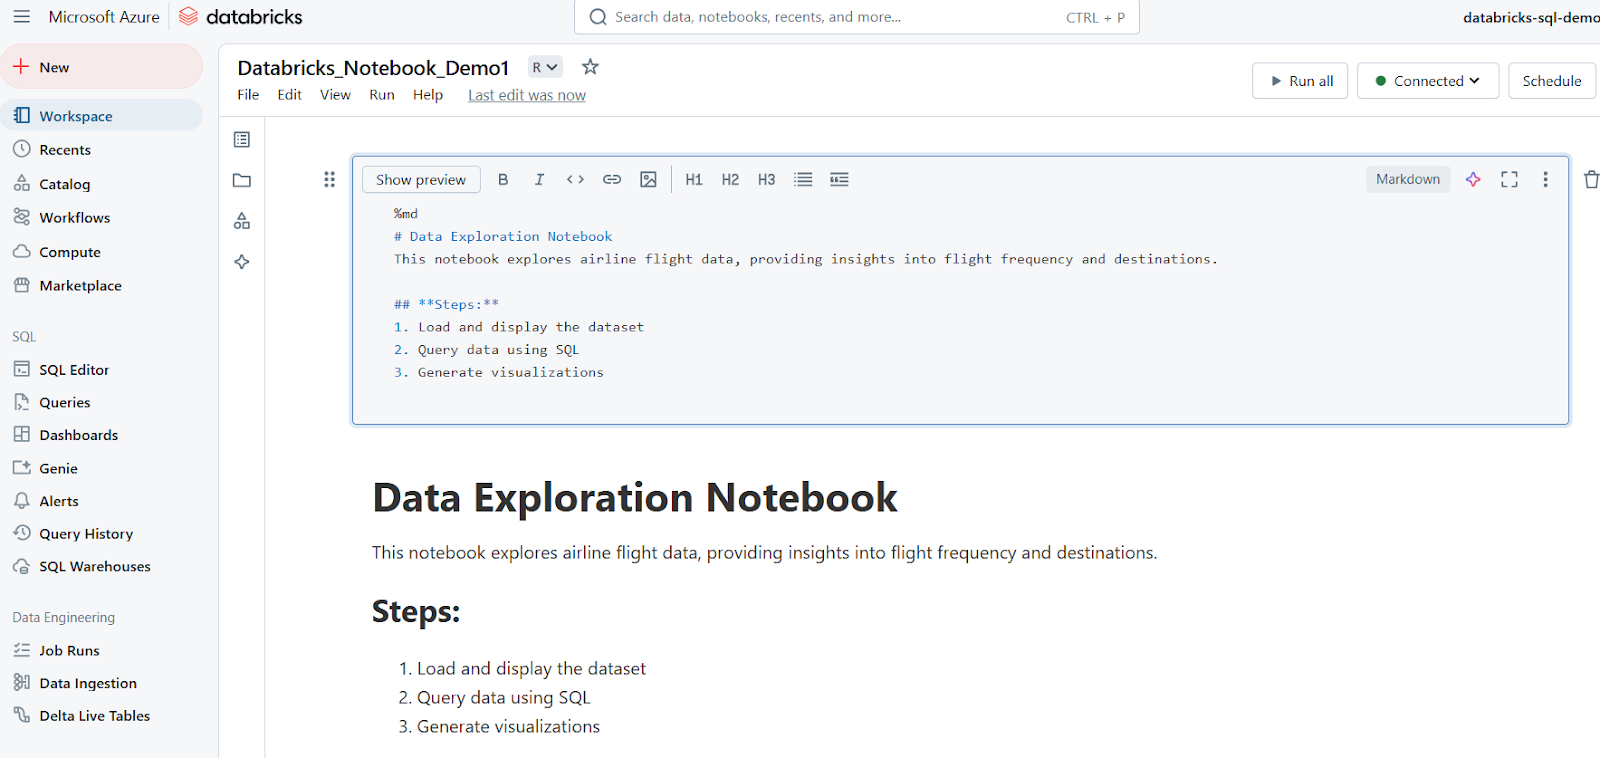
Databricks Notebooks allow flexible execution of code through individual or batch cell runs.
To run a single cell, click the Run button (▶) in the cell or use the keyboard shortcut:
To execute all cells in the notebook:
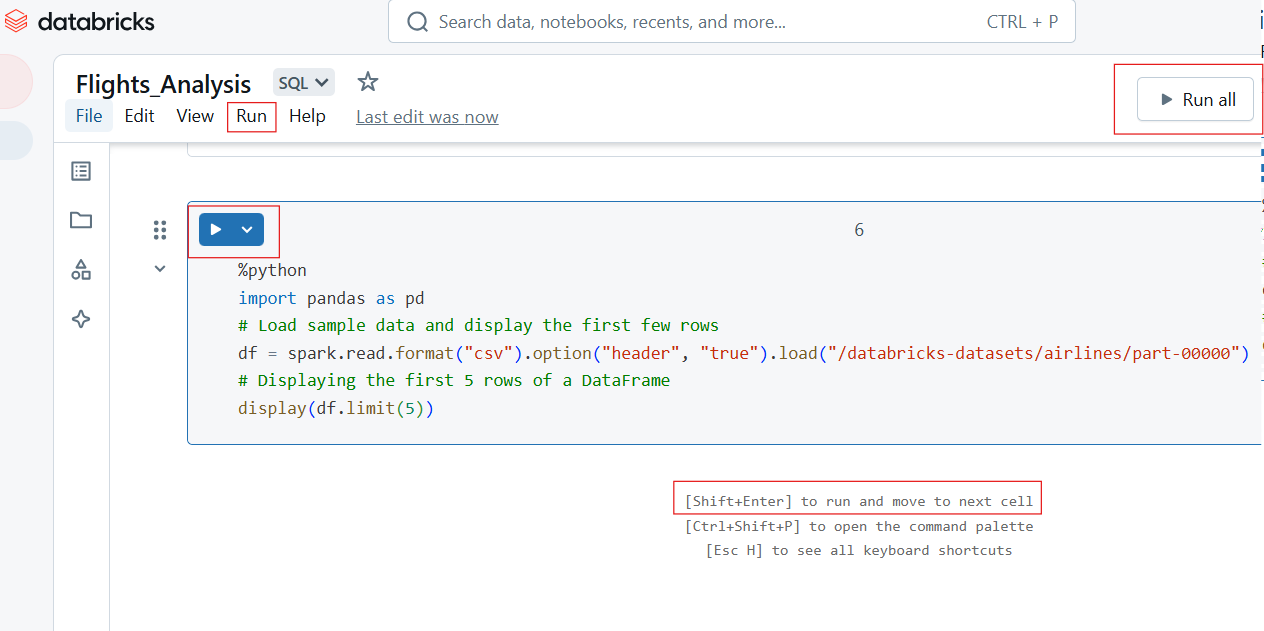
Executing individual and running all cells in Databricks Notebook. Image by Author.
Databricks Notebooks support multiple output formats, including tables, charts, and logs. For example, the following Python code displays the first 5 rows of the ‘airlines’ dataset.
%python
import pandas as pd
# Load sample data and display the first few rows
df = spark.read.format("csv").option("header", "true").load("/databricks-datasets/airlines/part-00000")
# Displaying the first 5 rows of a DataFrame
display(df.limit(5))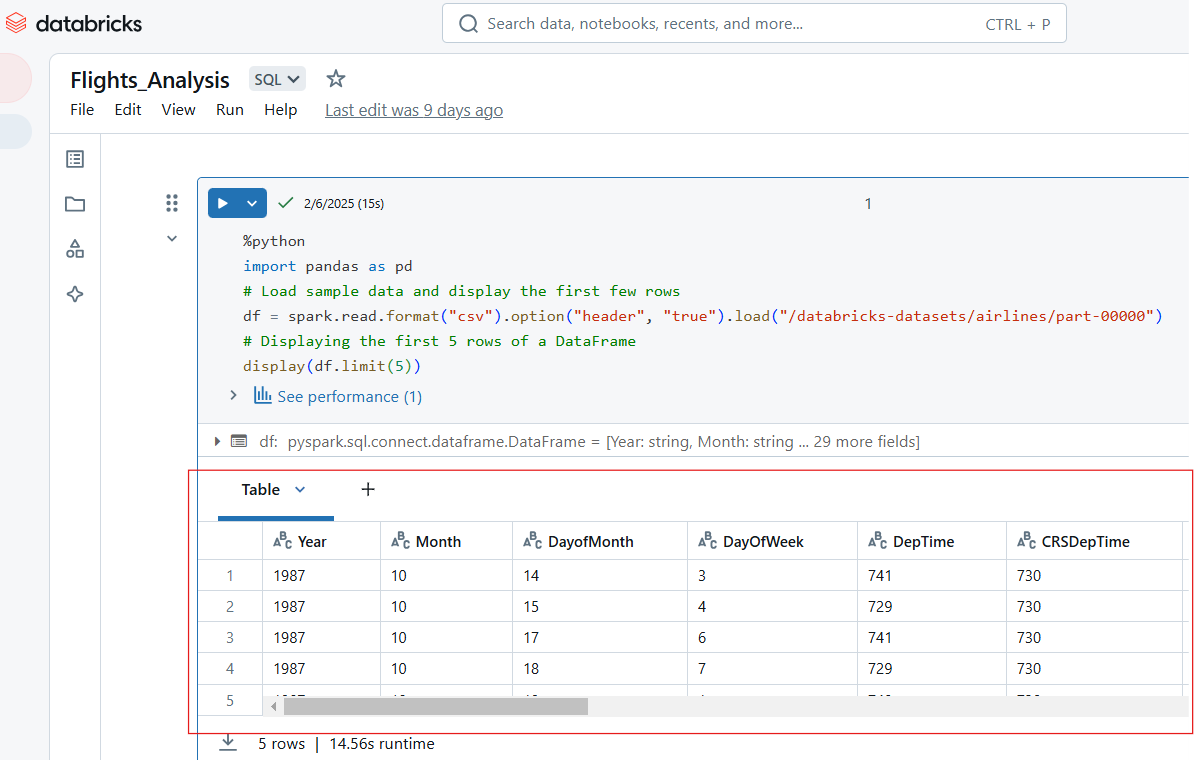
View inputs in Databricks Notebook. Image by Author.
We can also use Databricks Notebooks to visualize the cells' output. For example, the Python code below selects the top 10 most frequent airline carriers, converts the data from PySpark to Pandas, and then uses Matplotlib to create a bar chart.
%python
# Import necessary libraries
import matplotlib.pyplot as plt
import pandas as pd

# Load the dataset using PySpark
df = spark.read.option("header", "true").csv("/databricks-datasets/airlines/part-00000")

# Select the top 10 most frequent airlines (carrier column)
top_airlines = df.groupBy("UniqueCarrier").count().orderBy("count", ascending=False).limit(10)

# Convert PySpark DataFrame to Pandas DataFrame
pd_df = top_airlines.toPandas()

# Convert count column to integer (since it's a string in CSV)
pd_df["count"] = pd_df["count"].astype(int)

# Plot a bar chart
plt.figure(figsize=(10, 6))
plt.bar(pd_df["UniqueCarrier"], pd_df["count"], color="#ac4ce4")

# Add titles and labels
plt.xlabel("Airline Carrier", fontsize=12)
plt.ylabel("Flight Count", fontsize=12)
plt.title("Top 10 Most Frequent Airline Carriers", fontsize=14)
plt.xticks(rotation=45)  # Rotate x-axis labels for better readability

# Show the plot
plt.show()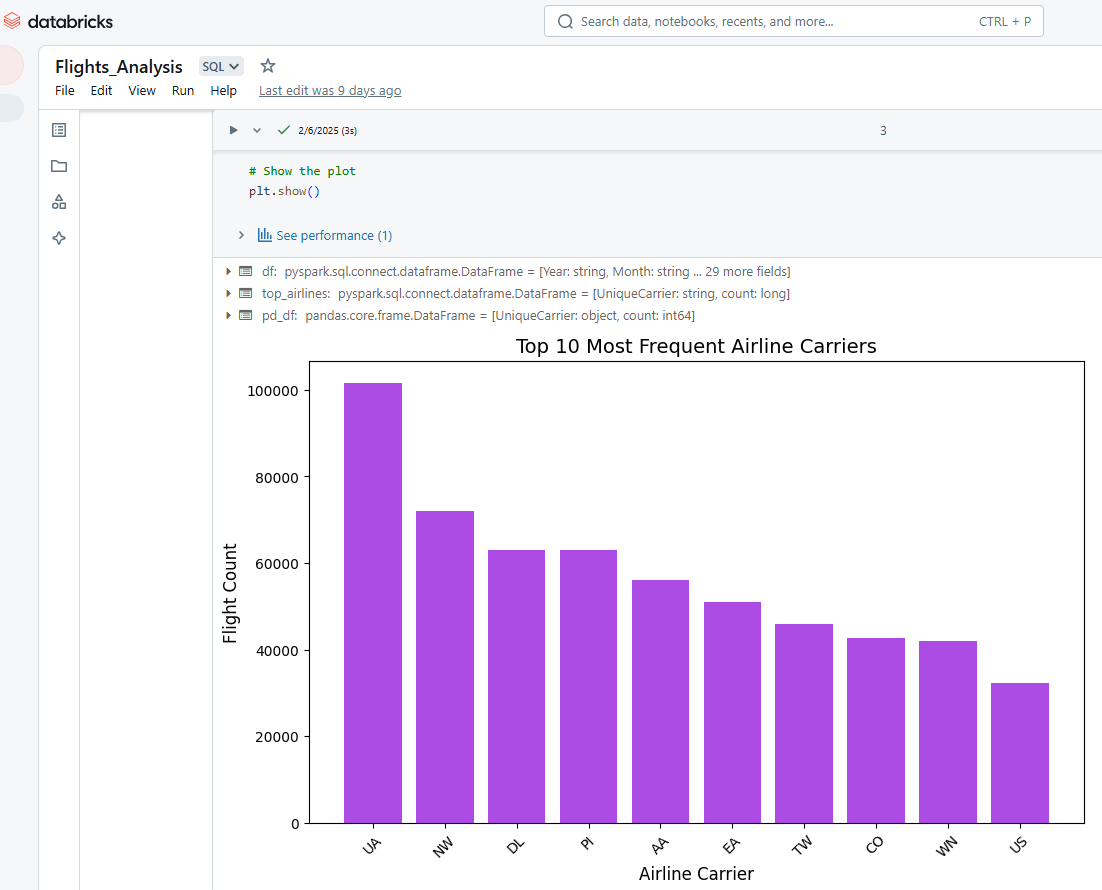
Visualizing outputs in Databricks Notebook. Image by Author.
Similarly, you can display multiple outputs from the execution of a single cell in Databricks Notebook. For example, the output of the code below will show the top 5 rows of the airlines dataset and the count of the top 10 most frequent airline carriers.
%python
# Show the top 5 rows in an interactive table
display(df.limit(5))

# Show the top 10 most frequent airline carriers
top_carriers = df.groupBy("UniqueCarrier").count().orderBy("count", ascending=False).limit(10)
display(top_carriers)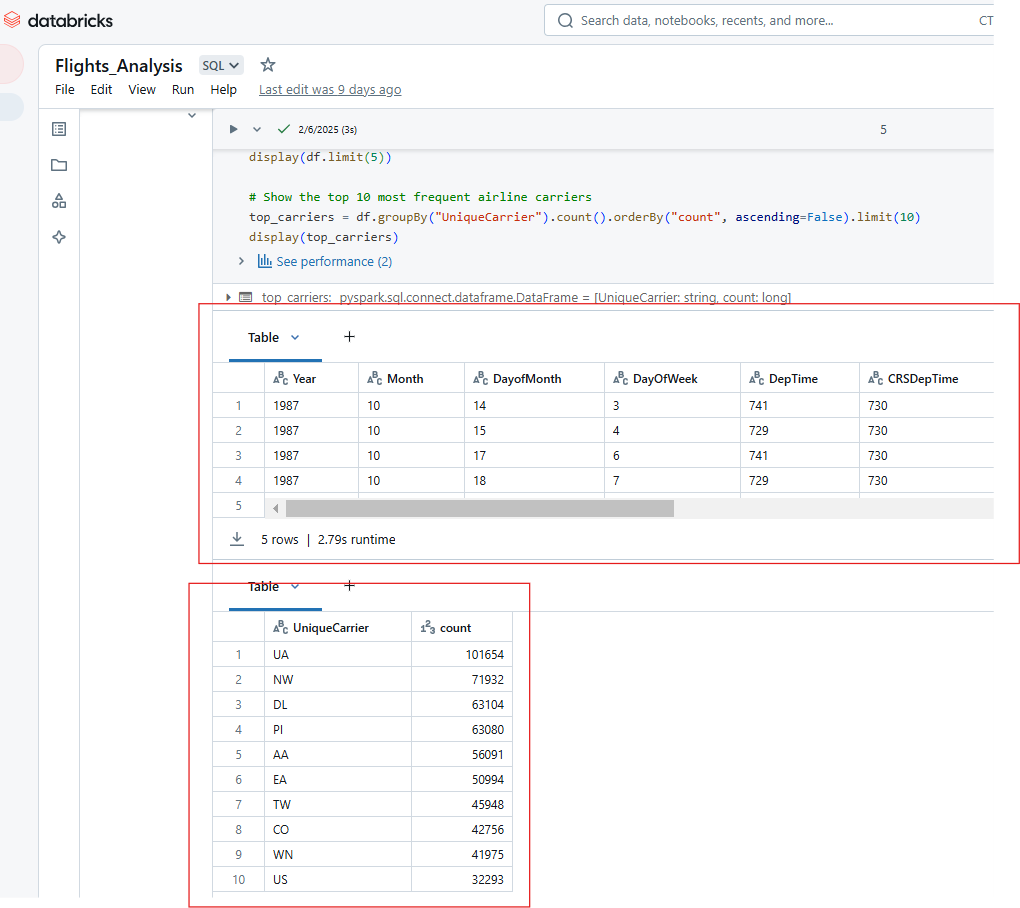
Displaying multiple outputs from the execution of a single cell in Databricks Notebook. Image by Author.
Databricks Notebooks offer powerful automation, versioning, and integration capabilities that enhance productivity, collaboration, and operational efficiency. In this section, I will explore key advanced features and best practices to maximize the potential of Databricks Notebooks.
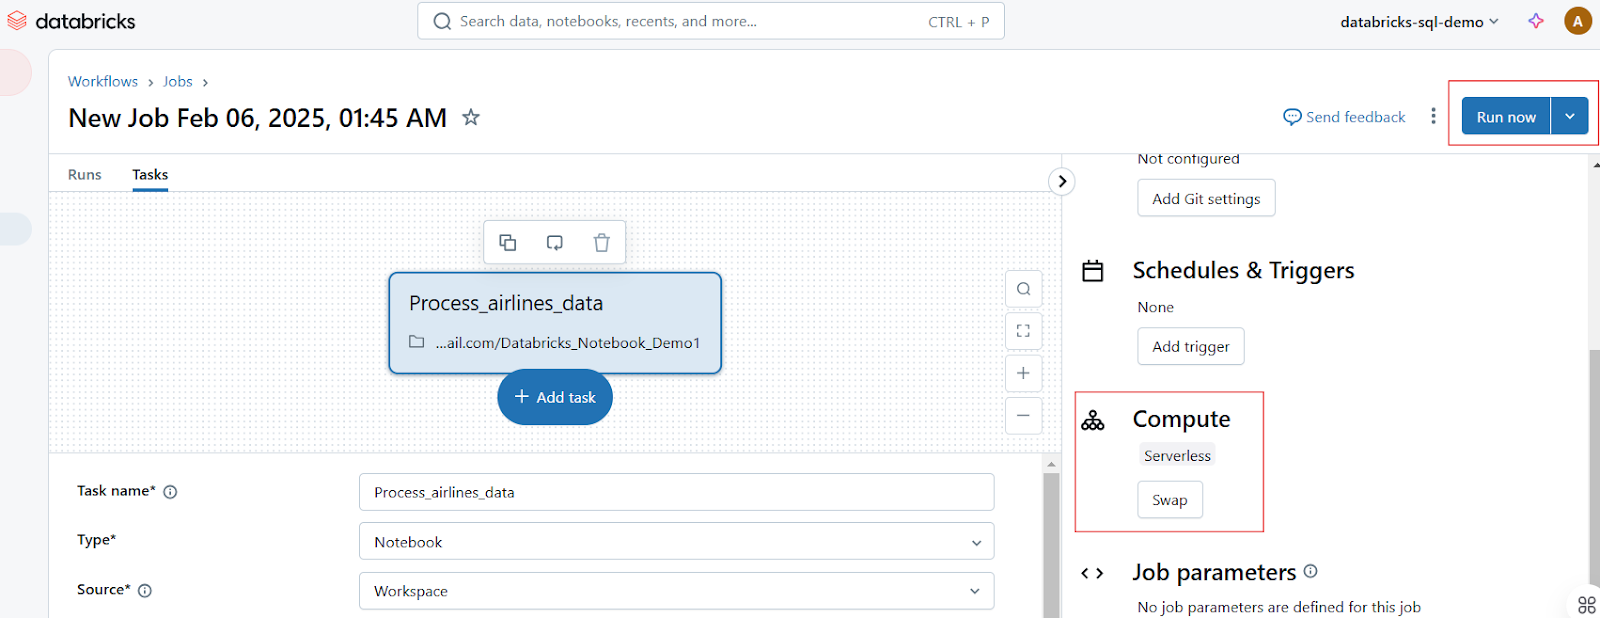
Databricks allows users to automate notebook execution by scheduling them as jobs and parameterizing inputs for dynamic execution.
Users can schedule notebooks to run at specified intervals, ensuring automated workflows for ETL, reporting, and model training. Following the following steps to schedule a notebook job:
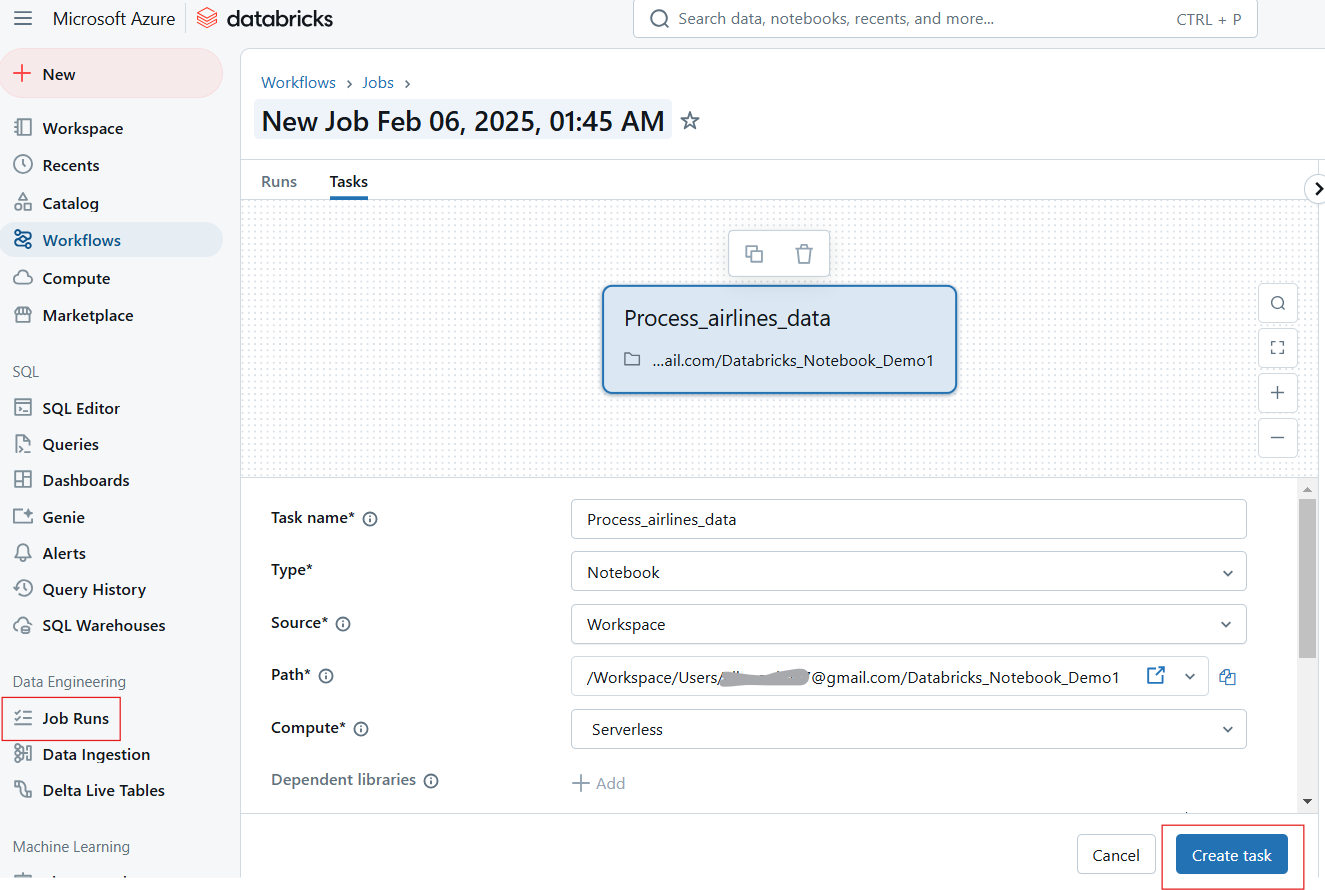
Creating Job Run in Databricks Notebook. Image by Author.
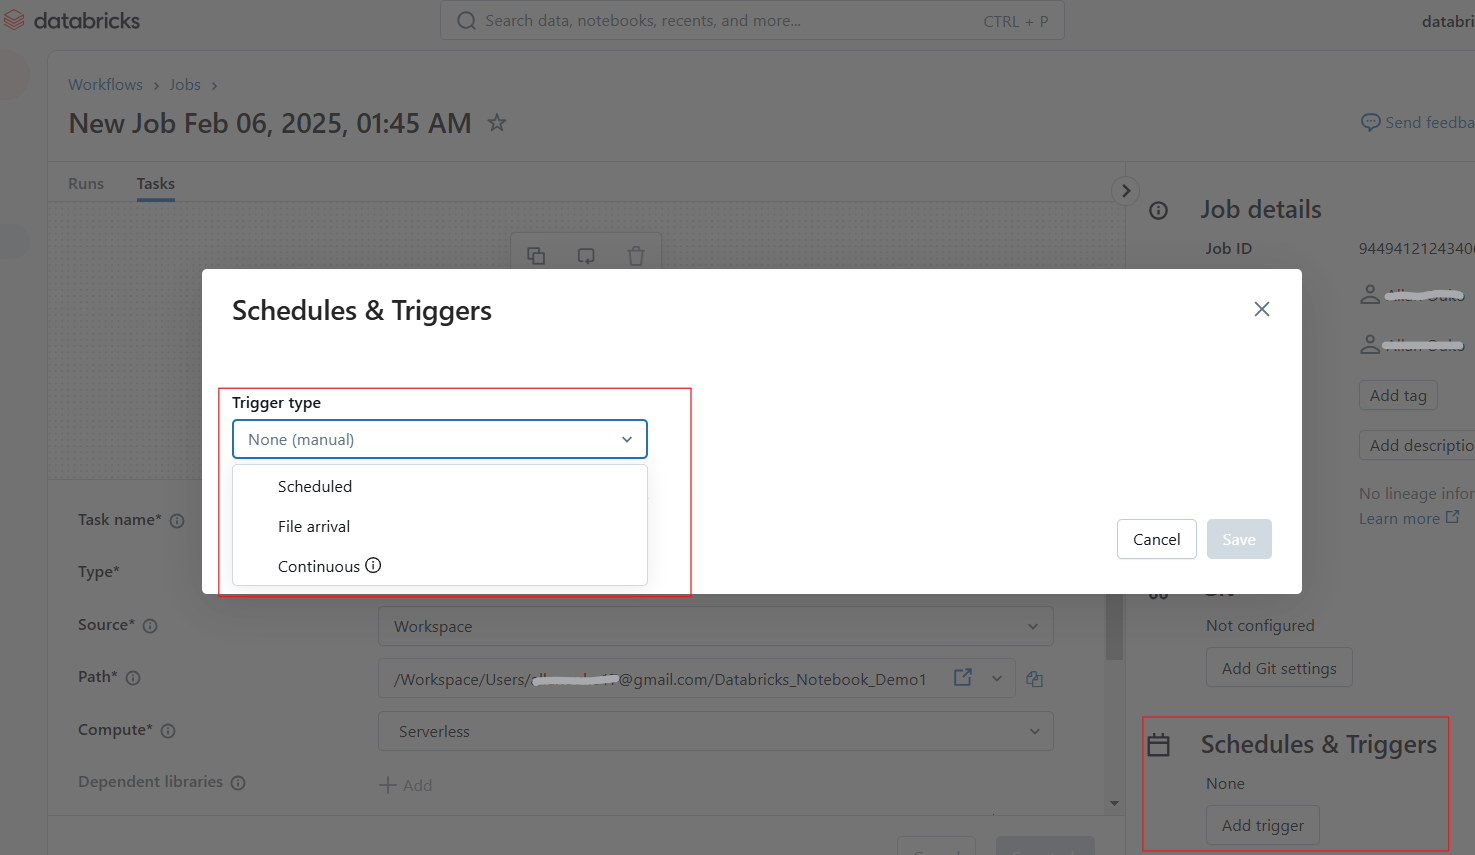
Configuring schedules and triggers in Databricks Notebook. Image by Author.
Executing Job Runs in Databricks Notebook. Image by Author.
Databricks widgets allow you to define parameters dynamically, enabling the same notebook to run with different inputs. For example, the following dbutils.widgets.text() widget creates an interactive text input widget labeled "Enter Parameter" with a default value of default_value. It then retrieves the user-entered value from the widget and prints it.
dbutils.widgets.text("input_param", "default_value", "Enter Parameter")
param_value = dbutils.widgets.get("input_param")
print(f"User Input: {param_value}")
Similarly, the code below generates a dropdown menu labeled dataset with the options sales, marketing, and finance, defaulting to sales. It retrieves the user's selected option and prints the chosen dataset.
dbutils.widgets.dropdown("dataset", "sales", ["sales", "marketing", "finance"])
selected_dataset = dbutils.widgets.get("dataset")
print(f"Processing {selected_dataset} dataset")Databricks provides built-in versioning and collaborative features, making it easy to track changes, restore previous versions, and work with teams in real-time.
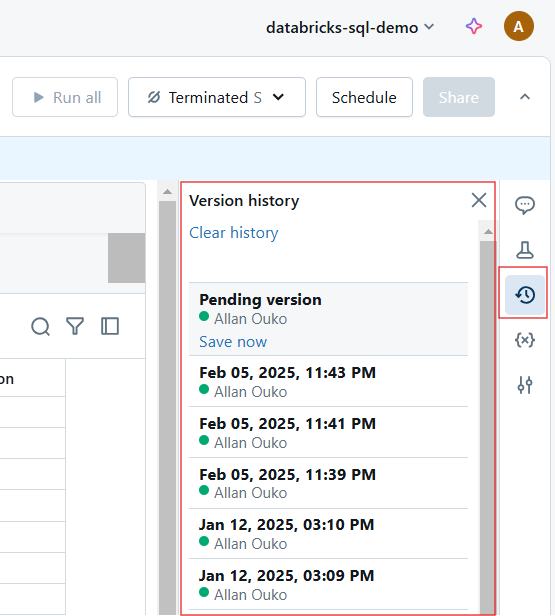
Every change in a Databricks Notebook is automatically versioned. You can do the following for version history:
Viewing version history in Databricks Notebook. Image by Author.
Databricks Notebooks enable teams to co-author, comment, and share insights using the following features:
Databricks Notebooks integrates with Delta Live Tables, MLflow, SQL Warehouses, and CI/CD pipelines to extend functionality.
Delta Live Tables (DLT) simplify data pipeline automation with declarative ETL. The following query creates a Delta Live Table Pipeline in SQL.
-- Creating a live table called 'sales_cleaned' that stores cleaned data
CREATE LIVE TABLE sales_cleaned AS

    -- Selecting all columns where the 'order_status' is 'completed'
    SELECT *
    FROM raw_sales
WHERE order_status = 'completed'; MLflow, integrated with Databricks, allows for tracking machine learning experiments. For example, the code below logs the learning rate and accuracy of a machine learning model to MLflow as part of a tracked experiment. After logging, it ends the experiment session. This allows you to track hyperparameters and model performance over time and compare different runs.
# Import the MLflow library for experiment tracking
import mlflow
mlflow.start_run()
    mlflow.log_param("learning_rate", 0.01)
    mlflow.log_metric("accuracy", 0.95)

mlflow.end_run()Databricks Notebooks can be exported in various formats, including the following:
.html: Share read-only reports.
.ipynb: Convert to Jupyter Notebooks.
.dbc: Databricks Archive for portability.
For example, you can export a notebook via the CLI using the following command.
databricks workspace export /Users/my_notebook /local/path/my_notebook.ipynbDatabricks Notebooks offer a range of powerful features to streamline workflows, enhance productivity, and improve collaboration. In this section, I will show you magic commands, UI enhancements, data exploration techniques, and code management strategies I have found useful when navigating the Databricks Notebooks platform.
Databricks provides magic commands that simplify tasks, such as running scripts, managing files, and installing packages.
To execute another notebook within the current one to modularize workflows, you can use the %run command. You can also use %run to break large projects into reusable notebooks. For example, the following command runs the data_preprocessing notebook to make the variables, functions, and outputs become available in the current notebook.
%run /Users/john.doe/notebooks/data_preprocessingThe %sh command allows you to execute Linux shell commands directly in a notebook. In the example below, the command will list the contents of /dbfs/data/ DBFS.
%sh ls -lh /dbfs/data/Similarly, the %fs command allows you to interact with Databricks File System (DBFS) for file operations. For example, the command below lists all files and directories inside /databricks-datasets/, which contains public datasets provided by Databricks.
%fs ls /databricks-datasets/Similarly, you can use %fs cp for file copying, %fs rm for file removal, and %fs head for file previewing.
The %pip command installs Python packages within the notebook environment. The following command will install the matplotlib package within the current notebook session.
%pip install pandas matplotlibThe %pip freeze command is used to list installed packages and ensure reproducibility.
Databricks has introduced the following UI enhancements that improve navigation, debugging, and overall user experience:
I always recommend enabling the Focus Mode (View → Focus Mode) to minimize distractions.
Databricks provides built-in tools for browsing datasets, understanding schema, and profiling data directly within notebooks.
To browse datasets in DBFS, use %fs ls or display(dbutils.fs.ls()) to inspect available datasets.
display(dbutils.fs.ls("/databricks-datasets/"))You can also explore table schemas directly in the UI sidebar by following the steps below:
For data profiling, you can summarize data using display() or SQL queries.
df.describe().show()%sql
SELECT COUNT(*), AVG(salary), MAX(age) FROM employees;Use the following techniques to manage your code in Databricks Notebooks. For one thing, make sure to store reusable code snippets in separate notebooks and call them using %run. Also, use Databricks Utilities (dbutils) for transformation. Also, for readability, it's a good idea to follow PEP 8 (Python) or SQL best practices. Always use markdown cells for comments.
-- Select customer_id and calculate total revenue per customer
SELECT customer_id, SUM(total_amount) AS revenue
FROM sales_data
-- Group results by customer to get total revenue per customer
GROUP BY customer_id
-- Order customers by revenue in descending order (highest first)
ORDER BY revenue DESC
-- Return only the top 10 customers by revenue
LIMIT 10;
If you encounter issues when working with Databricks Notebooks, you can troubleshoot using the following methods:
Stuck cluster? Restart the kernel (Run → Clear State & Restart).
Slow execution? Check Spark UI (Cluster → Spark UI) for bottlenecks.
Version conflicts? Use %pip list to check dependencies.
Use the following keyboard shortcuts for faster coding:
Databricks Notebooks are widely used in data engineering, machine learning, and business intelligence. In this section, I will highlight real-world case studies and code snippets to illustrate how teams leverage Databricks Notebooks for production workflows.
Consider a scenario where a retail company ingests raw sales data, cleans it, and stores it in a Delta Lake for reporting. The process will be as follows:
This process will improve data reliability and query performance for reporting. The code snippet below is an example of how to implement the above solution:
# Read raw sales data from cloud storage
df = spark.read.format("csv").option("header", "true").load("s3://sales-data/raw/")

# Data cleaning and transformation
df_cleaned = df.filter(df["status"] == "completed").dropDuplicates()

# Save to Delta Table for analysis
df_cleaned.write.format("delta").mode("overwrite").saveAsTable("sales_cleaned")Consider another scenario where a financial institution predicts loan defaults using a machine learning model. To implement this workflow in Databricks Notebook, you will follow the steps below. It will result in automated model tracking and deployment with MLflow.
# import libraries
from sklearn.linear_model import LogisticRegression
from sklearn.model_selection import train_test_split
import mlflow

# Load and prepare data
df = spark.read.table("loan_data").toPandas()
X_train, X_test, y_train, y_test = train_test_split(df.drop("default", axis=1), df["default"])

# Train model
model = LogisticRegression()
model.fit(X_train, y_train)

# Log model in MLflow
mlflow.sklearn.log_model(model, "loan_default_model")In a scenario where a marketing team analyzes customer engagement trends, you will implement the solution in the following steps:
The process will lead to faster decision-making with interactive dashboards.
%sql
-- Count the number of interactions per customer segment
SELECT customer_segment, COUNT(*) AS interactions
FROM user_activity
-- Group by customer segment to aggregate interaction counts
GROUP BY customer_segment
-- Order results by interaction count in descending order
ORDER BY interactions DESC;
If you need to refresh your knowledge about Databricks SQL, I recommend reading our Databricks SQL tutorial to learn how to set up SQL Warehouse from the Databricks web interface.
When running Databricks notebooks concurrently, debugging and maintaining performance can present unique challenges. Here are some ideas to help you keep your notebook error-free in production environments.
Here are some issues and recommended solutions:
A notebook that runs fine individually fails when multiple users or jobs execute it simultaneously: This problem could be caused by shared variables. Also, a single cluster may not support multiple executions. To solve this problem, use widgets for parameterization or use cluster autoscaling to make sure you have enough resources for concurrent executions.
A notebook that used to run quickly now takes significantly longer: The issue could be due to inefficient Spark transformations causing shuffle issues or too many caches/persistent datasets consuming memory. To solve this problem, perform operations using .persist() and .unpersist(). Also, monitor the Spark UI for skewed partitions and optimize queries with Delta tables.
%run fails when trying to execute another notebook: This could happen if the notebook path is incorrect or the referenced notebook depends on an unavailable cluster. To solve this issue, use absolute paths for Notebook imports or check cluster availability to make sure that referenced notebooks use a compatible cluster.
A scheduled notebook job fails: This can happen if the cluster was terminated before execution or if an external dependency failed, such as a database connection or API call. To solve this issue, enable cluster restart on failure. In job settings, enable Retry on Failure. Also, use Try-Except Blocks for external calls.
Read our Mastering the Databricks API tutorial to learn how to use Databricks REST API for job scheduling and scaling automated pipelines.
Use the following techniques to maintain Databricks Notebooks when in production:
Modularize Code into Reusable Notebooks: Break down large notebooks into smaller, reusable units and use %run to call them. Store helper functions in separate utility notebooks.
Use Version Control (Git Integration): Enable Databricks Repos to track changes and rollback versions.
Optimize Cluster Selection for Jobs: Use job clusters instead of interactive clusters for scheduled runs.
Implement Logging and Alerts: Use dbutils.notebook.exit() to log job status. You can also configure email alerts in the Jobs UI to notify teams of failures.
Document Code and Use Markdown for Clarity: Use markdown cells to describe workflow steps and logic.
If you want to explore Databricks' foundational concepts, I highly recommend taking our Introduction to Databricks course. This course sets up the right understanding you need to then experiment with advanced features like magic commands, parameterization, and performance optimizations. As a last thing, I also think you should learn how to obtain a Databricks Certification. Our post helps you explore career benefits, and choose the right certification for your career goals.
Learn Databricks with DataCamp
Course
Course
Course
blog
Josep Ferrer
Tutorial
Allan Ouko
Tutorial
Allan Ouko
Tutorial
Çağlar Uslu
Tutorial
Bex Tuychiev
Tutorial
Allan Ouko