Course
Large Language Models (LLMs) have become very important when developing machine learning models, particularly enhancing the capabilities of natural language processing algorithms. From chatbots to content generators, these models transform how we interact with technology.
However, as LLM's presence grows in number and complexity, evaluating their performance becomes more important. Without suitable and accurate evaluation, knowing if a model is working as expected or needs adjustments is challenging.
This is where MLflow comes in. MLflow is an open-source tool designed to facilitate the management of machine learning experiments. It helps us track the results of different experiments, manage models, and keep everything organized!
In this tutorial, we will explore MLflow’s role in enhancing LLM workflows. I’ll guide you through its setup and show you how to log metrics and track parameters in LLM experiments. Finally, we’ll see how MLflow supports effective model management and deployment.
What is MLflow?
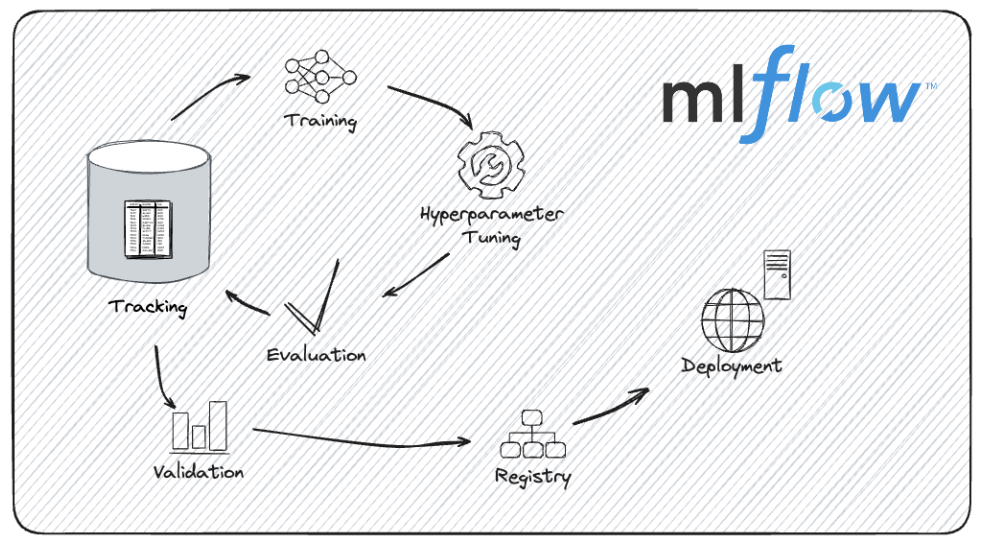
MLflow is an open-source platform designed to manage the end-to-end machine learning lifecycle. It provides tools to streamline the process of developing, tracking, and deploying machine learning models.
Whether we're working on a small project or managing complex experiments with large models, MLflow can help us stay organized and efficient.
Some of the advantages of using MLflow in the machine learning life cycle include:
- It allows us to log and track all aspects of our experiments, recording parameters and metrics, along with the exact code and data versions used. This feature allows us to review past experiments and compare different runs.
- Using MLflow’s model registry, we can manage different versions of our models, keeping track of model versions and stage transitions.
- We can package our code and dependencies into a format that can be easily shared and reproduced, ensuring that our experiments can be replicated.
- MLflow supports multiple deployment options, so we can deploy models locally, to a cloud service, or as part of a larger application.

The model development lifecycle with MLflow. Image source: MLflow documentation.
MLflow is designed to make managing machine learning projects smoother and more transparent. This is especially useful when working with complex models like LLMs, as we’ll see now.
Why Use MLflow for LLM Evaluation?
Using MLflow for LLM evaluation has several benefits, such as tracking model versions, logging evaluation metrics, and comparing performance across fields.
Let’s see these benefits in more detail.
Tracking model versions
The development of LLMs involves frequent iterations and improvements. Each new version brings small enhancements or behavioral changes. MLflow manages these different iterations by tracking model versions systematically. This capability allows us to reproduce results, compare different versions effectively, and maintain a clear history of model evolution.
Let’s say we’re experimenting with different fine-tuning techniques; MLflow can help us manage and review the outcomes of each version, making it easier to identify which iteration yields the best performance.
Because MLflow guarantees that every experiment and its associated results are logged exhaustively, we can confidently share our findings, knowing that others can reproduce our results exactly.
If our project involves experimenting with different LLM architectures or training methodologies, MLflow’s tracking capabilities will make documenting and sharing our work easier.
Logging evaluation metrics
Evaluating LLMs involves monitoring several metrics, such as accuracy, perplexity, and F1 score, among others.
MLflow’s logging functionality allows us to record these metrics efficiently and in an organized manner. Analyzing these metrics gives us a good picture of our model performance.
For example, we might want to compare how different hyperparameters or training datasets affect the model’s performance metrics. With MLflow, we can log and visualize these metrics to draw actionable insights.
As models are deployed and used in real-world applications, they may experience model drift, where their performance degrades due to changes in the data or environment. We can leverage MLflow to monitor and manage model drift by tracking model performance over time.
We can set up regular evaluations and use MLflow to log and analyze how performance metrics change, making actionable decisions in real time.
Comparing performance across models and hyperparameters
One of MLflow's most important advantages is its ability to simplify comprehensive model comparisons. By storing detailed records of different experiments, MLflow enables us to compare the performance of various LLMs and hyperparameter configurations side by side.
Finding the correct hyperparameters can determine a model's success when developing LLMs.
Imagine that we’re fine-tuning an LLM and want to evaluate the impact of different hyperparameter settings. Using MLFlow, we can log and compare results from various learning rates, batch sizes, or dropout rates to determine which configuration yields the best performance, optimizing our model development process.
MLflow’s model registry and tracking functionalities come into play when evaluating multiple LLMs for deployment.
Suppose we have several versions of a language model that we’re considering for a production environment. MLflow can help us log the performance metrics of each model, compare them, and make an informed decision based on empirical evidence rather than intuition alone.
Now that we have a clearer picture of MLflow and its benefits let’s get hands-on!
Looking to get started with Generative AI?
Learn how to work with LLMs in Python right in your browser

Setting Up MLflow for LLM Evaluation
Before evaluating LLMs with MLflow, we need to set up the platform properly. This involves installing MLflow, optionally configuring a tracking server for remote logging, and ensuring our environment is ready for managing experiments and tracking results.
Let’s see how to do that.
Installing MLflow
1. Ensure Python is installed:
First, we need to make sure we have Python installed on our machine. MLflow is compatible with Python 3.6 and above (Be aware that Python 3.8 is now deprecated, so using Python >= 3.9 is recommended). We can check our Python version with:
python --version2. Create a virtual environment (optional but recommended):
It’s a good practice to use a virtual environment when tracking experiments with MLFlow, particularly if we are working with Mac OS X. We can create one using venv or virtualenv.
python -m venv mlflow-envWe activate the virtual environment:
On Windows:
mlflow-env\Scripts\activateOn Mac/Linux:
source mlflow-env/bin/activate3. Install MLflow using pip:
With the virtual environment activated (if used), we can install MLflow via pip:
pip install mlflow4. Install additional dependencies:
MLflow has a few optional dependencies for enhanced functionality. If we need to use specific features, like MLflow's serving model capabilities, we need to install gunicorn.
pip install gunicornIf we're using libraries like TensorFlow or PyTorch, we may need to install their respective MLflow integrations:
pip install mlflow[extras]4. Verify installation:
We then need to make sure MLflow is installed correctly by checking its version:
mlflow --versionSetting up an MLflow tracking server (optional)
If we are working in a collaborative environment or if we are required to perform remote logging, we should set up an MLflow tracking server. This feature allows us to centralize our experiment tracking and management.
1. Run the tracking server:
We can start the MLflow server by specifying the backend store and the artifact location.
mlflow server --backend-store-uri sqlite:///mlruns.db --default-artifact-root ./mlruns-
--backend-store-urispecifies where the experiment data is stored. We can use any database systems (PostgreSQL, MySQL, etc). -
--default-artifact-rootspecifies the directory where artifacts, e.g., model files, are stored.
2. Configure the tracking server:
We need to make sure that our MLflow clients are configured to log into the tracking server. We can set the MLFLOW_TRACKING_URI environment variable to point to our server.
export MLFLOW_TRACKING_URI=http://localhost:50003. Access the tracking UI:
Now, we can now open a web browser and navigate to http://localhost:5000 to access the MLflow UI. This interface allows us to view experiments, compare results, and manage your MLflow projects, as we’ll see later.
Loading and Evaluating LLMs
With MLflow set up and ready, it’s time to dive into the core tasks of loading and evaluating LLMs. Let’s see how we can select a pre-trained LLM, load it using different libraries, and prepare an evaluation dataset to measure the model's performance.
Choosing a pre-trained LLM
When selecting a pre-trained LLM, libraries like Hugging Face Transformers offer many options. For example, we can load a pre-trained model, such as GPT (for text generation) or BERT (for text classification and other tasks).
1. Install Hugging Face Transformers
First, we’ll ensure we have the Hugging Face Transformers library installed. We can achieve this by using pip.
pip install transformers2. Load a pre-trained model and tokenizer
Now, we load the BERT model using the transformers library, including both the model and tokenizer, which are necessary for processing text and generating predictions.
from transformers import (
BertForSequenceClassification,
BertTokenizer
)
# Load pre-trained model and tokenizer
model_name = "textattack/bert-base-uncased-yelp-polarity"
tokenizer = BertTokenizer.from_pretrained(model_name)
model = BertForSequenceClassification.from_pretrained(model_name)
The model bert-base-uncased is used when the text data we are working with is mostly in lowercase and uppercase, but we do not need the model to differentiate between uppercase and lowercase words.
Preparing the evaluation dataset
To evaluate an LLM, we need a suitable dataset that matches the task we are assessing. Let’s see how to prepare a text-based evaluation dataset for sentiment analysis:
1. Load or create and preprocess the dataset
Our data can be stored in several places: on our local machine’s disk, in a Github repository, or The Hugging Face Hub, an extensive collection of community-curated and popular research datasets.
For this tutorial, we will use a large movie review dataset for sentiment analysis called IMDB. We will use the datasets library to load the pre-built dataset:
Installing the dataset library:
pip install datasetsLoading a Dataset:
from datasets import load_dataset
# Load the dataset IMDb for sentiment analysis
dataset = load_dataset("imdb")
2. Preprocessing for sentiment analysis
We will use the previously loaded BERT tokenizer to preprocess the dataset for sentiment analysis.
def preprocess_function(examples):
    return tokenizer(examples['text'], padding="max_length", truncation=True)
tokenized_datasets = dataset.map(preprocess_function, batched=True)
Running LLM Evaluations and Logging Metrics with MLflow
Now that our LLMs are loaded and our evaluation dataset prepared, it’s time to run evaluations and log metrics.
Tracking experiment metadata
1. Import MLflow and start a new experiment
To track experiments with MLflow, we first need to start a new experiment and log relevant metadata, such as the model name, version, and evaluation parameters.
import mlflow
import mlflow.pytorch
# Start a new experiment
mlflow.set_experiment("LLM_Evaluation")
with mlflow.start_run() as run:
    # Log experiment metadata
    mlflow.log_param("model_name", "bert")
    mlflow.log_param("model_version", "v1.0")
    mlflow.log_param("evaluation_task", "sentiment_analysis")
2. Log evaluation parameters
We can now log any parameters related to the evaluation process, such as the evaluation dataset size or specific configurations used during the evaluation.
with mlflow.start_run() as run:
	  mlflow.log_param("dataset_size",  len(dataset['test']))
Logging evaluation metrics
Once we have trained and made the corresponding predictions using our model, we can evaluate the LLM and log various metrics that reflect its performance.
Sentiment analysis is a classification problem, so we can evaluate our model using metrics such as accuracy and F1 score. For text generation tasks, metrics like BLEU score or perplexity are commonly used.
from sklearn.metrics import accuracy_score, f1_score
# Assuming y_true and y_pred are true labels and model predictions
accuracy = accuracy_score(y_true, y_pred)
f1 = f1_score(y_true, y_pred, average='weighted')
with mlflow.start_run() as run:
    mlflow.log_metric("accuracy", accuracy)
    mlflow.log_metric("f1_score", f1)
Comparing LLM Performance with MLflow
Once multiple evaluation runs are tracked with MLflow, comparing their performance is essential for determining the best-performing models and configurations.
Let’s understand how to track multiple runs and use MLflow’s UI to visualize and compare results effectively.
Tracking multiple runs
First, we need to track multiple runs within the same experiment or across different experiments to compare the performance of different LLM versions.
1. Log multiple runs
We can log multiple runs under a single experiment by starting new runs for each model or configuration we want to evaluate.
models = [("bert-base-cased", "v1.0"), ("bert-base-uncased", "v1.0")]
y_pred_dict = {
       "bert-base-cased": y_pred_case,
       "bert-base-uncased": y_pred_uncase
}
for model_name, model_version in models:
    with mlflow.start_run() as run:
        # Log model and version
        mlflow.log_param("model_name", model_name)
        mlflow.log_param("model_version", model_version)

        # Perform evaluation and log metrics
	   y_pred = y_pred_dict[model_name]
        accuracy = accuracy_score(y_true, y_pred)
        f1 = f1_score(y_true, y_pred, average='weighted')

        mlflow.log_metric("accuracy", accuracy)
        mlflow.log_metric("f1_score", f1)
2. Track experiments with different models
Let’s imagine that we want to evaluate different types of models. To this end, we can use MLFlow to create an experiment and log the models together.
Performing model logging in MLFlow is the same as doing version control for machine learning models. Recording model and environment details guarantees reproducibility.
First, we’ll set up an experiment. Then, we log each model in a separate MLFlow run, including the run IDs and artifact paths.
 # Create an experiments for the different models
mlflow.set_experiment("sentiment_analysis_comparison")
model_names = ["bert-base-cased", "bert-base-uncased"]
run_ids = []
artifact_paths = []
for model, name in zip([betcased, bertuncased], model_names):
    with mlflow.start_run(run_name=f"log_model_{name}"):
        artifact_path = f"models/{name}"
        mlflow.pyfunc.log_model(
            artifact_path=artifact_path,
            python_model=model,
        )
        run_ids.append(mlflow.active_run().info.run_id)
        artifact_paths.append(artifact_path)
Now, we can evaluate the models and log the results. MLflow provides an API, mlflow.evaluate(), to help evaluate our LLMs.
for i in len(model_names):
    with mlflow.start_run(run_id=run_ids[i]):
        # reopen the run with the stored run ID
        evaluation_results = mlflow.evaluate(
            model=f"runs:/{run_ids[i]}/{artifact_paths[i]}",
            model_type="text",
            data=dataset['test'],
        )
Visualizing and comparing results
After we have logged the different metrics and models in MLFlow, we can make a comparison. We can use the MLflow user-friendly interface to visualize and compare evaluation metrics from different runs. To do that, we need to start the MLflow server if it’s not already running
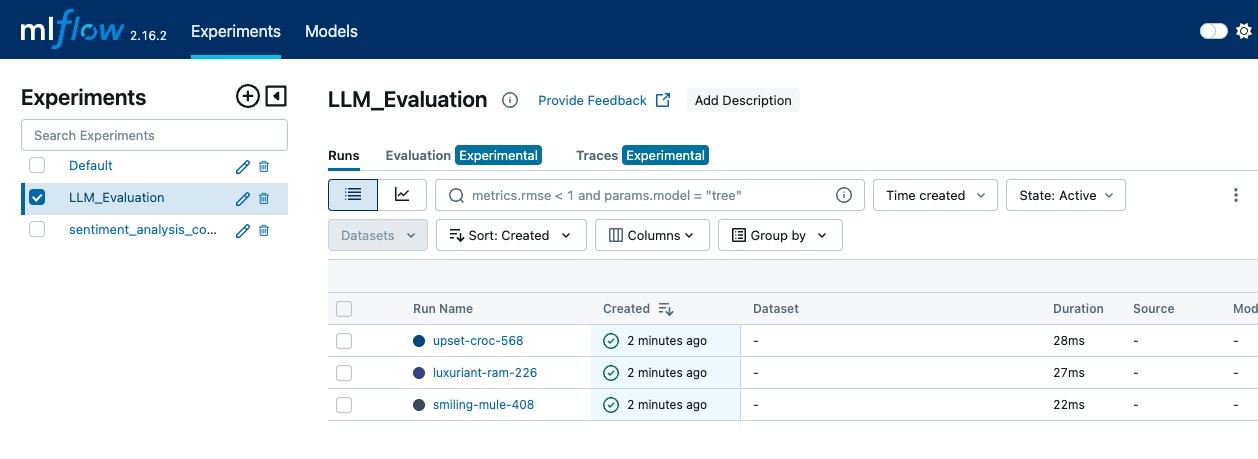
mlflow server --backend-store-uri sqlite:///mlruns.db --default-artifact-root ./mlrunsWe then open a web browser and navigate to http://localhost:5000 to access the MLflow UI. In the MLflow UI, we go to the "Experiments" page to view all our experiments. We click on the experiment name to see a list of runs associated with it.

The MLFLow interface shows the Experiments tab, where the different runs and log events can be seen—image by Author.
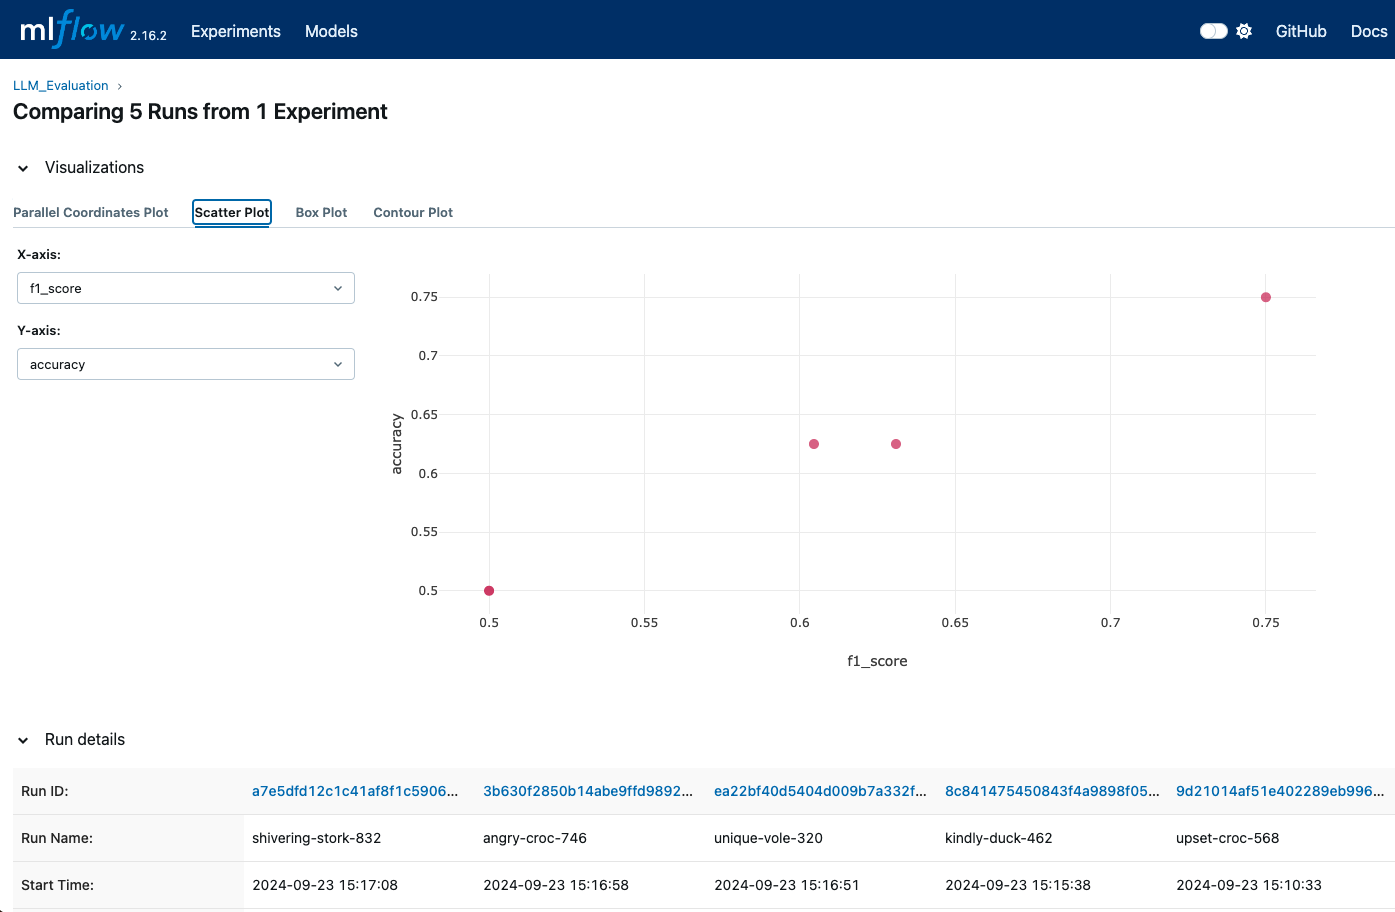
Within an experiment, we can compare different runs by selecting multiple runs and viewing their metrics side-by-side.
The UI allows us to see a visual representation of metrics such as accuracy, F1 score, and other evaluation metrics. We can also use MLflow’s built-in visualizations to generate plots and graphs for more detailed comparisons.

MLFlow visualizations can show us when different runs are logged so we can compare different metrics—image by Author.
The MLflow UI provides detailed charts and logs for each run. We can access these logs and visualizations to understand which model or configuration performs best based on the metrics logged.
Advanced Techniques for LLM Evaluation with MLflow
For a deeper and more comprehensive evaluation of LLMs, MLflow offers advanced techniques that enhance tracking and analysis. We’ll review how to log model artifacts for thorough tracking and utilize MLflow for hyperparameter tuning to optimize LLM performance.
Logging model artifacts
Logging model artifacts is very important for preserving and analyzing the details of our experiments. Artifacts can provide a complete picture of our model performance and help reproduce results.
Among the artifacts we can log, we can find:
- Model weights: We can save and log model weights using formats appropriate for our framework (e.g.
joblibfor scikit-learn or TensorFlowSavedModelformat). - Evaluation results: We can log metrics such as accuracy, precision, recall, F1-score, and confusion matrices and save them in CSV or JSON formats for easy access.
- Generated outputs: If our model produces outputs (like predictions or generated images), we can log these as artifacts, too. This can include files, plots, or visualizations that help understand model performance.
Here’s an example:
import matplotlib.pyplot as plt
from sklearn.metrics import ConfusionMatrixDisplay
with mlflow.start_run() as run:
    # Log the model
    mlflow.pytorch.save_model(model, "model")

    # Log the model weights
    joblib.dump(model, "model_weights.pkl")
    mlflow.log_artifact("model", artifact_path="model")

    # Log the confusion matrix as image
    confusion_matrix = pd.DataFrame(confusion_matrix(y_test,    predictions))
    cm = ConfusionMatrixDisplay(confusion_matrix=cm)
    plt.savefig("confusion_matrix.png")
    mlflow.log_artifact("confusion_matrix.png")

    # Generate predictions
    outputs = dataset['test']
    outputs['prediction'] = model.predict(dataset['test'])
    with open("generated_outputs.txt", "w") as f:
           for output in outputs:
               f.write(output + "\n")
       # Log the file
       mlflow.log_artifact("generated_outputs.txt")
Hyperparameter tuning with MLflow
Hyperparameter tuning is a key part of optimizing LLM performance. In our experiments, we can use MLflow to log different hyperparameter configurations. This enables us to compare the effects of various settings and find the optimal configuration.
from transformers import Trainer, TrainingArguments
def train_and_log_model(model, lr, bs):
training_args = TrainingArguments(
                     output_dir='./results',
                     num_train_epochs=3,
                     per_device_train_batch_size=batch_size,
                     per_device_eval_batch_size=batch_size,
                     learning_rate=learning_rate,
                     evaluation_strategy="epoch")
trainer = Trainer(model=model,
                  args=training_args,
                  train_dataset=(X_train, y_train)
                  eval_dataset=(X_test, y_test))
with mlflow.start_run() as run:
# Log hyperparameters
           mlflow.log_param("learning_rate", lr)
           mlflow.log_param("batch_size", bs)
            trainer.train()
            eval_result = trainer.evaluate()
            mlflow.log_metric("eval_accuracy",
                               eval_result['eval_accuracy'])
hyperparameter_grid = [{"learning_rate": 5e-5, "batch_size": 8},
                       {"learning_rate": 3e-5, "batch_size": 16}]
for params in hyperparameter_grid:
train_and_log_model(params["learning_rate"],
                    params["batch_size"])
Another advantage of MLflow is that it can be used with hyperparameter optimization libraries like Optuna or Ray Tune to automate the tuning process.
Best Practices for LLM Evaluation with MLflow
An accurate evaluation of LLMs involves more than running tests and logging metrics. It requires a strategic approach to ensure consistency, accuracy, and efficiency. Adopting best practices can enhance the reliability and effectiveness of the evaluation process.
Using stable and representative datasets is one of the first things that contributes to effective evaluation. By making sure that our evaluation datasets are stable and representative of the tasks our LLM is designed to perform, we’ll get meaningful comparisons over time and across different models or versions. If the dataset changes, it can be difficult to assign the performance changes to the model rather than the dataset itself.
Not only the dataset but also how we preprocess it is important. We need to apply the same preprocessing steps to all evaluation datasets to ensure comparable results. This includes tokenization, normalization, and handling of special cases. Consistent preprocessing ensures that variations in model performance are not due to differences in how the data is handled.
As seen above, using MLflow’s model registry to allow for version control helps us track different versions of our LLMs. This facilitates comparing model performance and rolling back to previous versions if needed. We should log all details and keep track of the changes made to the models, including modifications to architecture, hyperparameters, or training data.
Finally, automating the evaluation process by integrating it into continuous integration/continuous deployment (CI/CD) pipelines can help us make sure that models are evaluated consistently and promptly whenever updates are made. We should set up scheduled evaluations to periodically assess model performance. This helps us monitor model drift and ensure that models meet performance standards over time.
Conclusion
Evaluating LLMs effectively requires a structured and systematic approach, and MLflow provides a framework to support this process.
In this tutorial, we installed MLflow and set up a tracking server. Then, we evaluated our LLM by logging important metrics, tracked multiple runs to compare them, and used MLflow’s UI to visualize and analyze these comparisons effectively.
If you want to take your MLflow knowledge to the next level, check out our Introduction to MLflow course!
Build Machine Learning Skills
FAQs
What is MLFlow, and how is it used for evaluating language models?
MLFlow is an open-source platform for managing the machine learning lifecycle, including experimentation, reproducibility, and deployment. It offers tools to track metrics, parameters, and models, making it easier to evaluate LLM effectively.
How is MLflow installed?
Installation can be done via pip with the command pip install mlflow. You’ll also need to ensure your environment is set up with any necessary dependencies for your specific ML framework.
How can the evaluation results be visualized in MLFlow?
MLFlow provides built-in tools for visualizing metrics and performance over time. MLFlow UI can be leveraged to compare different runs, visualize trends, and create informative plots for deeper insights.
How does MLflow handle hyperparameter tuning for LLMs?
MLflow allows you to log different hyperparameter configurations alongside their respective metrics, making it easy to compare the effects of various settings on model performance.
What are some of the best practices to follow when evaluating LLM with MLFlow?
Some best practices include the use of consistent logging for parameters and metrics, standardizing preprocessing, track model versions, automating evaluations, and regularly monitoring performance to ensure effective LLM evaluation with MLflow.
Can MLflow be integrated with other tools used in LLM development, like TensorBoard or Hugging Face?
Yes, MLflow can be integrated with tools like TensorBoard for additional metrics visualization or with the Hugging Face library for seamless model loading and evaluation. You can configure MLflow to log metrics and parameters from these tools and track them alongside other MLflow-managed experiments.
How can MLflow help manage data drift in LLM applications over time?
MLflow’s tracking server can log and monitor metrics over time, making it easy to detect model drift—changes in model performance due to evolving data or environments. By setting up scheduled evaluations with MLflow, you can analyze these metrics periodically and decide if your LLM needs retraining or other adjustments.
Can I use MLflow to compare LLM models trained on different datasets?
Absolutely. MLflow lets you track each experiment, including information on the dataset used. By labeling each run with the dataset name and relevant configurations, you can use the MLflow UI to compare models trained on different datasets, making it easier to find the best dataset for a specific task.
Does MLflow support multi-GPU or distributed model training for LLMs?
While MLflow itself doesn’t handle distributed training, it can be used alongside distributed training frameworks (like Horovod or PyTorch’s DDP) to log parameters, metrics, and artifacts in a distributed setting. MLflow simply logs the results from distributed runs, ensuring you capture details from each configuration.
Can I use MLflow to version control fine-tuned LLMs separately from base models?
Yes, MLflow’s model registry lets you manage different versions of your models, including fine-tuned LLMs. You can label and log each fine-tuned model as a unique version under the same experiment or project. This setup makes it easy to track, compare, and revert to specific fine-tuned versions when needed.


