
Track
Developing AI Applications
21 hr
Gemini 2.0 Flash has a context window of 1,000,000 tokens, which allows full dataset processing without the need for chunking or retrieval mechanisms. Additionally, it is cost-effective compared to larger models like Gemini Ultra.
Many applications use retrieval-augmented generation (RAG) for structured data analysis, but Gemini 2.0 Flash eliminates the need for RAG because:
If you want to use Gemini 2.0 Flash Lite to optimize cost, you can do it, but be aware that at the moment of publishing this article, it is rate-limited to 60 queries per minute and is only available in the us-central1 region.
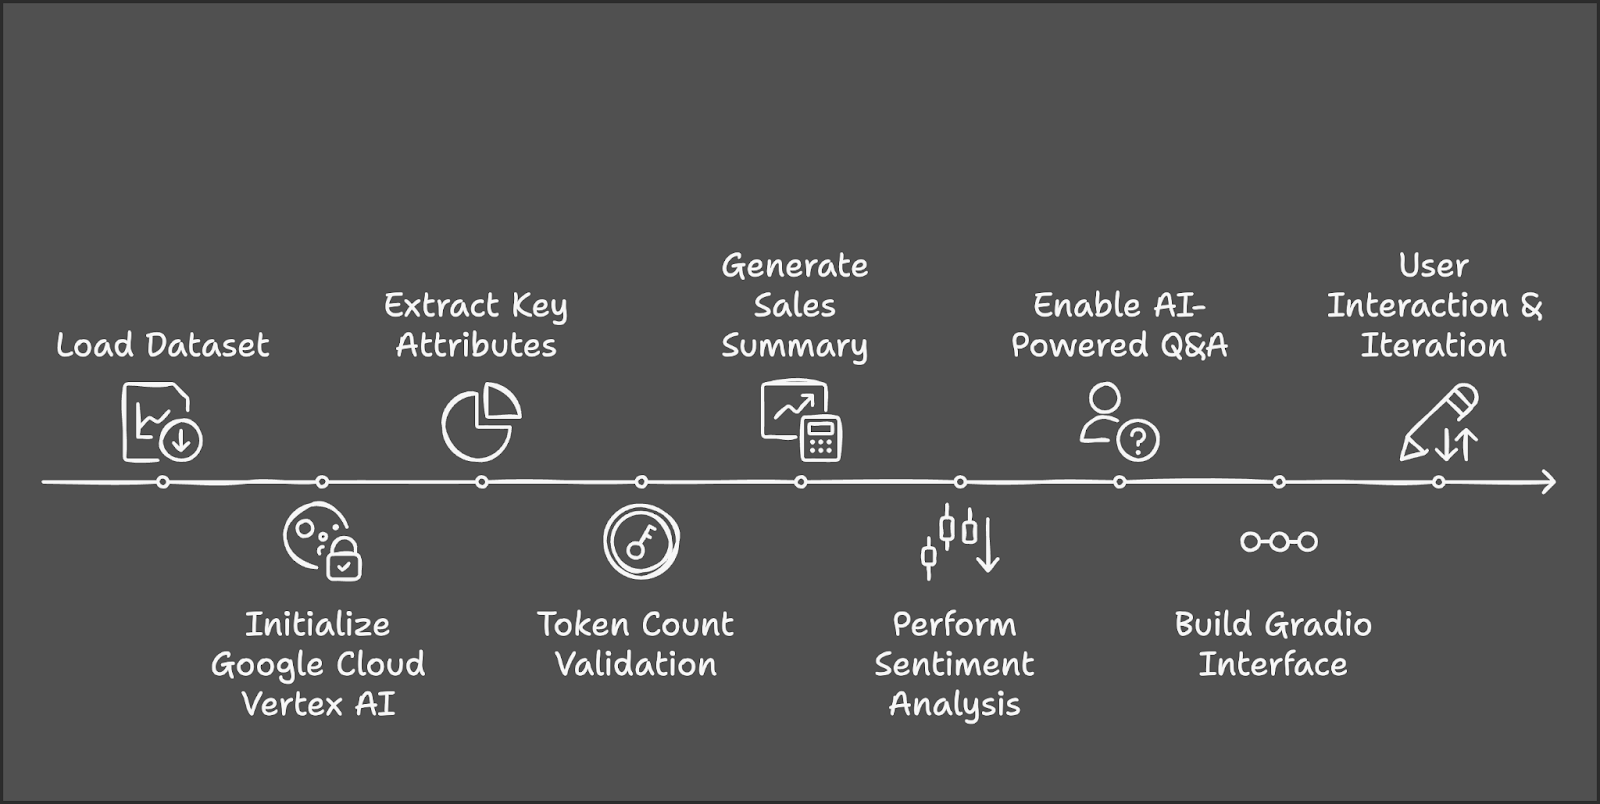
Let’s outline the main steps that we’re going to take:
Before we start, let’s ensure that we have the following tools and libraries installed:
Run the following commands to install the necessary dependencies:
!pip install gradio -q
!pip install --upgrade --quiet google-genai
!pip install datasets -q
!pip install tiktoken -q
!pip install kaggle -q
Once the above dependencies are installed, run the following import commands:
import sys
import os
import tiktoken
from datasets import load_dataset
import pandas as pd
import gradio as gr
import vertexai
from vertexai.preview.generative_models import GenerativeModelWe will use the AWS SAAS Sales dataset for this project, which is available on Kaggle. Start by setting up Kaggle credentials and passing the author and dataset name, respectively.
# Set Kaggle API credentials
os.environ["KAGGLE_CONFIG_DIR"] = os.path.expanduser("~/.kaggle")

# Download dataset
!kaggle datasets download -d nnthanh101/aws-saas-sales --unzip
Now that the dataset has been downloaded to our environment, we can start working with it. We will use the pandas library to load and read the dataset from the path.
dataset_path = "path_to_your_data.csv"  # Load dataset from specified path
dataset_df = pd.read_csv(dataset_path)
This dataset contains 9,994 transactions with columns such as:
To use Gemini 2.0 Flash, we need to authenticate with Google Cloud.
if "google.colab" in sys.modules:
    from google.colab import auth
    auth.authenticate_user()
To initialize Vertex AI, search for Vertex AI API and enable it (make sure billing is enabled on your account).

Save the project’s ID and location for future reference. Running Gemini 2.0 Flash for this project cost about $0.07 for approximately five API calls.
# Set up Google Cloud Vertex AI
PROJECT_ID = "Your_project_id"
LOCATION = "Your_location"
vertexai.init(project=PROJECT_ID, location=LOCATION)
model = GenerativeModel("gemini-2.0-flash")
To learn more about Vertex AI, check out this introductory tutorial on Vertex AI.
Step 4: Data Preprocessing
To ensure proper data handling, normalize column names and extract key categories. We find unique industries and products that act as a source for our markdown in the demo. If you are using any different dataset, then choose your categories accordingly.
# Normalize column names to prevent key errors
df.columns = df.columns.str.strip().str.lower()
print("Dataset columns:", df.columns)  # Debugging

# Extract unique industry names and product categories
unique_industries = sorted(df["industry"].dropna().unique().tolist())
unique_industries.insert(0, "All Industries")  # Add "All Industries" option
unique_products = sorted(df["product"].dropna().unique().tolist())
unique_products.insert(0, "All Products") # Add "All Products" optionNow that we have processed our dataset, we will now count the tokens. Since Gemini 2.0 Flash has a 1,000,000 token limit, it is important to calculate the number of tokens in the dataset before passing it to the model. This dataset has 805447 tokens.
# Initialize tokenizer (use "cl100k_base" for Gemini/GPT models)
encoder = tiktoken.get_encoding("cl100k_base")

# Choose relevant text columns
text_columns = ['industry', 'product', 'sales', 'quantity', 'discount', 'profit']

# Create a combined text column for tokenization
df["combined_text"] = df[text_columns].astype(str).agg(" | ".join, axis=1)

# Function to count tokens
def count_tokens(texts):
    total_tokens = sum(len(encoder.encode(str(text))) for text in texts)
    return total_tokens

# Calculate total tokens
total_tokens = count_tokens(df["combined_text"].dropna().tolist())
print(f"Total tokens in the dataset: {total_tokens}")
We use Tiktoken for tokenization as follows:
cl100k_base tokenizer, optimized for Gemini and GPT models.combined_text and calculate the total number of tokens across all rows.Now, we can work on the analyst parts of the demo. This function generates a sales summary based on the selected industry and product.
def summarize_sales(industry, product):
filtered_data = df.copy()
if industry != "All Industries":
filtered_data = filtered_data[filtered_data["industry"] == industry]
if product != "All Products":
filtered_data = filtered_data[filtered_data["product"] == product]
if filtered_data.empty:
return "No sales data available for the selected industry and product."
# Create sales report
total_sales = filtered_data["sales"].sum()
total_quantity = filtered_data["quantity"].sum()
total_profit = filtered_data["profit"].sum()
avg_discount = filtered_data["discount"].mean()
sales_text = f"""
Sales Data for {industry} - {product}:
- Total Sales: ${total_sales:,.2f}
- Total Quantity Sold: {total_quantity}
- Total Profit: ${total_profit:,.2f}
- Average Discount: {avg_discount:.2f}%
"""
# Generate summary using Gemini 2.0 Flash
response = model.generate_content(sales_text, stream=True)
response_text = "".join(chunk.text for chunk in response)
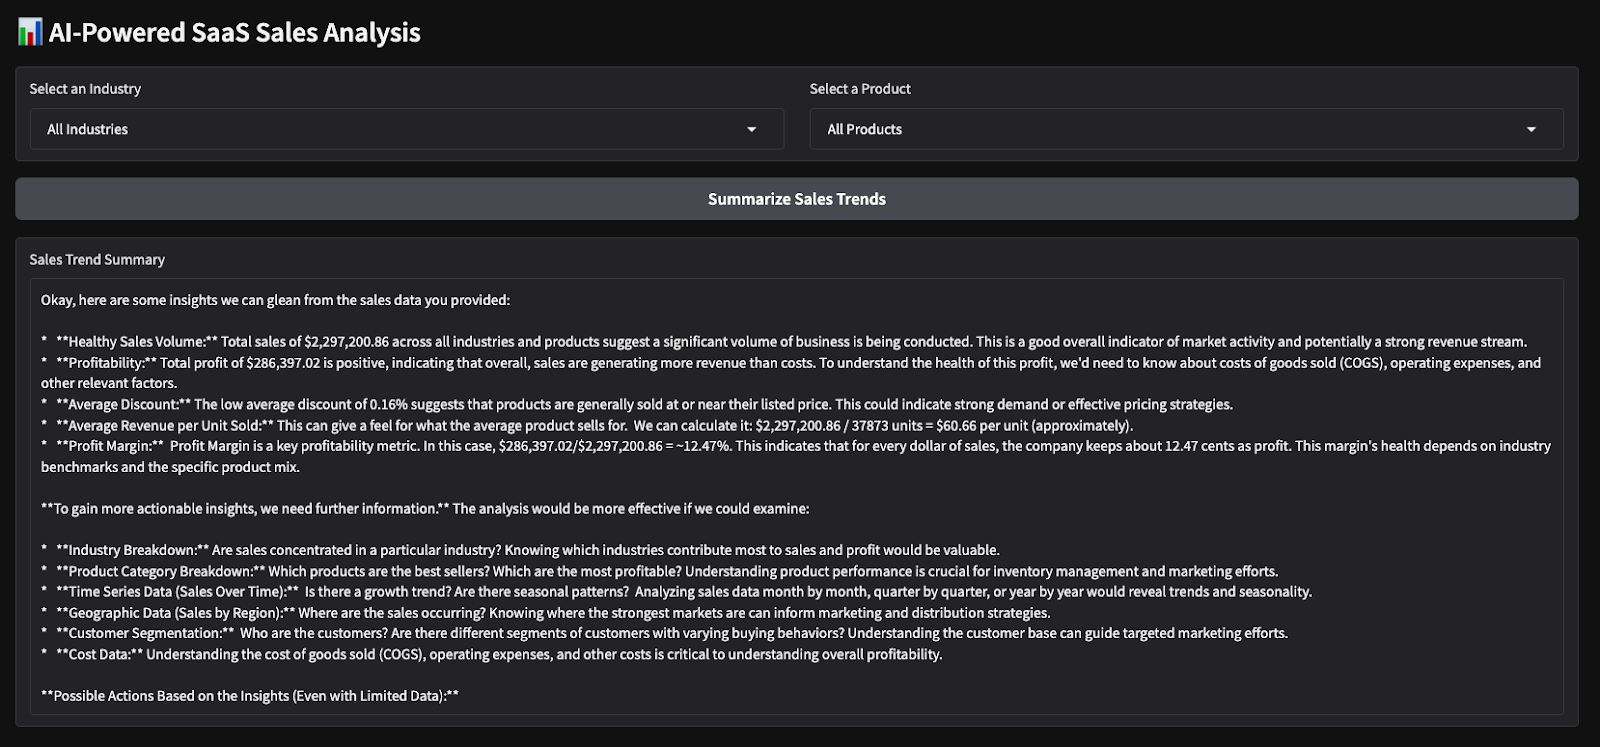
return response_textThe summarize_sales() function filters the dataset based on the selected industry and product, calculates key sales metrics such as total sales, quantity sold, profit, and average discount, and formats the data into a structured prompt. This prompt is then passed into the Gemini 2.0 Flash model to generate a concise sales summary.
Similarly, we define another function that performs sentiment analysis based on the total profit.
def analyze_sales_sentiment(industry, product):
filtered_data = dataset_df.copy()
if industry != "All Industries":
filtered_data = filtered_data[filtered_data["industry"] == industry]
if product != "All Products":
filtered_data = filtered_data[filtered_data["product"] == product]
if filtered_data.empty:
return "No sales data available for sentiment analysis."
total_sales = filtered_data["sales"].sum()
total_profit = filtered_data["profit"].sum()
# Define sentiment labels based on profit margins
if total_profit > 500000:
sentiment_label = "Positive"
elif total_profit > 100000:
sentiment_label = "Neutral"
else:
sentiment_label = "Negative"
sentiment_text = f"""
The total sales for {industry} - {product} is ${total_sales:,.2f},
with a total profit of ${total_profit:,.2f}.
Based on market trends, this performance is considered {sentiment_label}.
Analyze the sentiment of sales performance for this product.
"""
# Generate sentiment analysis using Gemini Flash 2.0
response = model.generate_content(sentiment_text, stream=True)
# Collect response text
response_text = "".join(chunk.text for chunk in response)
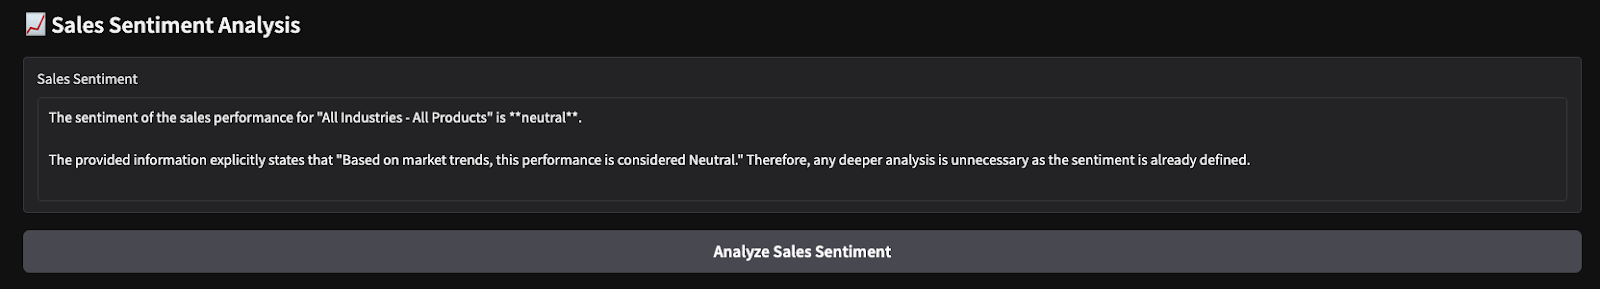
return response_textThe analyze_sales_sentiment() function analyzes sales sentiment by filtering the dataset based on the selected industry and product, calculating total sales and total profit, and generating an AI-powered sentiment analysis using Gemini 2.0 Flash. The model is then prompted with a structured summary of sales performance, allowing it to evaluate sentiment dynamically instead of relying solely on fixed profit thresholds.
Now, we have all key logic functions in place. Next, we work on building interactive UI with Gradio.
with gr.Blocks() as demo:
    gr.Markdown("# AI-Powered SaaS Sales Analysis")
    industry_dropdown = gr.Dropdown(choices=unique_industries, label="Select an Industry")
    product_dropdown = gr.Dropdown(choices=unique_products, label="Select a Product")
    summarize_btn = gr.Button("Summarize Sales Trends")
    summary_output = gr.Textbox(label="Sales Trend Summary")
    summarize_btn.click(summarize_sales, inputs=[industry_dropdown, product_dropdown], outputs=summary_output)
    demo.launch(debug=True)
This code creates an interactive Gradio UI for AI-powered SaaS sales analysis, where users can select an industry and product from dropdown menus and click a button to generate a sales summary. The selected inputs are passed to the summarize_sales() function, which processes the data and returns insights, displayed in a text box. The Gradio app is then launched for real-time interaction.
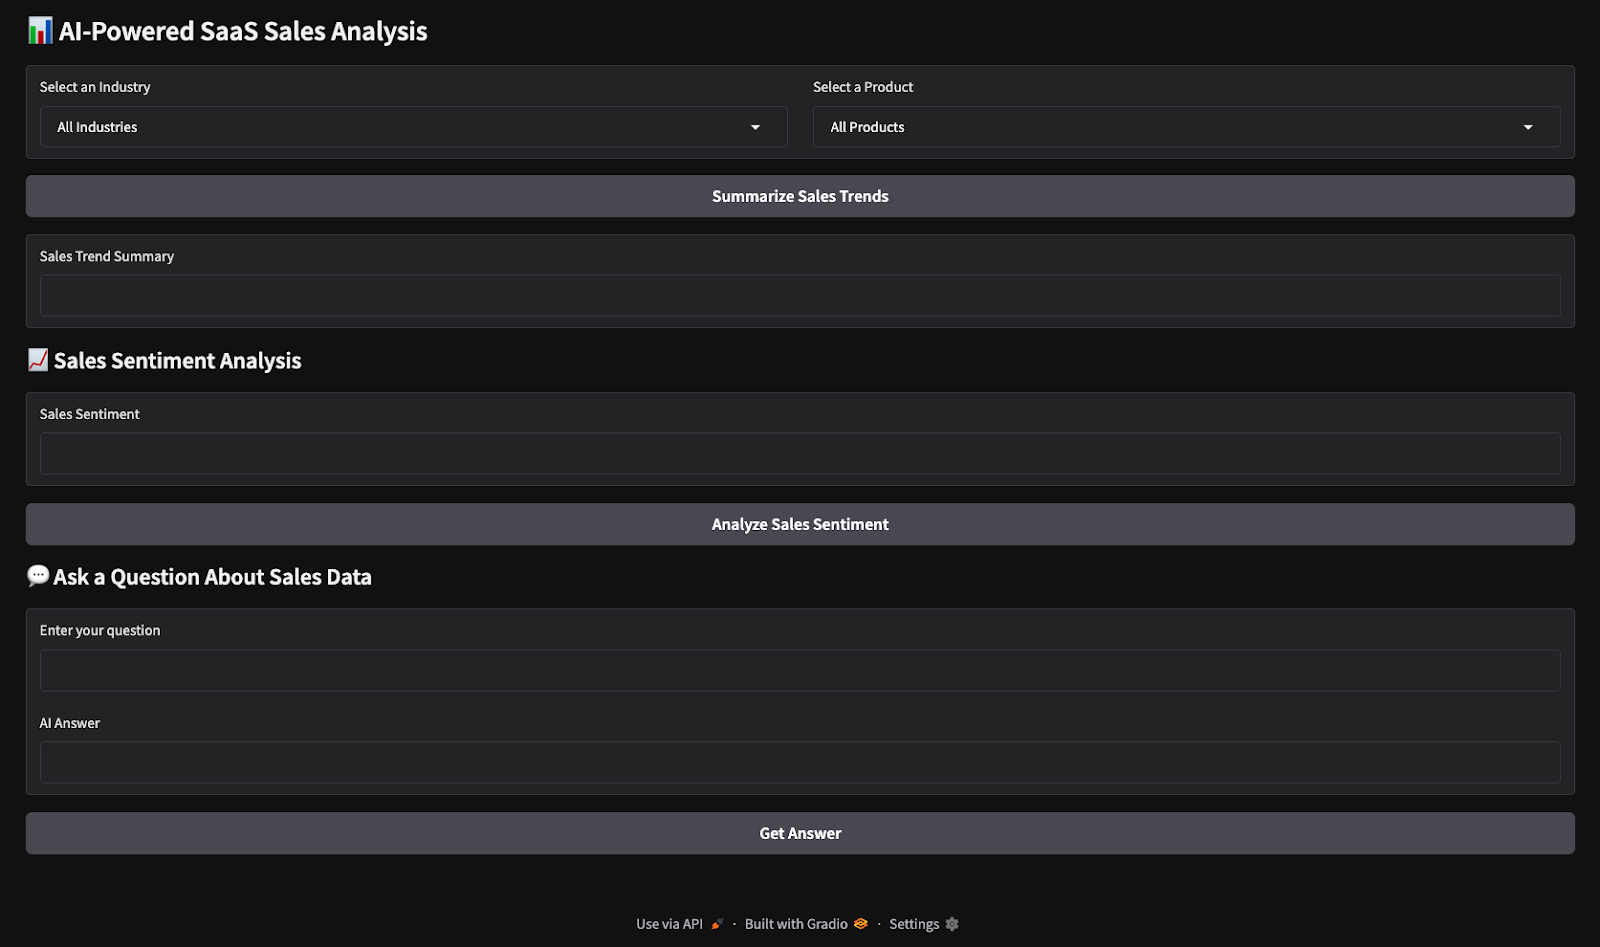
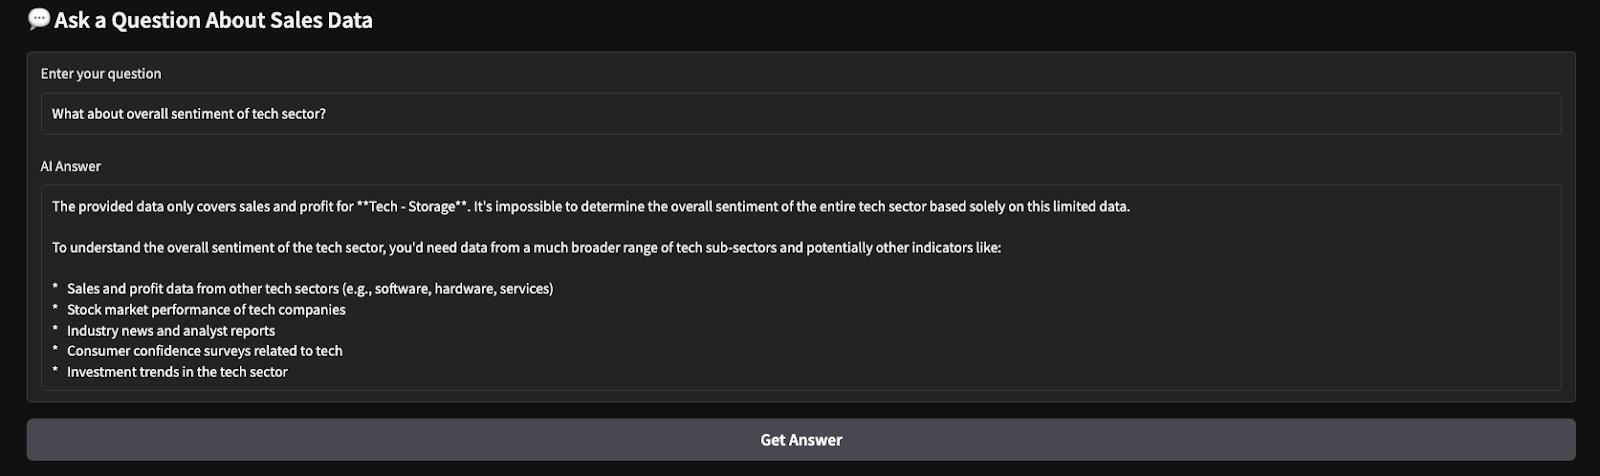
Here are the outputs from a quick test I run. I chose all industries and products, then asked the model to produce a sales summary and do sentiment analysis on the chosen parameters.
In this tutorial, we built an AI-powered SaaS sales insights tool using Gemini 2.0 Flash, enabling real-time analysis of SaaS sales data. We used Gemini 2.0 Flash's large context window to process structured data without RAG and integrated a Gradio-based interactive interface for easy user interaction.
I encourage you to adapt this tutorial to your own use case. To learn more about building apps with Gemini 2.0, I recommend these tutorials:
Learn AI with these courses!
Track
Track
Course
blog
Alex Olteanu
8 min
blog
Stanislav Karzhev
12 min
Tutorial
François Aubry
Tutorial
Abid Ali Awan
Tutorial
Ryan Ong
Tutorial
Ryan Ong