Imagine you are training a machine learning model, but you are not sure how it will perform on new, unseen data. That is where K-Fold Cross-Validation comes in. It offers a sneak peek at how your model might fare in the real world. This technique helps make sure that your predictions are not just a one-hit wonder but consistently reliable across new, unseen datasets.
In this guide, we will unpack the basics of K-Fold Cross-Validation and compare it to simpler methods like the Train-Test Split. You will explore various cross-validation methods using Python and understand why choosing the right one can greatly impact your projects. By the end, you will be equipped to apply these strategies with scikit-Learn.
Let us dive in and learn how to make your machine learning efforts truly dependable!
What is K-Fold Cross-Validation?
K-Fold Cross-Validation is a robust technique used to evaluate the performance of machine learning models. It helps ensure that the model generalizes well to unseen data by using different portions of the dataset for training and testing in multiple iterations.
K-Fold Cross-Validation vs. Train-Test Split
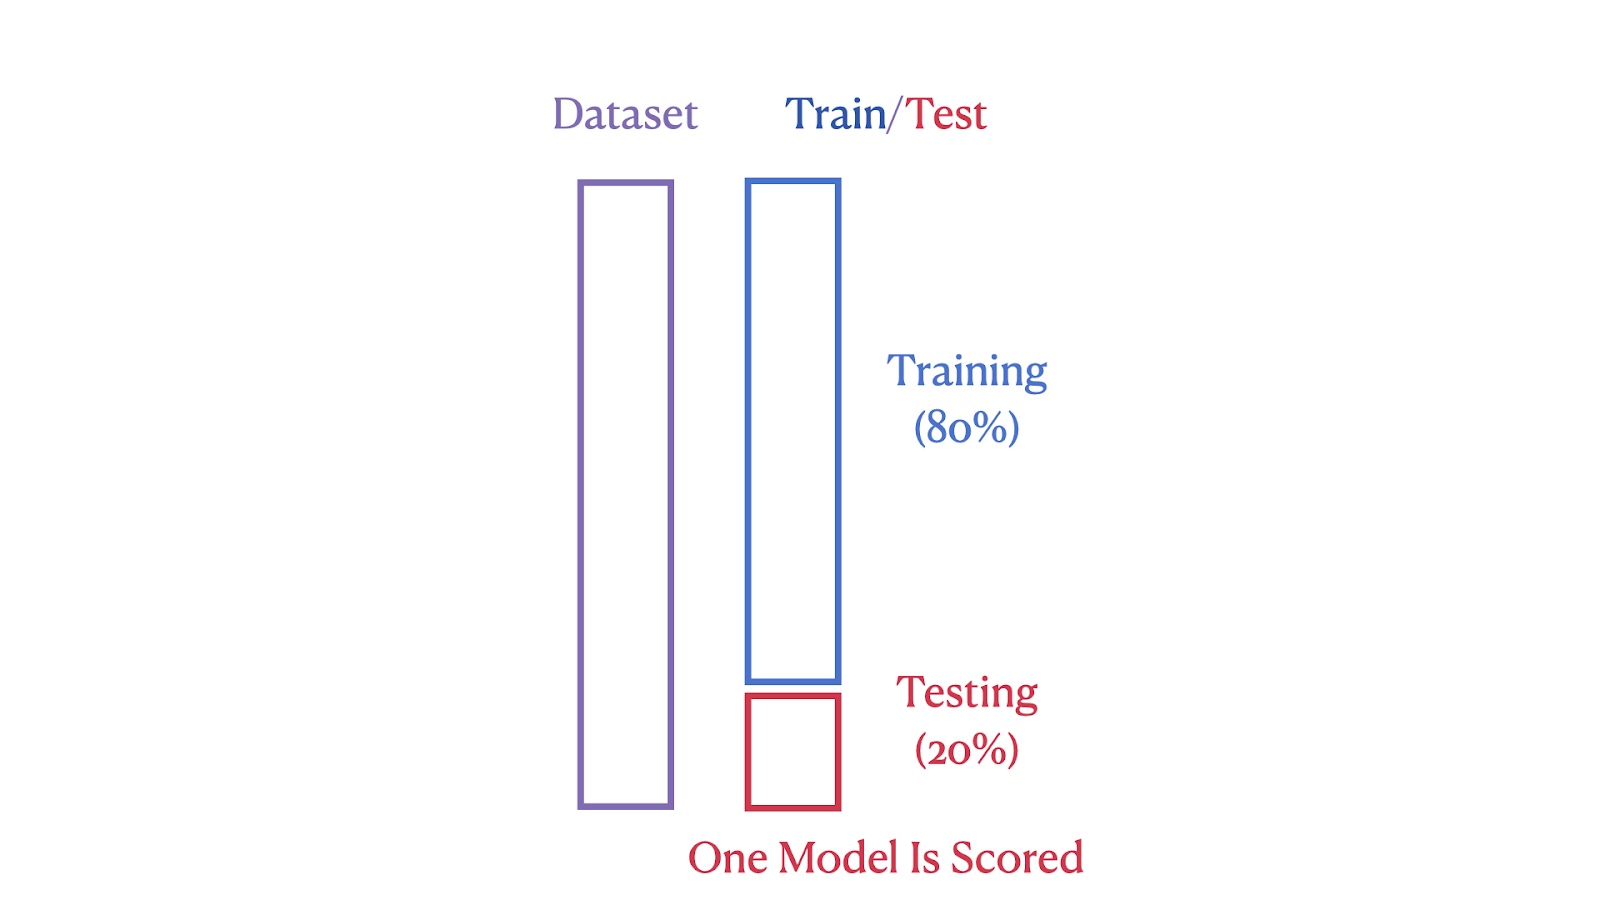
While K-Fold Cross-Validation partitions the dataset into multiple subsets to iteratively train and test the model, the Train-Test Split method divides the dataset into just two parts: one for training and the other for testing. The Train-Test Split method is simple and quick to implement, but the performance estimate can be highly dependent on the specific split, leading to high variance in the results.
The images below illustrate the structural differences between these two methods. The first image shows the Train-Test Split method, where the dataset is divided into 80% training and 20% testing segments.

Train/Test Split Illustration. Image by Author
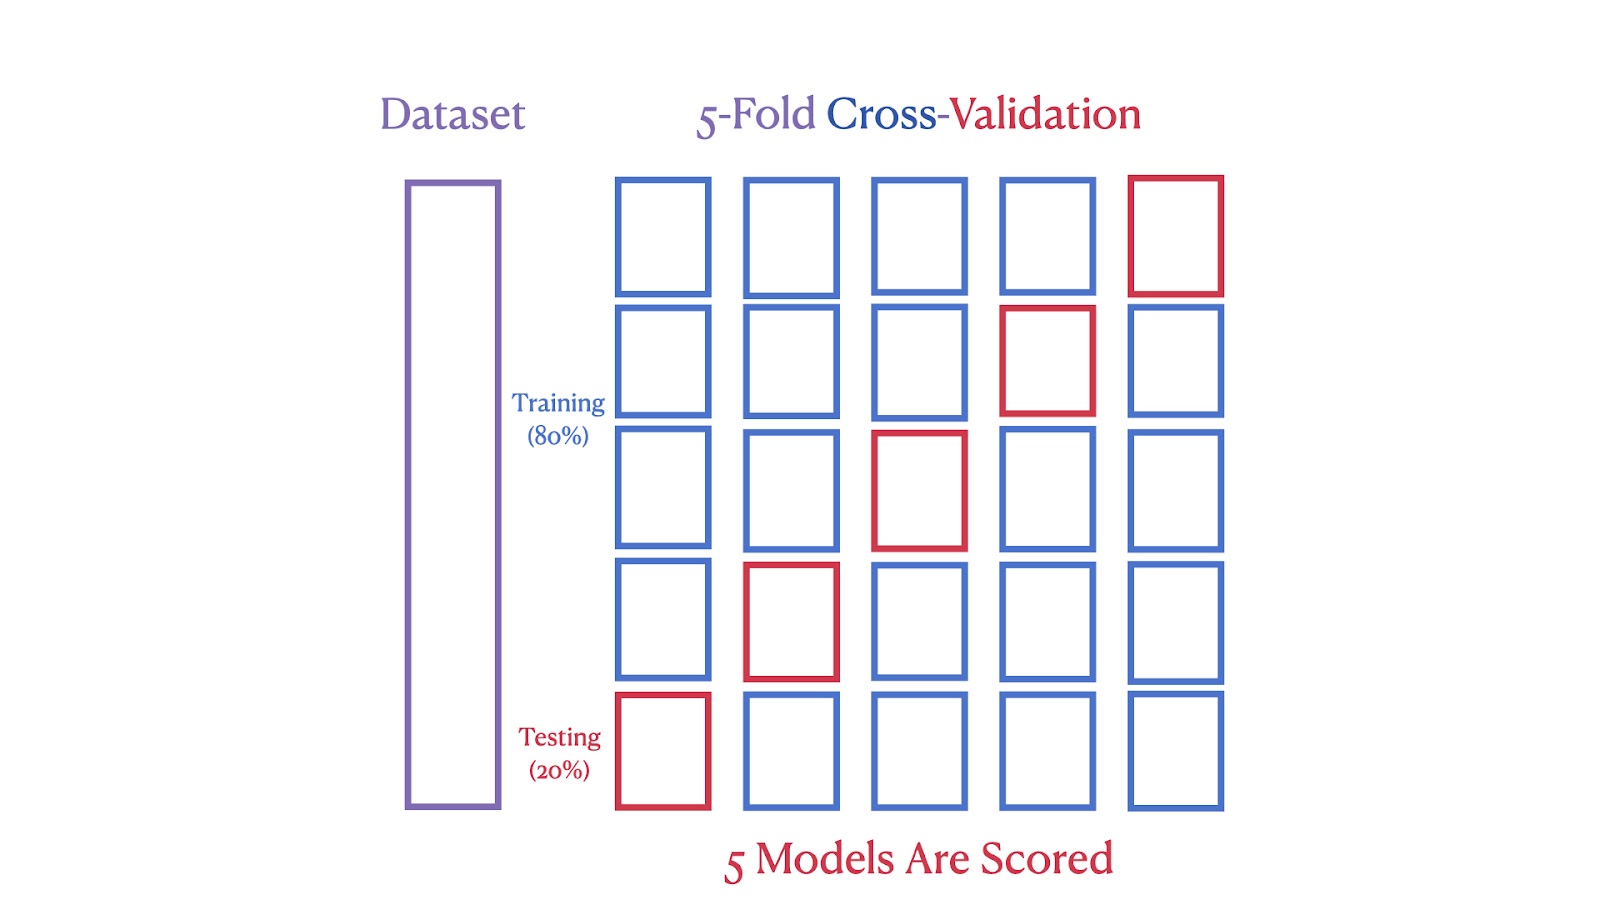
The second image depicts a 5-Fold Cross-Validation, where the dataset is split into five parts, with each part serving as a test set in one of the five iterations, ensuring each segment is used for both training and testing.

5-Fold Cross-Validation Scheme. Image by Author
We can see that K-Fold Cross-Validation provides a more robust and reliable performance estimate because it reduces the impact of data variability. By using multiple training and testing cycles, it minimizes the risk of overfitting to a particular data split. This method also ensures that every data point is used for both training and validation, which results in a more comprehensive evaluation of the model's performance.
Implementing K-Fold Cross-Validation in Python Using scikit-learn
Let’s now demonstrate K-Fold Cross-Validation using the California Housing dataset to assess the performance of a linear regression model. This method provides a robust estimate of model accuracy by iteratively testing on different subsets of the dataset, ensuring a comprehensive evaluation.
Overview of the California Housing dataset
The California Housing Dataset, compiled by Pace and Barry (1997), contains data from the 1990 U.S. Census on housing in California. It includes 20,640 observations with features like location, housing age, and population. The target variable is the median house value for California districts.
The dataset provides a diverse set of geographic, demographic, and economic features, making it well-suited for data science and machine learning applications. We will begin our coding example by downloading it directly from the scikit-Learn library.
Loading the dataset
Before we start with model training and evaluation, we need to load the dataset.
from sklearn.datasets import fetch_california_housing
data = fetch_california_housing()
This code imports the function fetch_california_housing from sklearn.datasets and then calls it to load the California Housing dataset. This dataset is stored in the variable data, which contains both the features and the target variable.
Preparing the data
Once the dataset is loaded, the next step is to prepare the data for analysis.
import pandas as pd
X = pd.DataFrame(data.data, columns=data.feature_names)
y = data.target
Here, we use the pandas library to create a DataFrame X containing the feature data from data.data. The columns of the DataFrame are labeled using data.feature_names. The target variable, representing the median house values, is stored separately in y.
Setting up K-Fold Cross-Validation
Now it’s time to set up our model, including selecting a value for K. Choosing the right value for K is an important step that we will cover in detail below.
from sklearn.model_selection import KFold
k = 5
kf = KFold(n_splits=k, shuffle=True, random_state=42)
This code initializes K-Fold Cross-Validation using the KFold class from sklearn.model_selection. We set up the instance kf with 5 splits. The shuffle=True option randomizes the order of the data points, and the random_state=42 ensures that this shuffling is consistent across multiple runs. This setup is typically sufficient to start evaluating the performance of a model with cross-validation.
Initializing the model
With our data prepared and cross-validation set up, the next step is to choose and initialize the model.
from sklearn.linear_model import LinearRegression
model = LinearRegression()
We import the LinearRegression class from sklearn.linear_model and create an instance model. This model will be used to perform linear regression on the dataset.
Performing cross-validation
Now that the model is initialized, we can move on to the fun part and perform cross-validation to evaluate its performance on different subsets of the data.
from sklearn.model_selection import cross_val_score
scores = cross_val_score(model, X, y, cv=kf, scoring='r2')
This line uses the cross_val_score function to evaluate the model using the dataset X and target y. The cross-validation is conducted using the Kfold instance kf, and the model’s performance is measured using the R² score.
Calculating the average R2 score
We can use R-squared as a metric to evaluate the proportion of variance in the dependent variable that is predictable from the independent variables, providing insight into the goodness of fit of the regression model.
import numpy as np

average_r2 = np.mean(scores)

print(f"R² Score for each fold: {[round(score, 4) for score in scores]}")
print(f"Average R² across {k} folds: {average_r2:.2f}")
This part calculates the average R² score for all folds. The scores for each fold are printed first, followed by the average score. The use of np.mean() computes the mean of the scores collected during the cross-validation.
Displaying the final results
We now aggregate the results to get a comprehensive understanding of the model's performance. The average R² score provides a single metric indicating the model's effectiveness.
R² Score for each fold: [0.5758, 0.6137, 0.6086, 0.6213, 0.5875]
Average R² across 5 folds: 0.60
This is the output of the code from the previous step. It shows the R² scores for each fold and the average R² score.
What Does ‘K’ Represent in K-Fold Cross-Validation?
In K-Fold Cross-Validation, ‘K’ represents the number of groups into which the dataset is divided. This number determines how many rounds of testing the model undergoes, ensuring each segment is used as a testing set once.
Here is a heuristic:
- K = 2 or 3: These choices can be beneficial when computational resources are limited or when a quicker evaluation is needed. They reduce the number of training cycles, thus saving time and computational power while still providing a reasonable estimate of model performance.
- K = 5 or 10: Choosing K = 5 or K = 10 are popular choices because they provide a good balance between computational efficiency and model performance estimation.
- K = 20: Using a larger value of K can provide a more detailed performance evaluation. However, it increases the computational burden and might result in higher variance if the subsets are too small.
For more on model performance estimation, consider taking our comprehensive Model Validation in Python course.
Key Considerations When Using K-Fold Cross-Validation
The impact of 'K' in K-Fold Cross-Validation
The number of folds, or 'K', in K-Fold Cross-Validation affects both the granularity of the validation process and the computational load. A smaller K (e.g., 3-5) might be faster but could yield less reliable estimates as each fold represents a larger portion of the dataset, potentially missing out on diverse data scenarios. A larger K (e.g., 10) provides a more detailed evaluation at the cost of increased computation. A common starting point is K=5 or K=10, which are often enough to get a reliable estimate without excessive computation.
Importance of shuffling data in K-Fold Cross-Validation
Shuffling the data in K-Fold Cross-Validation is highly recommended to enhance the validity of model evaluation. By setting shuffle=True, shuffling breaks any inherent order in the dataset that could introduce bias during the validation process. This ensures that each fold is representative of the entire dataset, which is crucial for assessing how well the model generalizes to new data. However, it’s important to avoid shuffling in cases where the sequence of data points is meaningful, such as with time-series data, to preserve the integrity of the learning process.
Ensuring reproducibility in K-Fold Cross-Validation
Ensuring that the results of K-Fold Cross-Validation are reproducible is crucial for verifying model stability and performance. This can be achieved by setting the random_state parameter, which ensures consistent shuffling of data across different runs, allowing for identical data splits and thus, reproducible results.
Standard K-Fold vs. Other Cross-Validation Methods
Choosing the right cross-validation technique is crucial in building reliable machine learning models. The choice depends heavily on the specific characteristics of the dataset and the type of machine learning task at hand. Different techniques are designed to handle various challenges like imbalanced data or grouped data structures.
The table below provides a comprehensive comparison of the most popular various cross-validation methods, highlighting their unique features and best use cases to guide you in selecting the most effective technique for your specific modeling needs.
| Type of CV | Usage | Description | When to Use |
|---|---|---|---|
| Standard K-Fold Cross-Validation | Both regression and classification | Splits the dataset into k equal-sized folds. Each fold is used once as a test set. | Best for balanced datasets to ensure comprehensive model evaluation. |
| Stratified K-Fold Cross-Validation | Primarily classification | Maintains the same proportion of class labels in each fold as the original dataset. | Great for classification tasks with imbalanced classes to maintain group proportions. |
| Leave-One-Out Cross-Validation (LOOCV) | Both regression and classification | Each data point is used once as a test set, with the rest as training. | Great for small datasets to maximize training data, though computationally intensive. |
| Leave-P-Out Cross-Validation | Both regression and classification | Similar to LOOCV, but leaves out p data points for the test set. | Ideal for small datasets to test how changes in the data samples affect model stability. |
| Group K-Fold Cross-Validation | Both regression and classification with groups | Ensures no group is in both training and test sets, which is useful when data points are not independent. | Great for datasets with logical groupings to test performance on independent groups. |
| Stratified Group K-Fold Cross-Validation | Primarily classification with grouped data | Combines stratification and group integrity, ensuring that groups are not split across folds. | Great for grouped and imbalanced datasets to maintain both class and group integrity. |
Conclusion
This guide has shown you how K-Fold Cross-Validation is a powerful tool for evaluating machine learning models. It's better than the simple Train-Test Split because it tests the model on various parts of your data, helping you trust that it will work well on unseen data too.
If you’re diving into machine learning, here are some great resources to help you along:
- DataCamp's Supervised Learning with Scikit-Learn Course: This course helps you get to grips with predictive modeling. It's hands-on and practical, ideal for starting your journey. Check out the course here.
- Machine Learning with Python Tutorial: This tutorial breaks down key machine learning ideas and shows you how to apply them. It's perfect for solidifying what you know. Read the tutorial here.
- Scikit-Learn Cheat Sheet: Keep this cheat sheet handy. It's perfect for a quick reminder of how to use machine learning functions when you're working on projects. Get the cheat sheet here.
- DataCamp's Kaggle Competition Course: If you want to put your skills to the test, this course is great. It teaches you how to shine in Kaggle competitions, where you can apply what you've learned in a fun, competitive way. Start the course here.
These resources are here to guide you, whether you are just starting out or looking to brush up on your skills. They offer a mix of theory and practical tips, making sure you are well-prepared to build and refine accurate models.
Frequently Asked Questions
How do you interpret the cross-validation scores obtained from K-Fold Cross-Validation?
The cross-validation scores provide an estimate of the model's performance on unseen data. A higher average score across the folds indicates better generalization. However, it's important to also consider the variance of the scores across folds. High variance suggests the model's performance is sensitive to the specific data split, which may indicate overfitting or the need for more data. Aim for a high average score with low variance for a robust and reliable model.
Can you use K-Fold Cross-Validation for time series data?
Standard K-Fold Cross-Validation assumes the data is independently and identically distributed, which is violated in time series due to temporal dependencies. For time series, you should use techniques like Time Series Split or forward chaining where the training set only includes data points that occurred before the test set.
What are some common pitfalls to avoid when setting up K-Fold Cross-Validation?
Some common pitfalls include not shuffling the data, which can introduce bias if the dataset has an inherent order, and ignoring the randomness in fold assignments, which can lead to variations in model performance across different runs. Ensuring that the data is shuffled (where appropriate) and setting a fixed random_state for reproducibility are key practices to avoid these issues.
Can K-Fold Cross-Validation be used for unsupervised learning tasks?
While K-Fold Cross-Validation is most commonly used for supervised learning to estimate predictive performance, it can be adapted for some unsupervised tasks like clustering by evaluating the stability of cluster assignments across folds. However, it's not as straightforward as in supervised settings.
How does K-Fold Cross-Validation handle datasets with multiple feature scales?
K-Fold Cross-Validation itself does not handle multiple feature scales directly. It's important to preprocess the dataset, typically using normalization or standardization, before applying K-Fold Cross-Validation. This ensures that features with larger scales do not dominate the model's learning process, leading to more generalizable and fair model evaluation.
As an adept professional in Data Science, Machine Learning, and Generative AI, Vinod dedicates himself to sharing knowledge and empowering aspiring data scientists to succeed in this dynamic field.


