
Course
Designing Agentic Systems with LangChain
3 hr
12.2K
LangManus is an open-source, community-driven AI automation framework designed to build structured, multi-agent systems using language models. With LangManus, you can build intelligent agents that combine planning, research, coding, browser interaction, and reporting into a single cohesive pipeline.
In this tutorial, I’ll guide you to build a working demo with LangManus that:
LangManus’s architecture supports fine-grained control, auditability, and extensibility. It builds upon powerful tools like:
With LangManus, you can build intelligent agents that combine planning, research, coding, browser interaction, and reporting into a single cohesive pipeline powered by:
YAML or .env-based configuration for models and keys.The app we’ll be building is an interactive assistant that uses LangManus’s multi-agent capabilities to analyze a trending GitHub repository. To set up LangManus Agents, we need a multiple-file structure where each file plays a distinct role in the multi-agent system:
Let’s implement these one by one.
Before we start, let’s ensure that we have the following tools and libraries installed:
python3 --version  # Python 3.8+
pip install requests beautifulsoup4 matplotlib streamlit
Check the Python version, which should be at least 3.8 or more. Then, simply install all the other dependencies mentioned above. You’ll also need a GitHub API token to avoid rate limits and set it as an environment variable using the terminal.
To generate GitHub tokens:
Now, run the following command:
export GITHUB_TOKEN=your_personal_token_hereNow we have all the dependencies installed, let’s build the planner and agent controller for our application.
The planner.py file defines a simple 4-step plan to cover each required task, such as research, browse, analyze, and report.
def plan_task(user_query):
    return [
        {'agent': 'researcher', 'task': 'Find trending repo'},
        {'agent': 'browser', 'task': 'Scrape GitHub activity'},
        {'agent': 'coder', 'task': 'Analyze recent commits and features'},
        {'agent': 'reporter', 'task': 'Generate Markdown report'}
    ]
The above function returns a step-by-step task plan for the system where each step:
The agent file defines the core LangManusAgent class, which orchestrates all agents and maintains a shared context as they perform their tasks.
from planner import plan_task
from agents.researcher import find_trending_repo
from agents.browser import scrape_github_activity
from agents.coder import analyze_code_activity
from agents.reporter import generate_report
class LangManusAgent:
    def __init__(self, task):
        self.task = task
        self.context = {}
    def run(self):
        steps = plan_task(self.task)
        for step in steps:
            agent = step['agent']
            task = step['task']
            if agent == 'researcher':
                self.context['repo'] = find_trending_repo()
            elif agent == 'browser':
                self.context['repo_data'] = scrape_github_activity(self.context['repo'])
            elif agent == 'coder':
                self.context['analysis'], self.context['chart_path'] = analyze_code_activity(self.context['repo_data'])
            elif agent == 'reporter':
                report = generate_report(
                    self.context['repo'],
                    self.context['repo_data'],
                    self.context['analysis'],
                    self.context['chart_path']
                )
                print(report)
    def run_and_return(self):
        self.run()
        report = generate_report(
            self.context['repo'],
            self.context['repo_data'],
            self.context['analysis'],
            self.context['chart_path']
        )
        return report, self.context['chart_path']
The code begins by calling the plan_task() function to retrieve a list of steps (defined in planner.py). Then, it runs each step by invoking the appropriate specialized agent in the following order:
Each agent stores its results in the context dictionary, allowing the downstream agents to access and build upon the prior outputs.
Now we have the core functions ready, let’s build the agents for our application.
This agent identifies a popular open-source Python project from GitHub by scraping the GitHub Trending page.
import requests
from bs4 import BeautifulSoup
def find_trending_repo():
    url = "https://github.com/trending/python"
    res = requests.get(url)
    soup = BeautifulSoup(res.text, 'html.parser')
    repo = soup.select_one('article h2 a')['href'].strip()
    return f"https://github.com{repo}"
Here’s how it works:
The browser agent is used for fetching the recent activity from the selected GitHub repository. It uses the GitHub REST API to gather commit history and metadata.
import requests
import os
def scrape_github_activity(repo_url):
    token = os.getenv("GITHUB_TOKEN")  # Set via environment or .env
    headers = {"Authorization": f"Bearer {token}"} if token else {}
    user_repo = "/".join(repo_url.split('/')[-2:])
    api_url = f"https://api.github.com/repos/{user_repo}/commits"
    res = requests.get(api_url, headers=headers)
    res.raise_for_status()
    data = res.json()
    commits = []
    commit_dates = []
    for item in data[:20]:  # optional: increase window for better activity chart
        message = item['commit']['message']
        author = item['commit']['author']['name']
        date = item['commit']['author']['date']
        sha = item['sha'][:7]
        commits.append(f"[{sha}] {message} — {author} @ {date}")
        commit_dates.append(date)  # in ISO 8601 format (perfect for parsing)
    return {
        'repo_url': repo_url,
        'commits': commits,
        'commit_dates': commit_dates
    }
Here's what the above function does:
commits and commit_dates. This agent processes and analyzes the commit history collected from GitHub and generates both a textual summary and visual insights using matplotlib.
# agents/coder.py
import matplotlib.pyplot as plt
from collections import defaultdict, Counter
from datetime import datetime
import matplotlib.dates as mdates
import re
import os
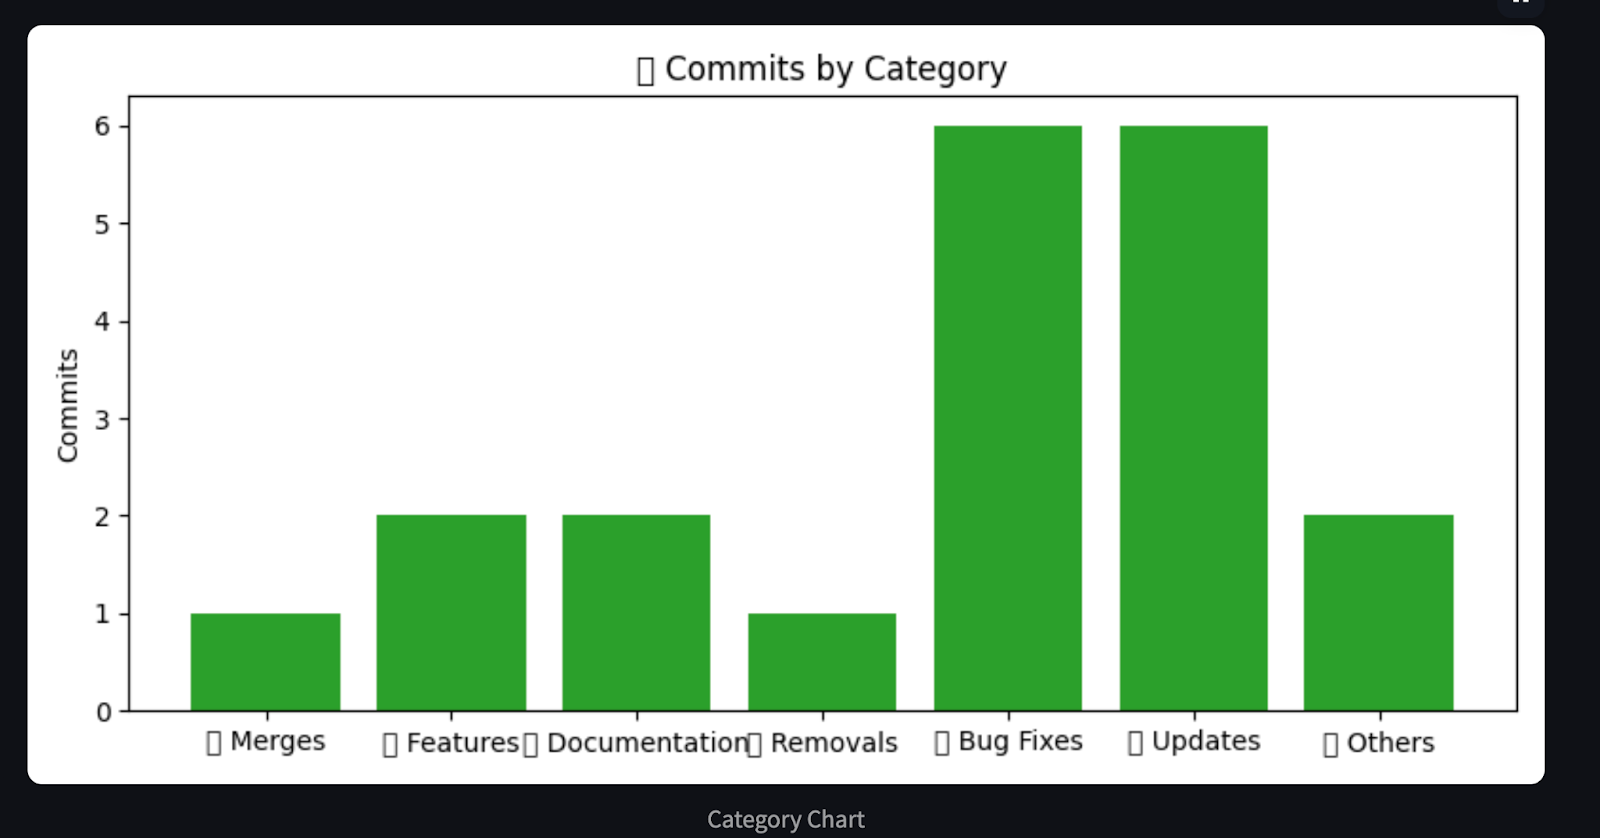
def categorize_commit(message):
message = message.lower()
if any(kw in message for kw in ["fix", "bug"]):
return "🐛 Bug Fixes"
elif any(kw in message for kw in ["add", "feature", "implement"]):
return "✨ Features"
elif any(kw in message for kw in ["doc", "readme"]):
return "📄 Documentation"
elif any(kw in message for kw in ["remove", "delete"]):
return "🔥 Removals"
elif any(kw in message for kw in ["update", "upgrade"]):
return "🔧 Updates"
elif any(kw in message for kw in ["merge", "pull"]):
return "🔀 Merges"
else:
return "📦 Others"
def analyze_code_activity(repo_data):
commit_messages = repo_data['commits']
commit_dates = repo_data.get('commit_dates', [])
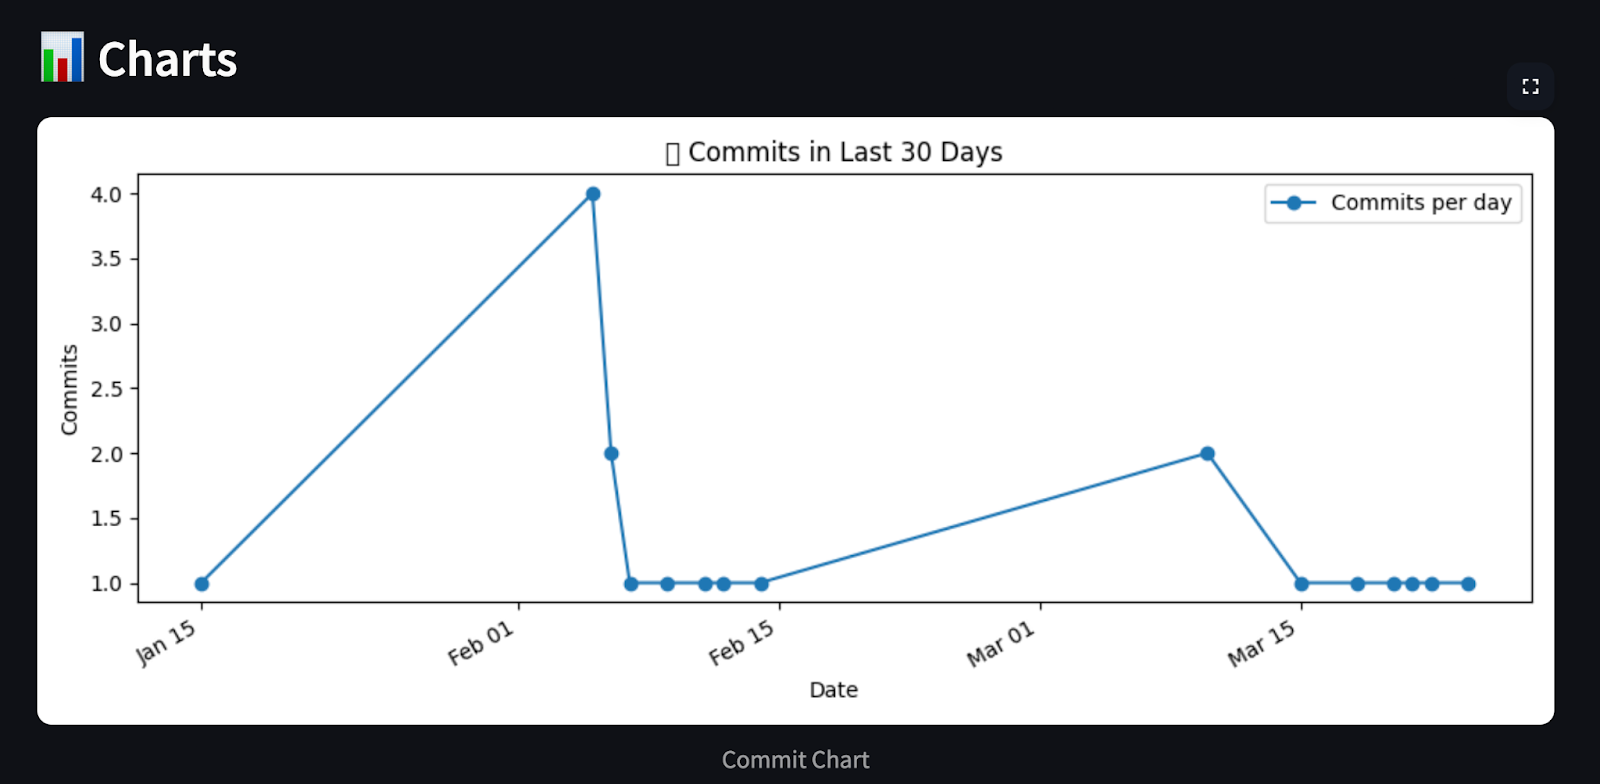
# Chart 1: Commits per day (last 30 days)
commit_day_counts = defaultdict(int)
for date in commit_dates:
day = datetime.fromisoformat(date).date()
commit_day_counts[day] += 1
recent_days = sorted(commit_day_counts.keys())
counts = [commit_day_counts[day] for day in recent_days]
plt.figure(figsize=(10, 4))
plt.plot(recent_days, counts, marker='o', linestyle='-', color='tab:blue', label='Commits per day')
plt.gca().xaxis.set_major_formatter(mdates.DateFormatter('%b %d'))
plt.gcf().autofmt_xdate()
plt.xlabel("Date")
plt.ylabel("Commits")
plt.title("📈 Commits in Last 30 Days")
plt.legend()
path1 = "commit_chart.png"
plt.tight_layout()
plt.savefig(path1)
plt.close()
# Chart 2: Commits per category
commit_categories = defaultdict(list)
category_counter = Counter()
for msg in commit_messages:
short_msg = re.split(r'—|@', msg)[0].strip()
category = categorize_commit(short_msg)
commit_categories[category].append(short_msg)
category_counter[category] += 1
plt.figure(figsize=(8, 4))
cats, values = zip(*category_counter.items())
plt.bar(cats, values, color='tab:green')
plt.ylabel("Commits")
plt.title("🧩 Commits by Category")
path2 = "category_chart.png"
plt.tight_layout()
plt.savefig(path2)
plt.close()
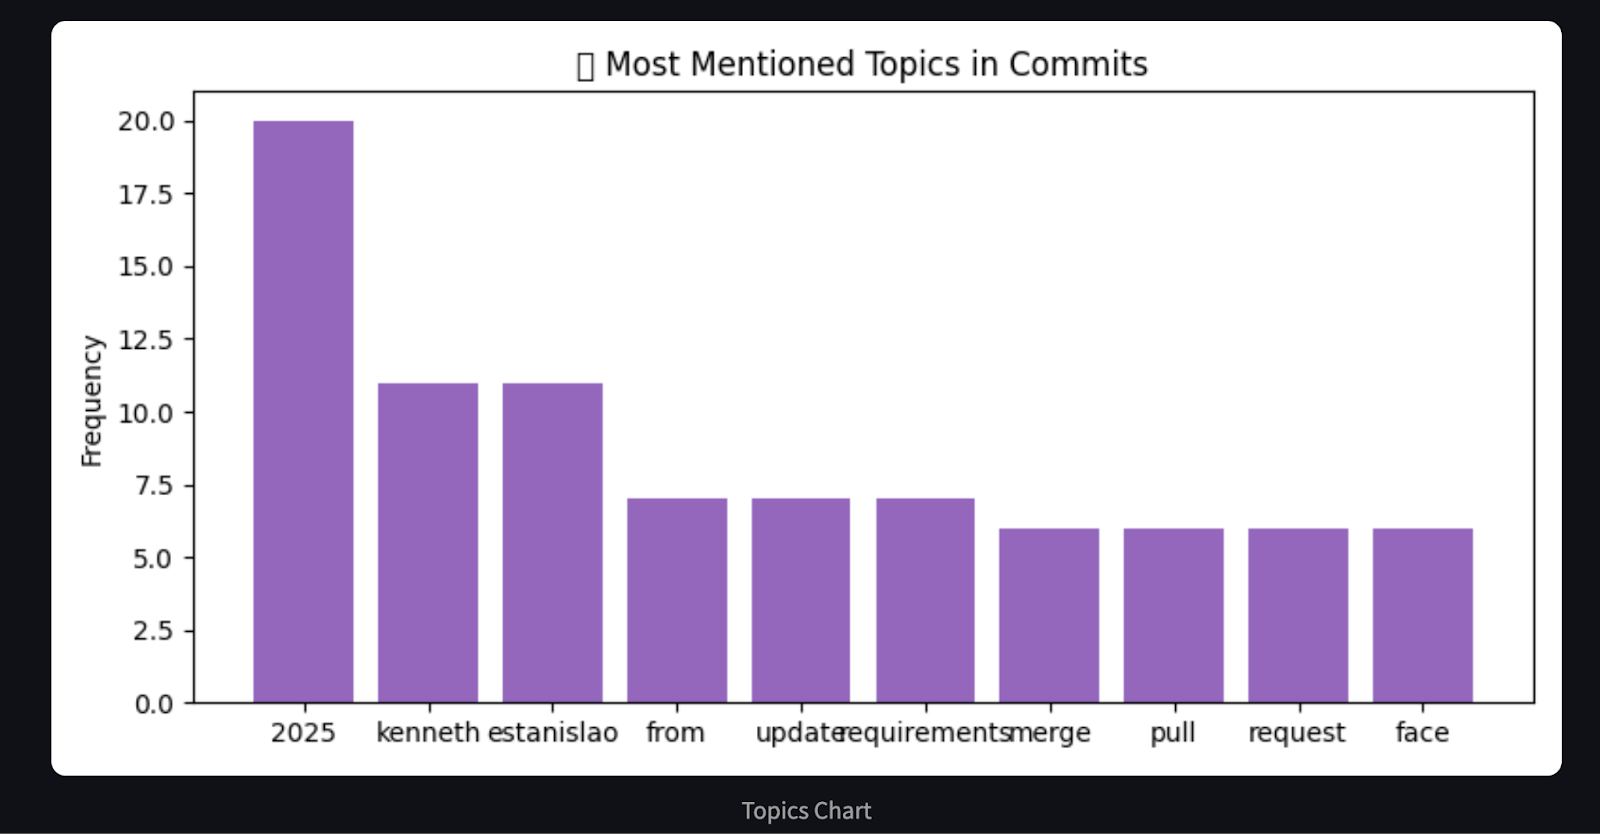
# Chart 3: Word frequency in commit messages (basic proxy for hot areas)
word_freq = Counter()
for msg in commit_messages:
words = re.findall(r'\b\w{4,}\b', msg.lower()) # only words with length >= 4
word_freq.update(words)
most_common = word_freq.most_common(10)
labels, freqs = zip(*most_common)
plt.figure(figsize=(8, 4))
plt.bar(labels, freqs, color='tab:purple')
plt.ylabel("Frequency")
plt.title("🔥 Most Mentioned Topics in Commits")
path3 = "topics_chart.png"
plt.tight_layout()
plt.savefig(path3)
plt.close()
# Build markdown report
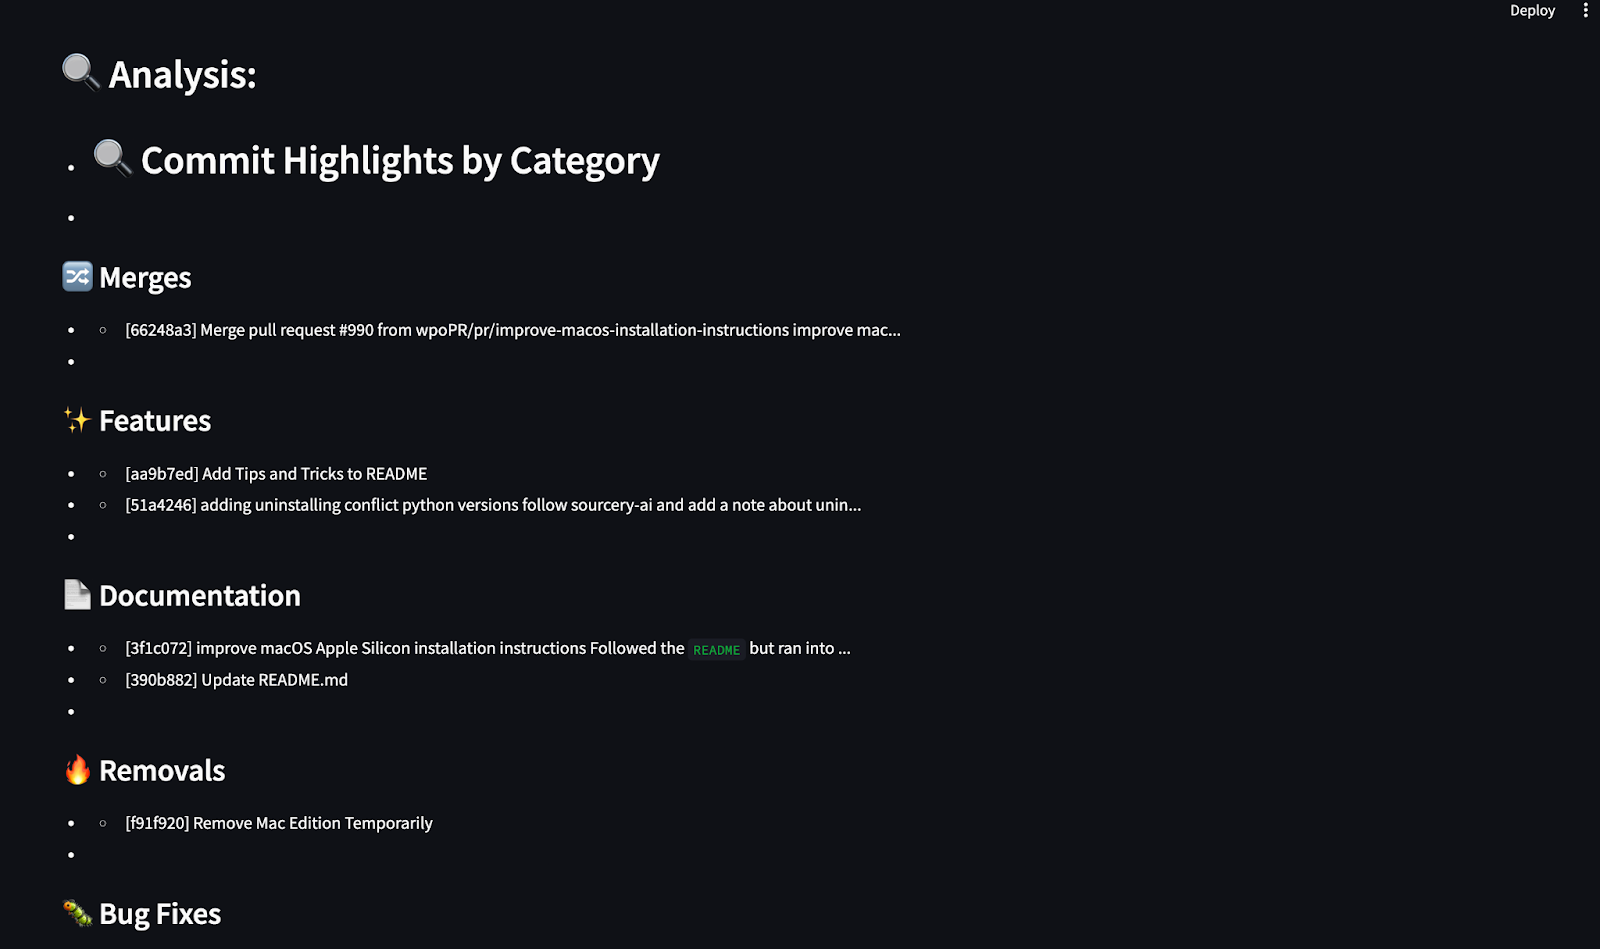
analysis = ["## 🔍 Commit Highlights by Category"]
for cat, msgs in commit_categories.items():
analysis.append(f"\n### {cat}")
for m in msgs[:3]:
clean_msg = m.replace("\n", " ").strip()
analysis.append(f"- {clean_msg[:100]}{'...' if len(clean_msg) > 100 else ''}")
charts = [path1, path2, path3]
return analysis, chartsThis agent processes the GitHub commit history and generates a Markdown summary and visual charts using matplotlib. It categorizes commits into pre-defined groups like bug fixes, features, documentation, and more using keyword matching. It then uses matplotlib to generate three insightful charts showing:
Finally, the agent creates a markdown summary highlighting key commits in each category and returns both the summary and chart paths for rendering in the report.
The reporter agent generates the final Markdown report that combines:
def generate_report(repo_url, repo_data, analysis, chart_path):
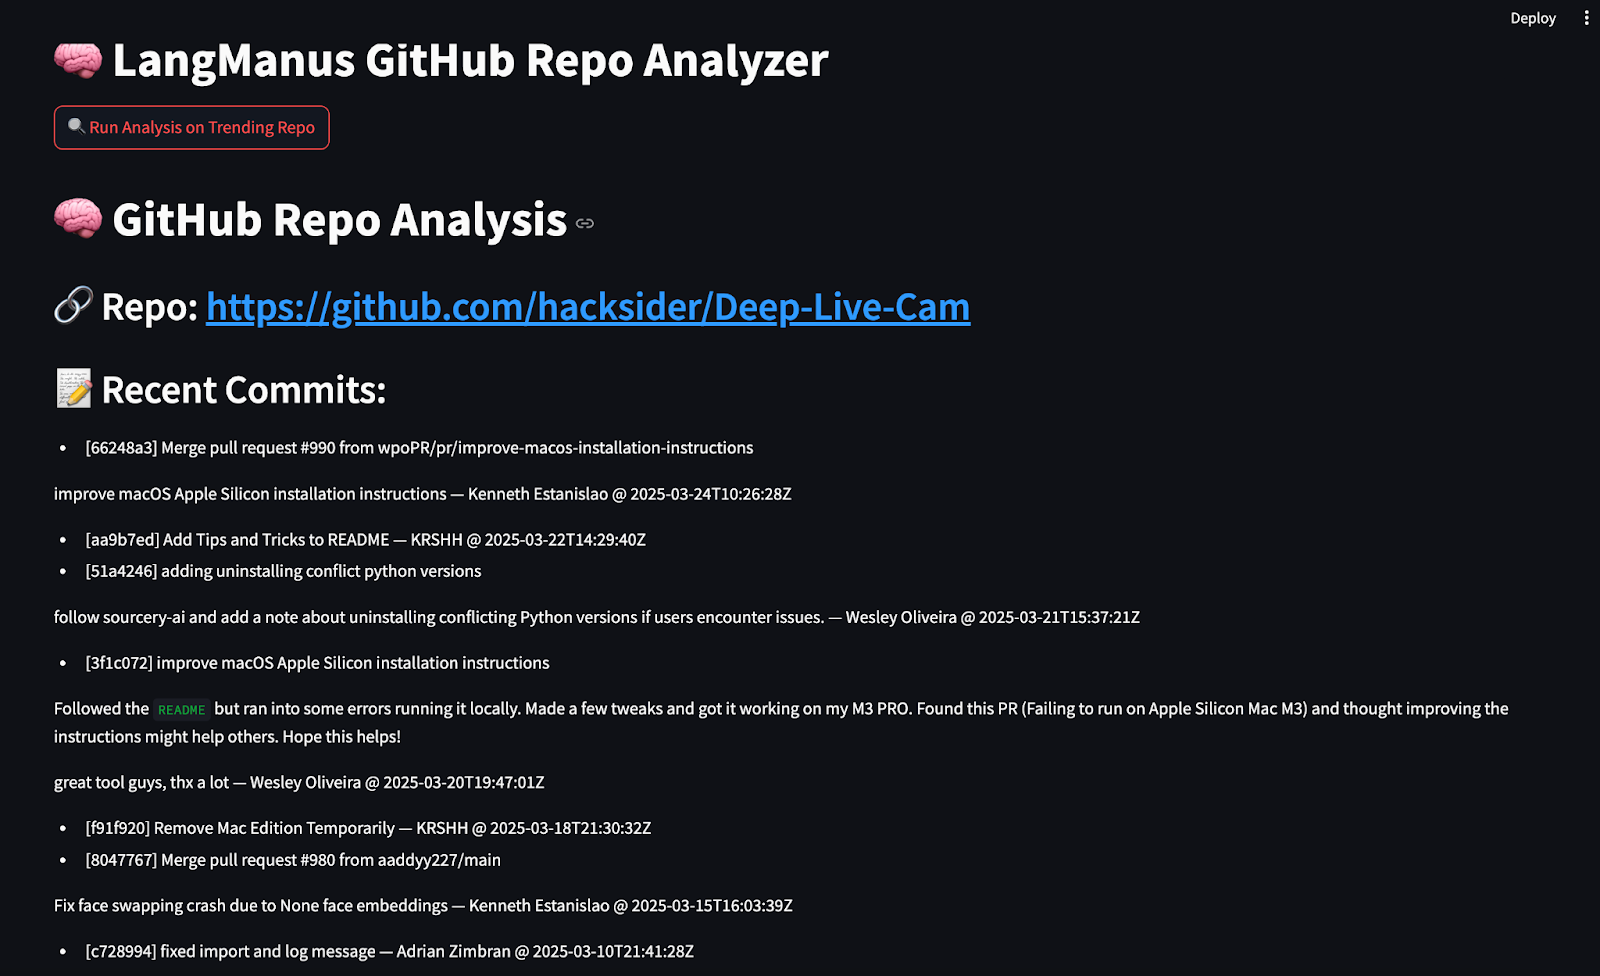
md = f"""# 🧠 GitHub Repo Analysis
## 🔗 Repo: [{repo_url}]({repo_url})
## 📝 Recent Commits:
"""
for c in repo_data['commits']:
md += f"- {c}\n"
md += "\n## 🔍 Analysis:\n"
for line in analysis:
md += f"- {line}\n"
return mdThe generate_report() function assembles the final Markdown report using the GitHub URL, commit data, categorized analysis, and chart paths. It returns a single markdown-formatted string that can be displayed in the terminal or rendered in a UI like Streamlit. It returns a single markdown-formatted string that can be printed to the console or rendered in Streamlit.
The Streamlit app allows users to run the entire pipeline with a single click. Create a streamlit_app.py file and add the following code:
import streamlit as st
from agent import LangManusAgent
import os
from PIL import Image
st.set_page_config(page_title="LangManus GitHub Analyzer", layout="wide")
st.title("🧠 LangManus GitHub Repo Analyzer")
if st.button("🔍 Run Analysis on Trending Repo"):
    with st.spinner("Running LangManus agents..."):
        agent = LangManusAgent(task="Find a popular open-source project updated recently and summarize its new features with examples and charts.")
        report, chart_paths = agent.run_and_return()
        st.markdown(report)
        st.subheader("📊 Charts")
        for path in chart_paths:
            if os.path.exists(path):
                st.image(Image.open(path), caption=os.path.basename(path).replace('_', ' ').replace('.png', '').title(), use_container_width=True)
else:
    st.info("Click the button to run analysis on a trending GitHub Python repo.")
Here's what the code does:
streamlit library to create a minimal dashboard such that on clicking the analyse the button, it triggers LangManusAgent.run_and_return() function.st.markdown() function and loops through each chart path, and then it renders them using the st.image() function.The final structure of our LangManus-powered GitHub analysis project should look like this:
LangManus-GitHub-Demo/
├── main.py
├── agent.py
├── planner.py
├── streamlit_app.py
├── agents/
│   ├── researcher.py
│   ├── browser.py
│   ├── coder.py
│   └── reporter.py
├── commit_chart.png
├── category_chart.png
├── topics_chart.pngNow we have all the components in place, let’s run our Streamlit application. Run the following command in the terminal:
streamlit run streamlit_app.py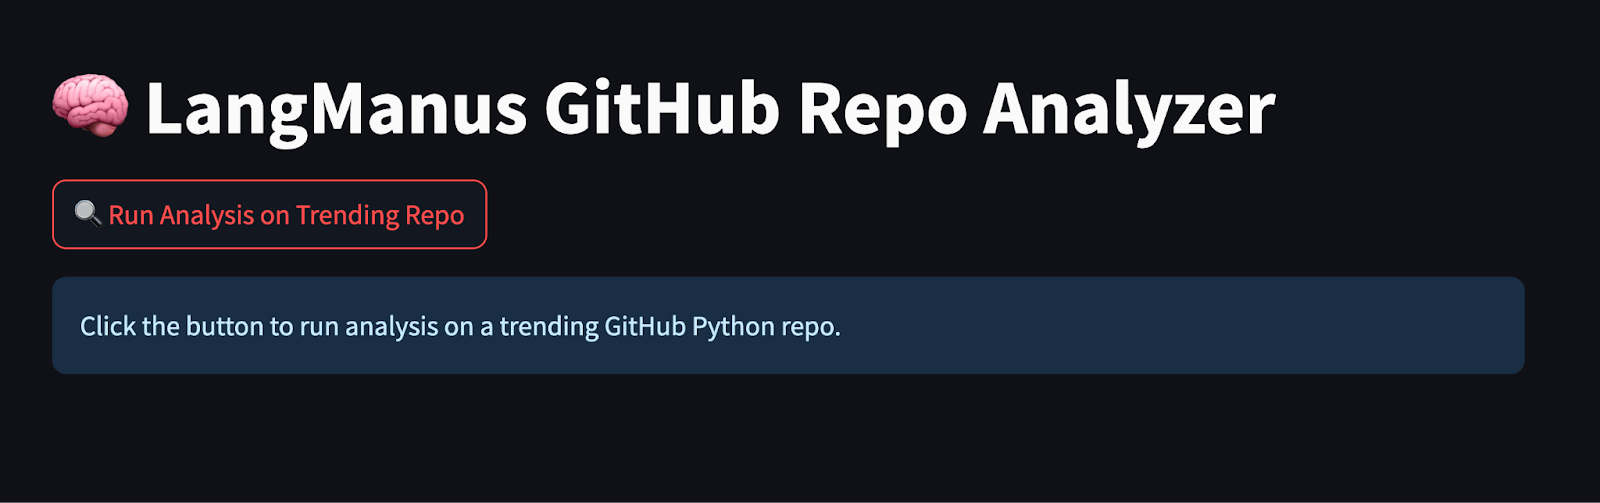
Click the "Run Analysis on Trending Repo" button in your browser, and your LangManus-powered agents will fetch, analyze, and present GitHub repository insights in seconds.
LangManus enables us to build structured multi-agent systems that interact with real-world data. In this guide, we created a fully automated GitHub repo analyzer where we:
LangManus has serious potential for building research agents, dashboards, and data-driven assistants.
Learn AI with these courses!
Course
Course
Course
blog
Alex Olteanu
8 min
Tutorial
François Aubry
Tutorial
Aashi Dutt
Tutorial
Aashi Dutt
Tutorial
Abid Ali Awan
code-along
Korey Stegared-Pace