Course
Time is a fundamental dimension in data analysis. Over time, values can fluctuate, trend, or hold steady. When we analyze how data evolves over time, we're working with time series.
A common task in time series analysis is adjusting the frequency of dates and times within our data, a technique known as resampling. In this tutorial, we'll leverage Pandas, a library with robust tools for intuitive and efficient time series manipulation.
We'll start with the basics and gradually progress to more advanced resampling techniques. We'll provide practical examples and share best practices to ensure our time series analysis is effective and performant.
If you want to learn more about time series, check out this course on manipulating series data in Python.
What Is Time Series Resampling?
Similar to how we can group data by category, resampling lets us group data into different time intervals. This is valuable for both data cleaning and in-depth time series analysis. For instance, we might need to align two time series to a common frequency before comparing them.
There are two primary types of resampling:
- Upsampling: Increasing the frequency of our data (e.g., from yearly to monthly). This creates new time points that need to be filled or interpolated.
- Downsampling: Decreasing the frequency (e.g., from monthly to yearly). This involves aggregating data points within the new, larger time intervals.
Resampling Using Pandas asfreq() Method
We can perform resampling with pandas using two main methods: .asfreq() and .resample().
To start using these methods, we first have to import the pandas library using the conventional pd alias. We’ll also import matplotlib to visualize the results.
import pandas as pd
import matplotlib.pyplot as plt
Let's begin with the .asfreq() method. This method converts a time series to a specified frequency, returning the original data aligned with a new index at that frequency.
We'll work with a dataset containing daily temperature readings in Madrid from 1997 to 2015. Let's start with some preprocessing steps before diving into resampling.
url = 'https://raw.githubusercontent.com/jcanalesluna/courses_materials/master/datasets/Madrid%20Daily%20Weather%201997-2015.csv'
df = pd.read_csv(url, usecols=['CET', 'Max TemperatureC', 'Mean TemperatureC', 'Min TemperatureC'])

# Change column names
df.columns = ['time', 'max_temp', 'mean_temp', 'min_temp']

# Convert string column to datetime
df['time'] = pd.to_datetime(df['time'])

# Set time column as index
df = df.set_index('time')

df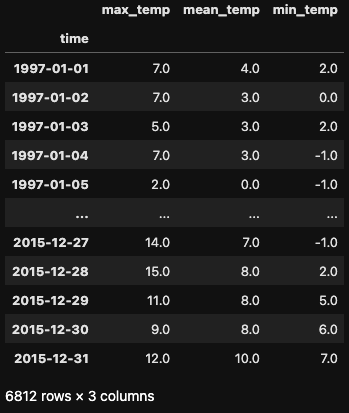
Upsampling with asfreq()
To illustrate upsampling, imagine we want to convert our daily temperature readings into hourly ones. We can achieve this using the .asfreq() method with the parameter freq='H'.
df_hour = df.asfreq('H')
df_hour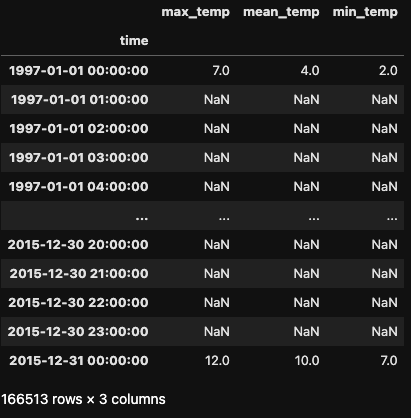
The resulting dataset is notably larger, as new rows have been created with hourly data instead of daily. By default, .asfreq() takes the first entry in the original index and populates the remaining hours with null values.
The resulting dataset is considerably bigger, for new rows have been created with hourly data instead of daily data. By default, .asfreq() takes the first entry in the original index and creates null values for the remaining hours.
Pandas offers three strategies to fill these null values:
- Forward fill (
ffill): Propagates the last valid observation forward. - Backfill (
bfill): Uses the next valid observation to fill the gap. - Fill value: Provides a specific value to substitute for missing data.
The first two strategies are implemented using the method parameter in the .asfreq() method, while the fill value is specified with the fill_value parameter.
df_mean_temp = df[['mean_temp']]
df_mean_temp_hour= df_mean_temp.asfreq('H')

df_mean_temp_hour['ffill'] = df_mean_temp.asfreq('H', method='ffill')
df_mean_temp_hour['bfill'] = df_mean_temp.asfreq('H', method='bfill')
df_mean_temp_hour['value'] = df_mean_temp.asfreq('H', fill_value=0)
df_mean_temp_hour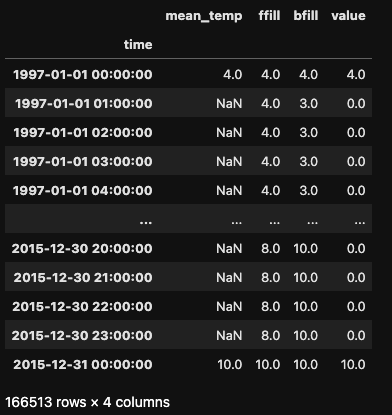
Downsampling with asfreq()
Now let's explore downsampling. Suppose we want to change the daily frequency to a monthly one. We can accomplish this using .asfreq() with the parameter freq='M'.
In this case, we're reducing the frequency of our data, transitioning from daily to monthly. The resulting DataFrame has only 228 rows, compared to the 6,812 in the original DataFrame.
df_month = df.asfreq(freq='M')
df_month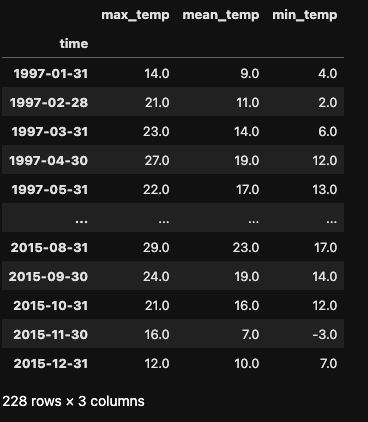
Notice that .asfreq() simply selects the last day of each month and uses its value to represent the entire month. No aggregation is performed (e.g., calculating the mean monthly temperature). To perform such aggregations, we'll turn to the .resample() method in the next section.
Resampling Using Pandas resample() Method
While .asfreq() is handy for displaying time series data at a different frequency, the .resample() method is the tool of choice when performing aggregations alongside resampling.
The .resample() method operates much like .groupby(): it groups data within a specified time interval and then applies one or more functions to each group. The result of these functions is assigned to a new date within that interval.
We use .resample() for both upsampling (filling or interpolating missing data) and downsampling (aggregating data).
Let's revisit our hourly conversion to see how upsampling works with .resample(). Applying .resample() returns a Resampler object, to which we can then apply another method to obtain a DataFrame.
print(df.resample('H'))DatetimeIndexResampler [freq=<Hour>, axis=0, closed=left, label=left, convention=start, origin=start_day]Regarding upsampling, the .resample() method can accomplish the same tasks as .asfreq().
df.mean_temp.resample('H').asfreq()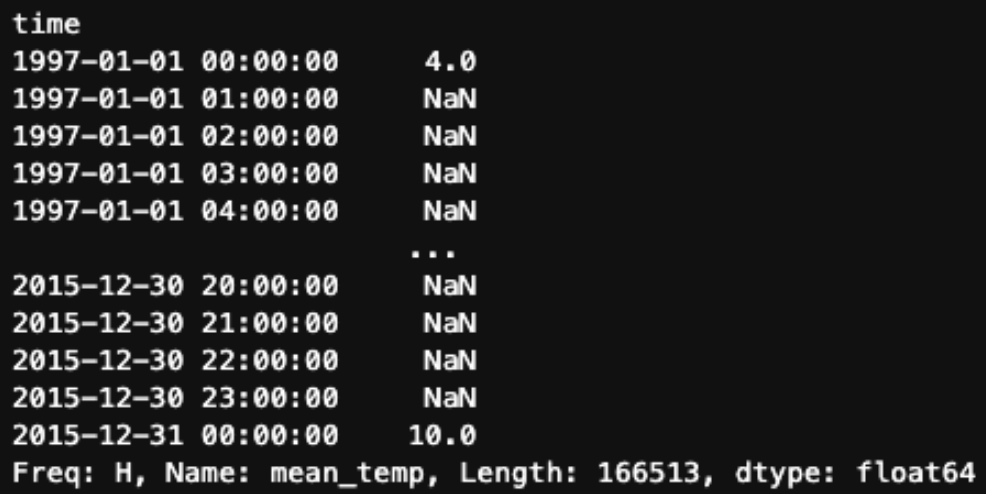
We can also apply the same filling and interpolation strategies we used with .asfreq(). For example, to use forward fill:
df.mean_temp.resample('H').ffill()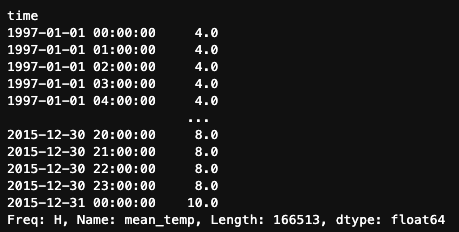
But .resample() also offers additional methods not available with .asfreq(). For example, we could use the .interpolate() method, which estimates values at new time points by finding points along a straight line between existing data points.
df.mean_temp.resample('H').interpolate()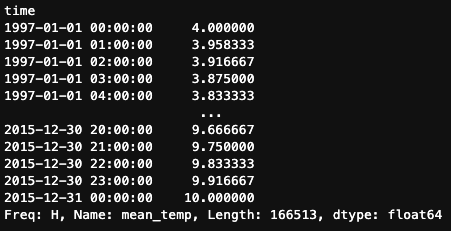
The .resample() method truly shines when it comes to downsampling, as it allows us to apply various aggregation methods to summarize our data. For example, let's calculate both the monthly average and quarterly median temperatures for Madrid using .resample().
df.mean_temp.resample('M').mean()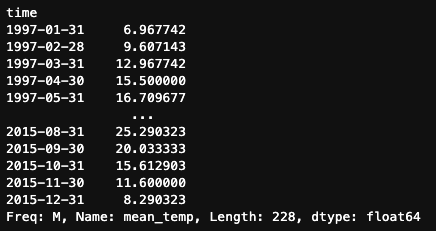
df.mean_temp.resample('Q').median()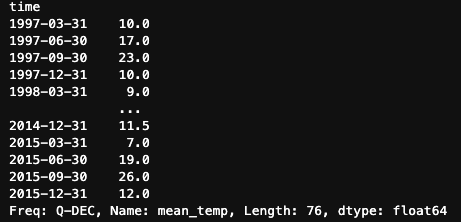
Advanced Resampling Techniques
Beyond the basic operations we've covered, Pandas resampling methods can also handle more advanced scenarios. Let's explore some of the most common ones.
Custom time frequency
Resampling allows us to create a new time series with a frequency tailored to our specific needs. Some commonly used frequencies include:
W: Weekly frequency (ending on Sunday)M: Month end frequencyQ: Quarter end frequencyH: Hourly frequency
However, Pandas offers many more options depending on our requirements. We can define frequencies based on start or end dates, use business days instead of calendar days, or even create entirely custom frequencies.
df.mean_temp.resample('M').mean() # calendar month end
df.mean_temp.resample('MS').mean() # calendar month start
df.mean_temp.resample('BM').mean() # business calendar end
df.mean_temp.resample('BMS').mean() # business calendar start
Multiple aggregations with downsampling
Like the groupby() method, .resample() allows us to apply multiple aggregations simultaneously. We can use the .agg() method and pass a list of aggregation functions, such as mean, median, and standard deviation.
df.mean_temp.resample('M').agg(['mean','median','std'])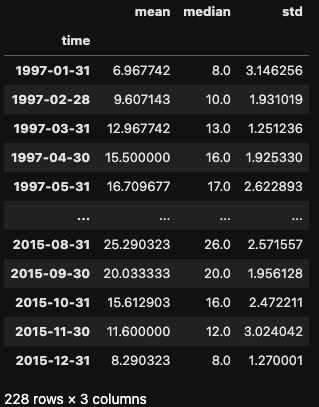
Resampling: Best Practices and Common Pitfalls
Pandas is highly optimized for handling large datasets, but as the size of our DataFrames grows, processing and manipulation can become computationally demanding. This is especially true during upsampling. Imagine resampling an hourly time series to seconds – the resulting DataFrame could be massive!
If we encounter performance issues with large datasets, we can use these strategies:
- Read only the columns you want to use.
- Use efficient data types that consume less memory.
- Use chunking when reading a file.
Fortunately, pandas versions 2.0 and later incorporate advanced techniques for more efficient processing. You can learn more in this article about Pandas 2.0.
Conclusion
Resampling is a fundamental technique in time series analysis, enabling us to adjust the frequency of our data by aggregating (downsampling) or interpolating (upsampling) values. We've explored how pandas provides powerful tools like .asfreq() and .resample() to make this process intuitive and efficient.
To deepen your understanding of resampling and time series manipulation in Python, check out these resources:

I am a freelance data analyst, collaborating with companies and organisations worldwide in data science projects. I am also a data science instructor with 2+ experience. I regularly write data-science-related articles in English and Spanish, some of which have been published on established websites such as DataCamp, Towards Data Science and Analytics Vidhya As a data scientist with a background in political science and law, my goal is to work at the interplay of public policy, law and technology, leveraging the power of ideas to advance innovative solutions and narratives that can help us address urgent challenges, namely the climate crisis. I consider myself a self-taught person, a constant learner, and a firm supporter of multidisciplinary. It is never too late to learn new things.
Pandas Resampling FAQs
What is the difference between rolling and resample in pandas?
Resampling changes the frequency of your time series data, while rolling operations calculate statistics over a sliding window of fixed size within the original frequency.
What is resample('MS') in Python?
resample('MS') is a specific parameter in the .resample() method. It tells pandas to resample the data to a month-start frequency. 'MS' stands for Month Start.
When should I use resampling?
Resampling is useful for a variety of tasks, including:
- Aligning multiple time series to a common frequency for comparison.
- Aggregating data to lower frequencies for analysis or visualization (e.g., daily data to monthly averages).
- Filling in missing data points in a time series through interpolation (upsampling).
What are the disadvantages of resampling?
- Upsampling can introduce bias if the interpolation method isn't chosen carefully.
- Downsampling can lead to information loss as data points are aggregated.
- Resampling on large datasets can be computationally expensive.
