Track
Hierarchies let you effortlessly drill down into your data, going from the big picture to the finer details with just a few clicks.
It's a huge time-saver and makes your reports more interactive and user-friendly. Instead of cluttering up your dashboard with a ton of separate charts for each data level, you can pack it all into one sleek visual.
It also helps tell a better data story. You can guide users through layers of information, revealing insights step by step.
In this tutorial, we explore hierarchies in Power BI and how to create, edit, and delete them. We’ll also review a few practical examples of how hierarchies can be used in different visualizations.
Master Power BI From Scratch
If you’re new to Power BI, check out our Power BI fundamentals skill track and keep our Power BI cheat sheet on hand as you review this tutorial and others for quick reference on some essential Power BI concepts.
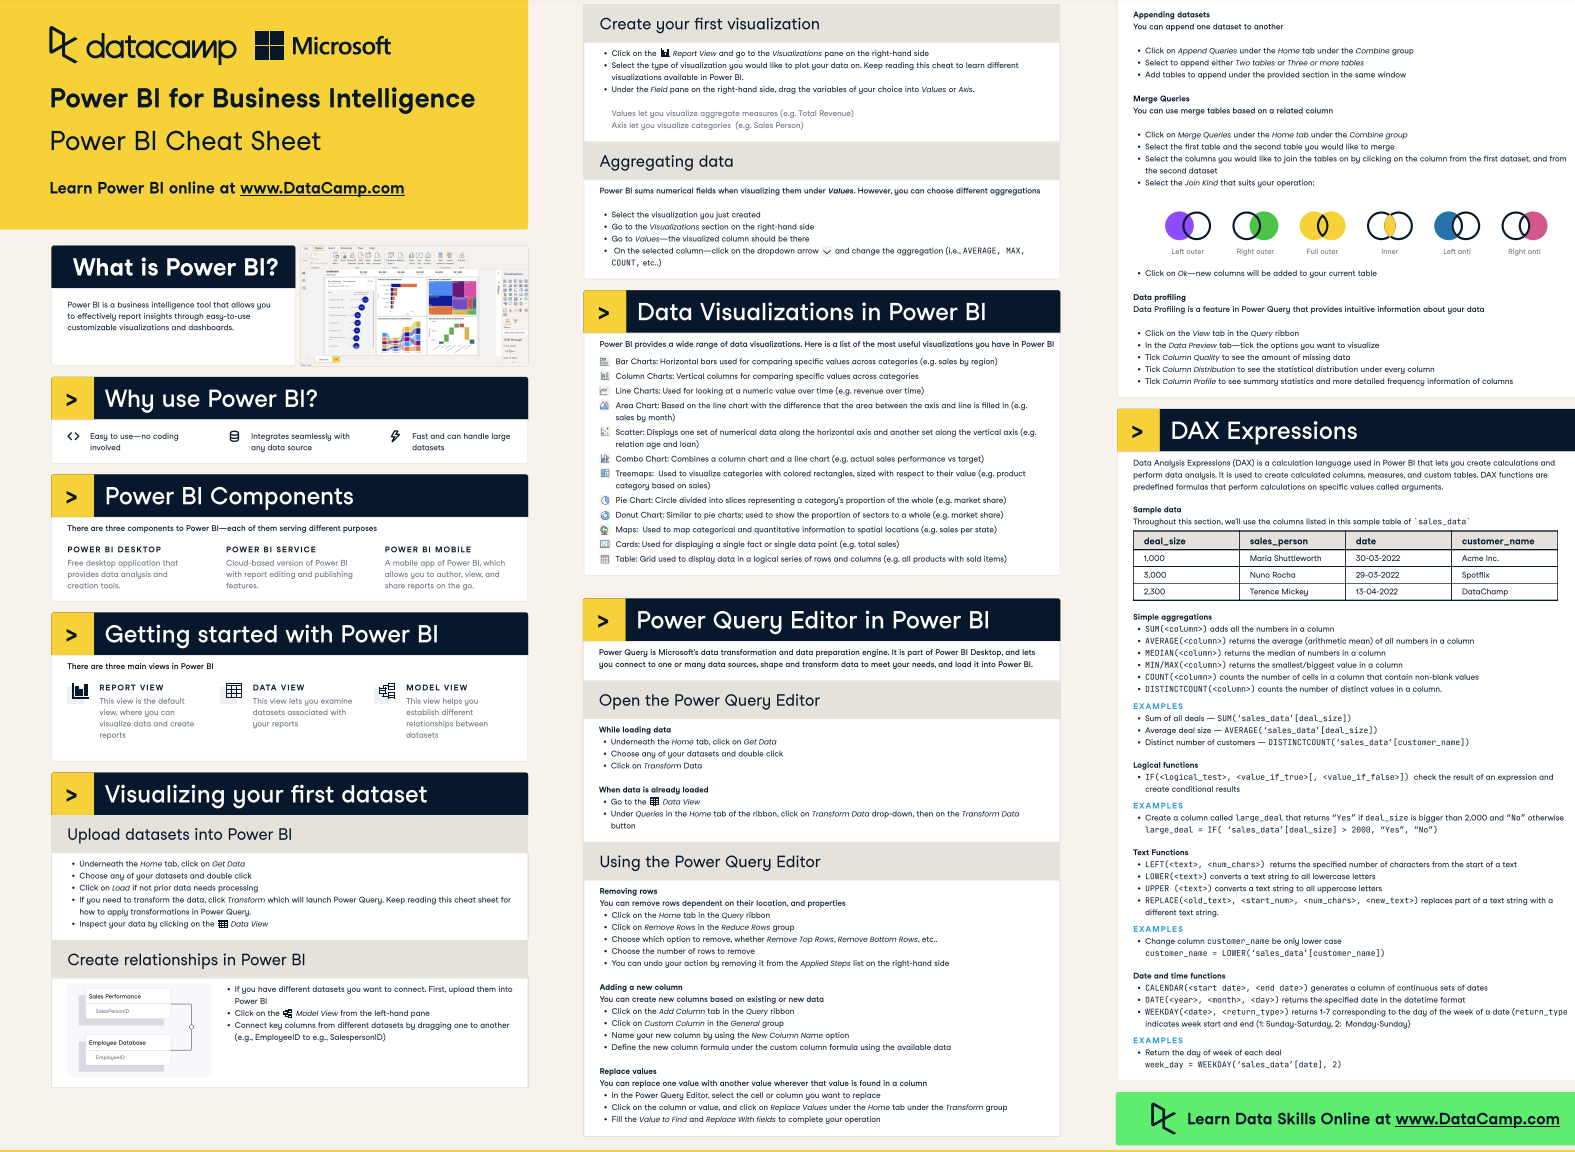
DataCamp’s Power BI Cheat Sheet
What is a Power BI Hierarchy?
Hierarchies in Power BI organize related data fields in a hierarchical structure, allowing users to drill down from higher to more detailed levels.
Hierarchies typically have two or more levels, with each level representing a more granular view of the data.
For example, you could have a hierarchy for locations from State > City > Store. When you use this in a visual, you can start by looking at state-level data, then drill down into a specific city, and then a store. This is useful for exploring your data without cluttering up your report with many separate charts.
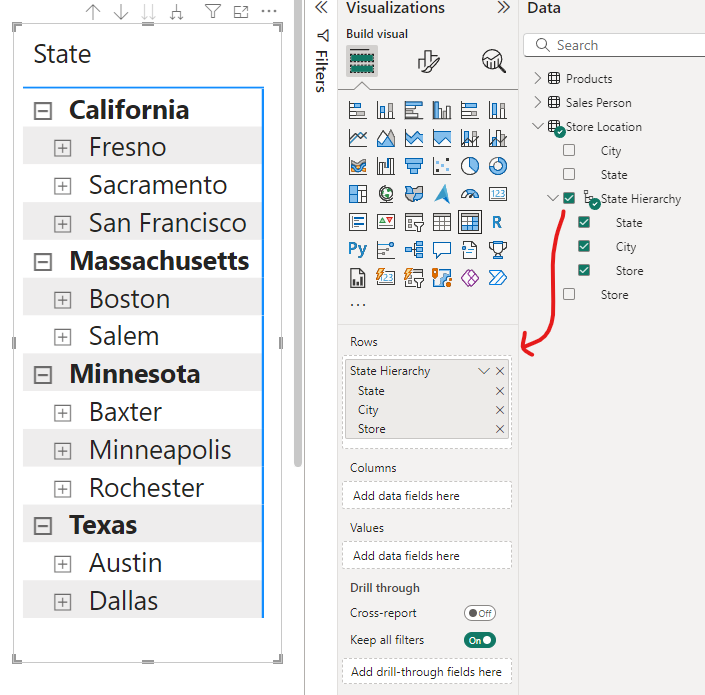
Power BI - Hierarchy Example
You can easily create these hierarchies yourself, and it saves you a lot of time when you're building visuals because you can just drag in the whole hierarchy instead of adding each level separately. You can learn more about other key concepts in our Power BI tutorial for beginners.
Here’s a comparison between adding individual fields to a visual versus adding a hierarchy with all fields included at once.
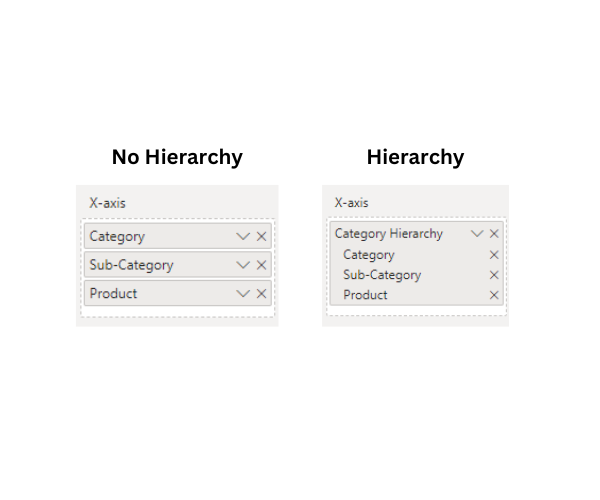
Power BI - Hierarchy versus No Hierarchy in a Visual
Power BI Date Hierarchies
When you import a date field into your model, Power BI automatically creates a hierarchy. It breaks down your dates into Year, Quarter, Month, and Day levels.
This is convenient because you can instantly start drilling down through time periods in your visuals. For example, you can look at sales by year, then click to see them by quarter, then by month, all from that one date field. There is no need to create separate columns for each time unit.
Keep in mind, though, that while these automatic date hierarchies are great for quick analysis, they could negatively impact your report performance. Consider turning off automatic hierarchies (also called “time intelligence” in Power BI) and creating custom date tables for data models with large volumes of data.
Plus, sometimes, you might want more control. For example, if you need custom fiscal years or unique date groupings, you might need to turn off the auto hierarchy and build your own.
To turn off automatic hierarchies, go to Power BI desktop settings. However, remember that disabling automatic date/time hierarchies apply to all date columns in the model, and you cannot selectively enable it for just some date fields.
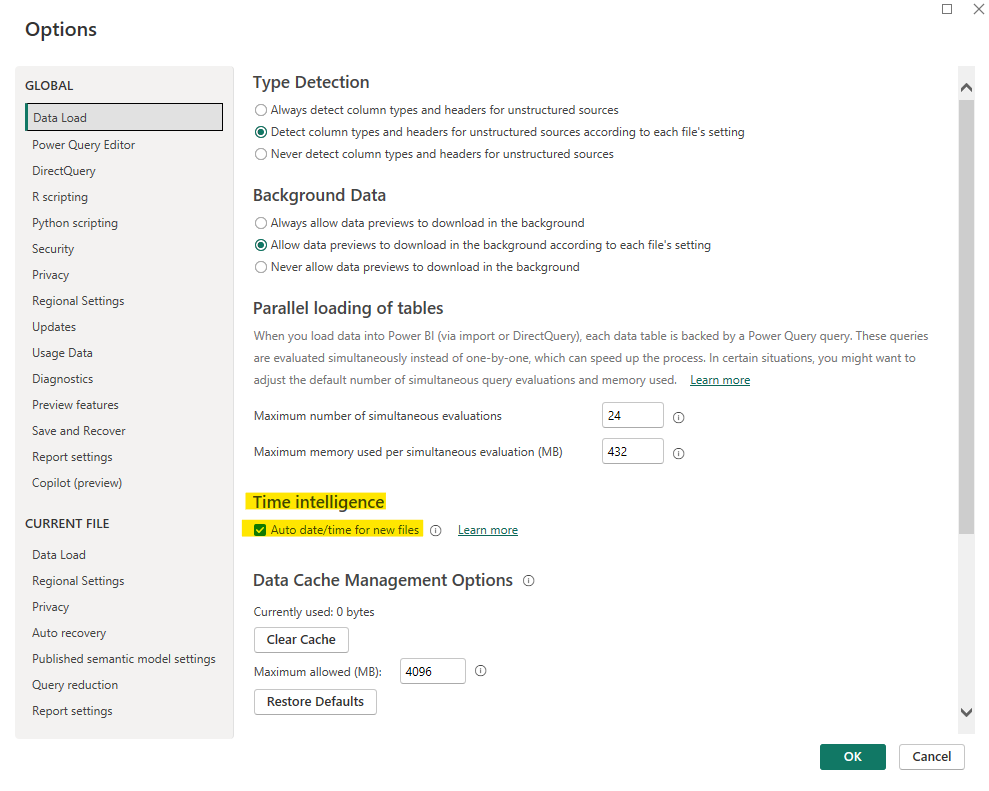
Power BI - Enable/Disable Automatic Date Hierarchies
An excellent use case for keeping automatic date hierarchies enabled is if you need to develop report prototypes or proofs-of-concept very quickly. Having these ready-to-use data structures saves a lot of time without manually creating hierarchies for each date-type field.
Custom Hierarchies in Power BI
These are hierarchies manually created by users to suit specific reporting needs.
You can take any related fields in your data and stack them up in a way that makes sense for your analysis.
For example, let's say you're looking at product data. You could create a hierarchy that goes from Category > Subcategory > Product. You can do this by right-clicking on the field in the Fields pane that will be the top-most level in your hierarchy (in our example below, we start creating the hierarchy from the Category field) and then select "New hierarchy."
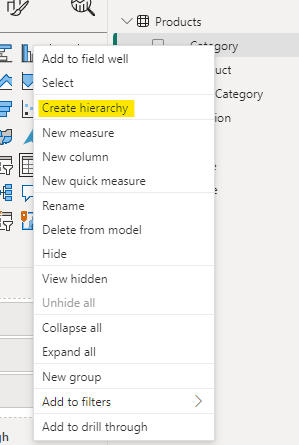
Power BI - Create Hierarchy
Custom hierarchies are great for any data with a natural drill-down flow that you want to keep consistent between all your reports. Incorporating hierarchies into your semantic model means that any subsequent reports built from the same semantic model will maintain the same hierarchical structure.
Check out our blog post for more information on Power BI semantic models.
There's no strict limit on the number of levels, but due to practical considerations, hierarchies with more than five levels are uncommon.
Editing, Updating, and Removing Power BI Hierarchies
The ability to modify hierarchies gives you flexibility to refine and improve your data model as needed. However, changes to hierarchies may impact existing visuals and reports that use them, so it's a good idea to test the effects of any modifications.
Add new levels
You can add new levels to a hierarchy by right-clicking a field in the Report view and selecting "Add to hierarchy". Then, choose which hierarchy you would like to add the field to.
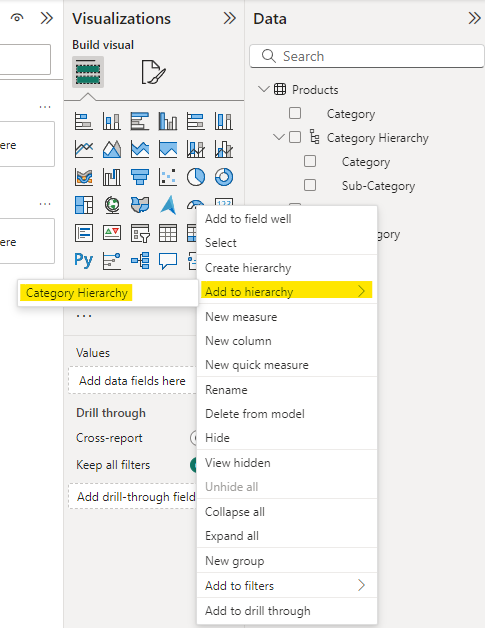
Power BI - Add to Hierarchy
The Model view allows you to add new levels to your hierarchies easily. For example, in our “Category Hierarchy” created in the previous section, if we navigate to the Model view tab and select the new hierarchy we created, we can now see an additional section under the properties side panel where we can add levels to our hierarchy.
When you are happy with your hierarchy, select “Apply Level Changes”.
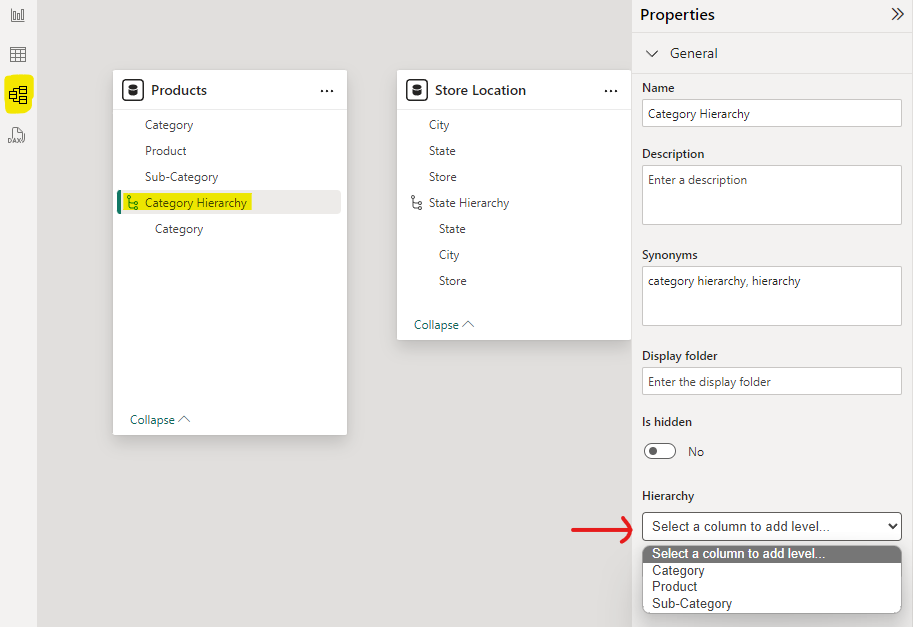
Power BI - Add to Hierarchy (Model View)
Remove levels
From the Report view, you can remove levels by right-clicking on a level in the hierarchy and selecting "Delete from model". Make sure you correctly select the field inside the hierarchy, not the original field in your data.
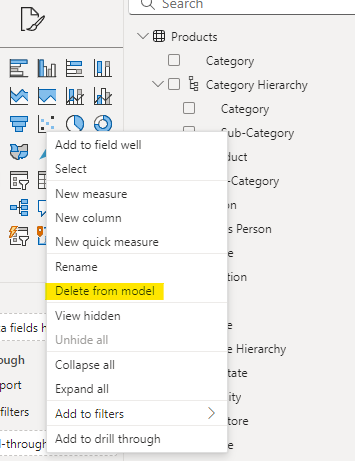
Power BI - Remove Hierarchy Level
Alternatively, you can easily remove hierarchy levels from the Model view by selecting the hierarchy's name and then clicking on the X icon next to the level you would like to delete. This method makes it much less likely that you will accidentally delete the wrong field!
Remember to click “Apply Level Changes” when you are done.
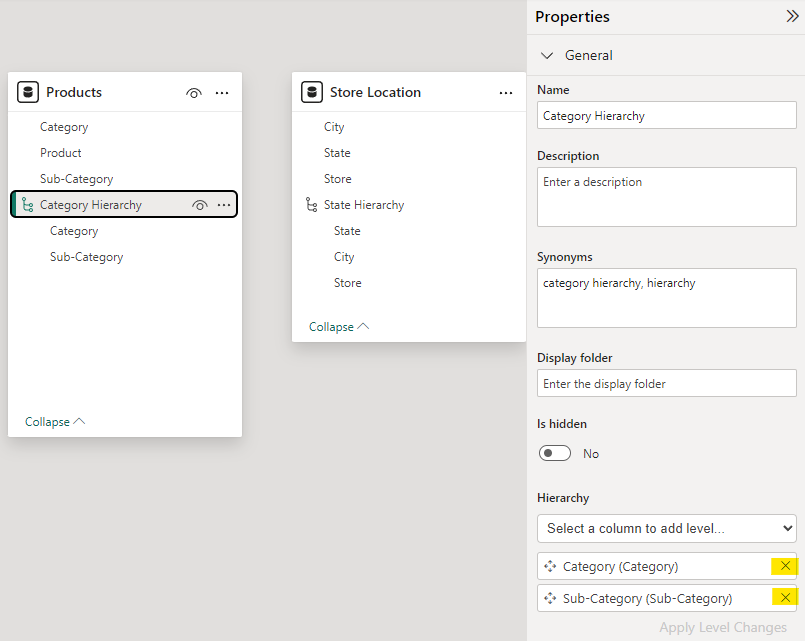
Power BI - Remove Hierarchy Level (Model View)
Reorder levels
You cannot reorder the levels of a hierarchy from the Report view unless you delete the entire hierarchy and recreate it with the updated order of the levels.
However, in the Model view, hierarchy levels are easily rearranged by simply dragging them into the order you want them to be in. Click “Apply Level Changes” when you are happy with the order.
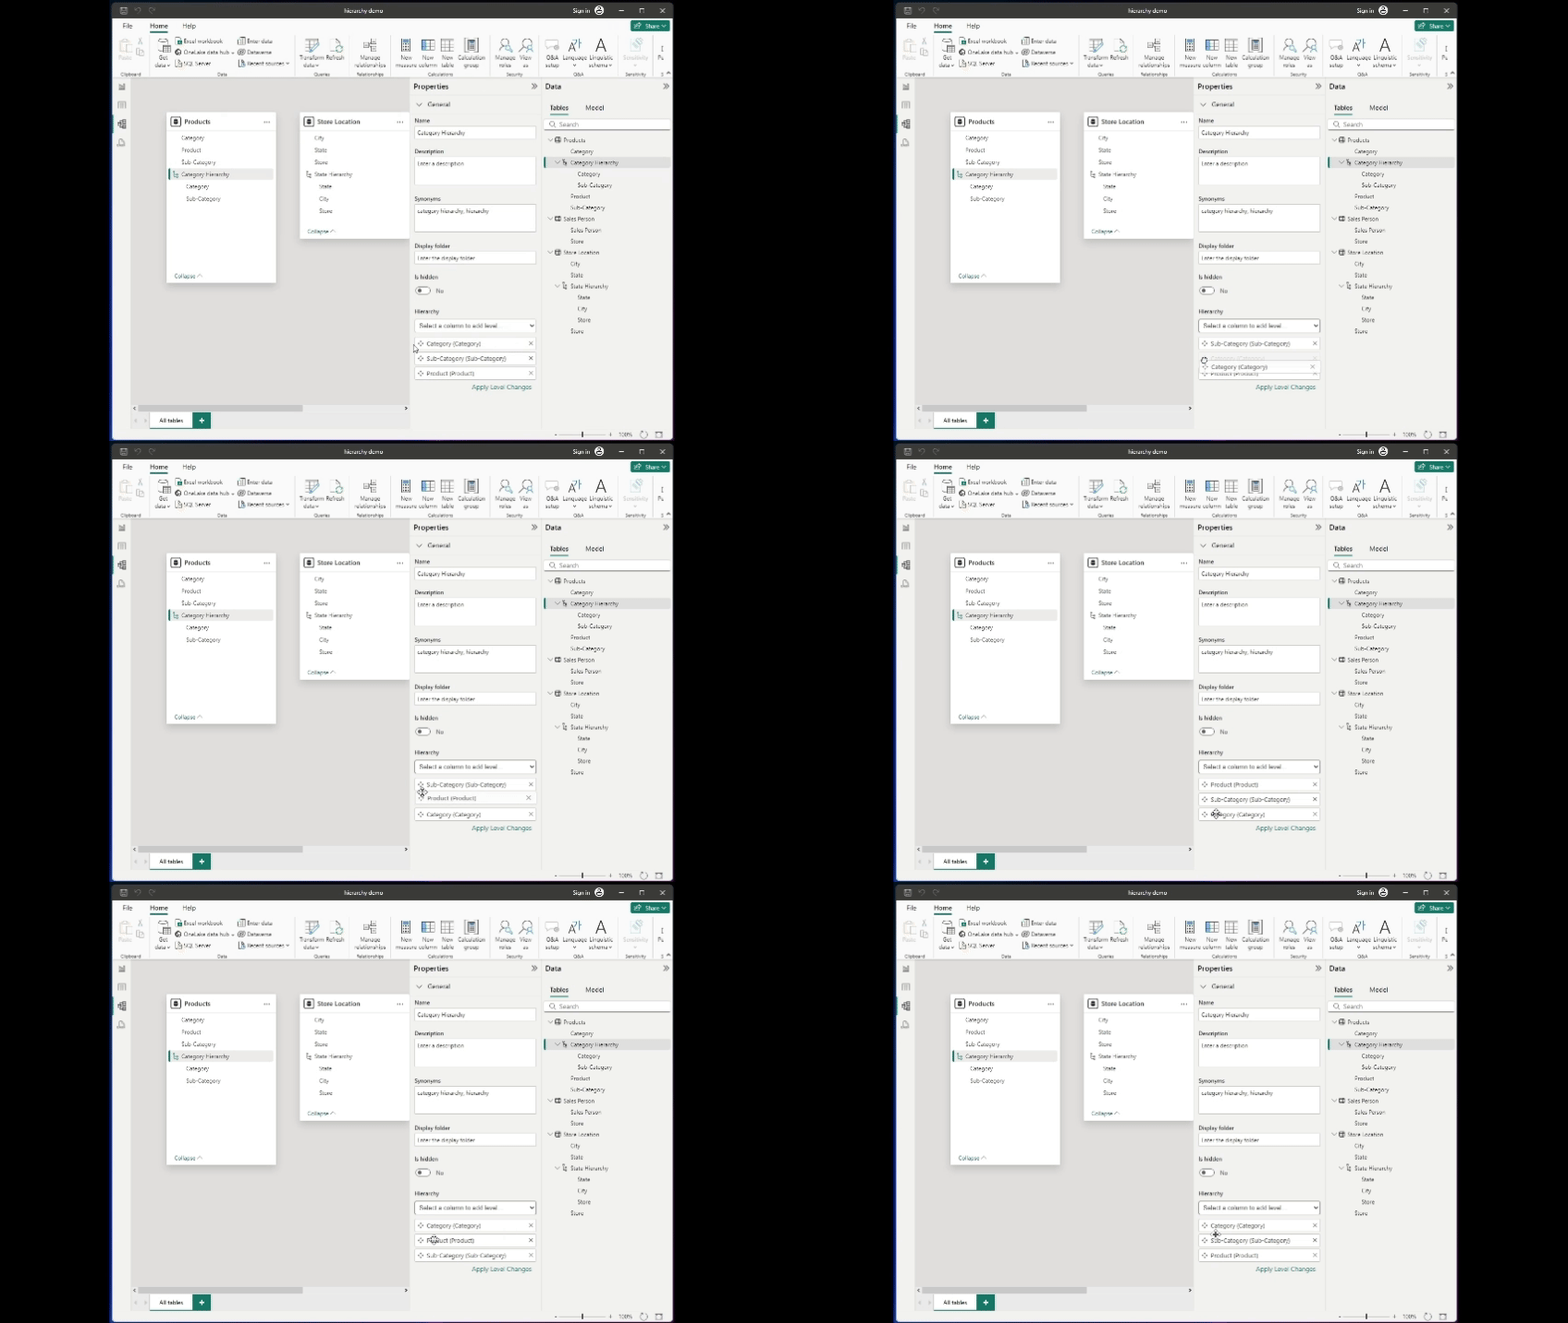
Power BI - Reorder Hierarchy Levels (Model View)
Rename the hierarchy or levels
Right-click on the hierarchy or a level and select "Rename" to easily rename the hierarchy. You can do this from the Report view or the Model view.
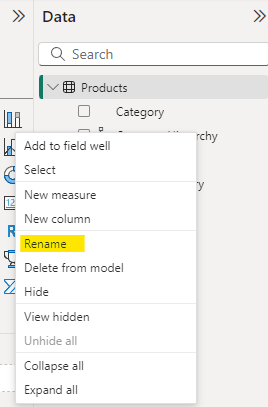
Power BI - Rename Hierarchy
Delete the entire hierarchy
Similar to deleting hierarchy levels in the Report view, you must right-click the hierarchy name and select "Delete from model" to delete the entire hierarchy. You can do this from either the Report view or the Model view.
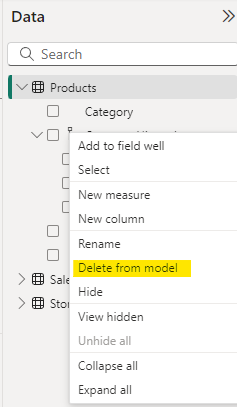
Power BI - Delete the Entire Hierarchy
Using Hierarchies in Visualizations
For performance, it pays to be smart about which visuals you use with hierarchies.
Tables and matrices handle them really well, but some chart types (like pie or donut visuals) can get messy with too many levels.
Best charts to display hierarchies
Many standard charts like bar charts, column charts, and line charts can be configured to support drill-down functionality when working with hierarchical data. Users can click to drill down into more detailed levels.
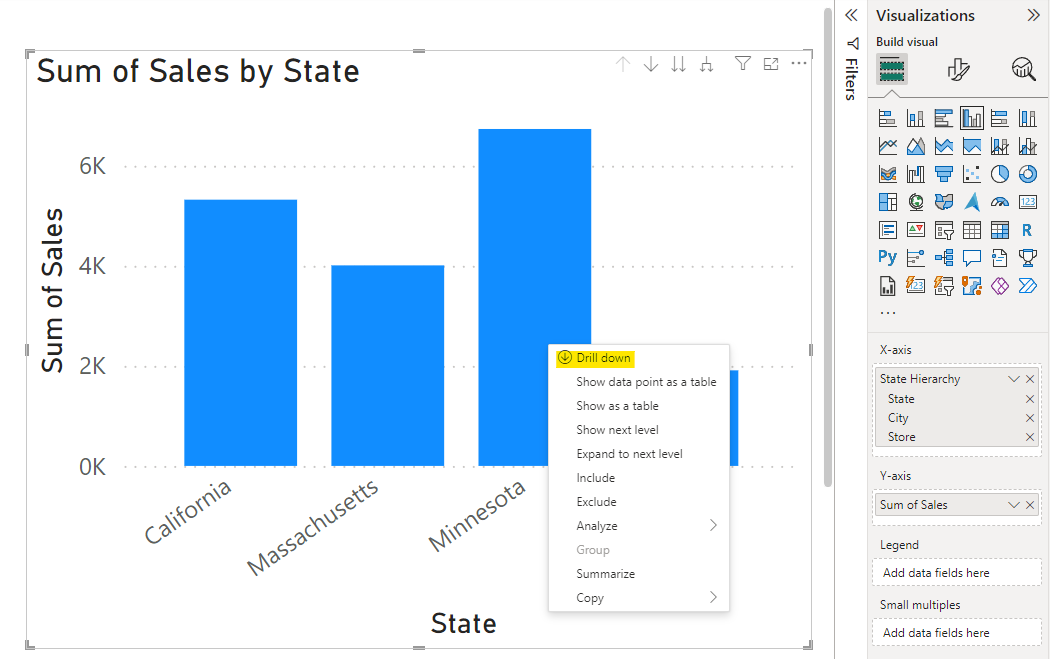
Power BI - Clustered Column Chart with Hierarchy Drill Down
The matrix visual in Power BI is well-suited for displaying hierarchical data in a tabular format, allowing users to expand and collapse different levels. Tables and matrices are straightforward and let users expand and collapse levels easily, making them perfect for showing more detailed information at each level.
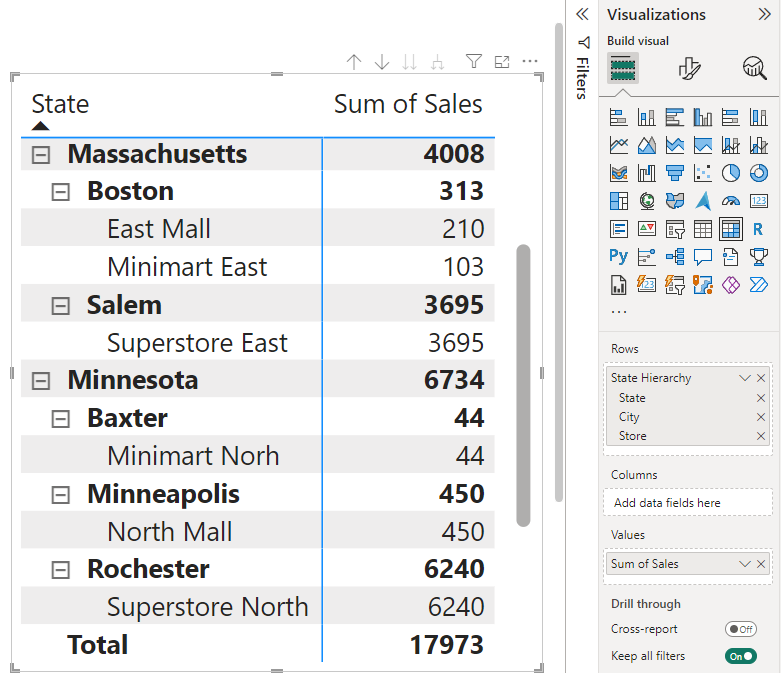
Power BI - Expanded Matrix with Hierarchy
Treemaps and decomposition trees also allow you to display hierarchical data. They allow you to expand levels and drill down into more detail where needed.
Adding a hierarchy slicer
Hierarchy slicers allow users to drill down from higher to more detailed levels within the same slicer. They typically have expand/collapse icons (like chevrons or plus/minus signs) to navigate through the levels.
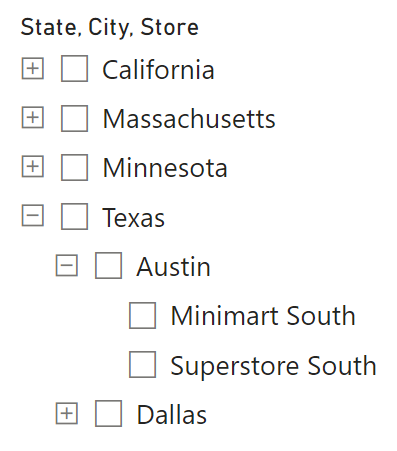
Power BI - Hierarchy Slicer
You can create hierarchy slicers in two ways:
- By adding multiple related fields to a standard slicer visual
- By adding a hierarchy field to a slicer (either a date hierarchy or a custom hierarchy)
One benefit of hierarchy slicers is that they save space on the report by combining multiple filters into one slicer visual.
There are options for single- or multi-select functionality, and you can include a search function for easier navigation of large hierarchies.
By default, hierarchy slicers will display blank values, and there are no built-in options for removing or hiding them. Blank values in lower levels of the hierarchy will just appear as nested blank entries under parent items.
Some potential ways to handle blank values in hierarchy slicers include:
- Applying filters to remove blanks, though this can sometimes remove entire branches of the hierarchy unintentionally.
- Modifying the underlying data model (through the Power Query editor) to replace blanks with meaningful values like "N/A" or "Unknown", for example.
- Using DAX measures to conditionally display values and hide blanks.
Limitations of Hierarchies in Power BI
Hierarchies are extremely useful tools. However, there are a few limitations that you should be aware of to plan your reports better and avoid headaches down the road.
Power BI supports real-time data analysis through its incremental refresh and DirectQuery features. However, real-time data analysis with hierarchies is only supported with Power BI Premium.
Also, not all visuals work well with hierarchies. Some of the more specialized chart types might not support them well or at all. You might have to stick to the basics sometimes.
Hierarchies can get a bit messy with really large datasets and too many levels. They might slow down your report or make navigation difficult and clumsy.
While you can technically create a hierarchy with more than five or even ten levels in Power BI, it's not common practice since it’s just not practical. If you genuinely need a very deep hierarchy, you should be able to create it, but carefully consider the implications on report performance and user experience.
Common Pitfalls with Hierarchies
One big pitfall when working with hierarchies is not thinking through the logical order of the levels. For example, putting 'Product' before 'Category' when it should be the other way around can make your drill-down experience confusing.
Another mistake is overloading a hierarchy with too many levels. It's tempting to throw everything in there, but it can make your report sluggish and overwhelming. Keep it focused on what really matters for your analysis.
Also, it’s easy to forget to give your hierarchies meaningful names. Calling it "Hierarchy 1" isn't helpful to anyone. Name it something clear like "Geography" or "Product Structure" so users know what they're dealing with.
Conclusion
Hierarchies in Power BI enhance data analysis by allowing users to easily navigate between different levels of detail in their data, improving the overall reporting and visualization experience.
If you’re interested in starting a career as a Power BI developer, our comprehensive Data Analyst in Power BI career track covers everything you need to know to land your first job. Plus, it also fully prepares you to get certified.
Get certified in your dream Data Analyst role
Our certification programs help you stand out and prove your skills are job-ready to potential employers.

Power BI Hierarchy FAQs
Can I customize the levels of automatic date hierarchies?
No, you can't directly customize the default date hierarchy. Instead, you can create a custom hierarchy with the levels you want or use a custom date table.
How do I sort a custom hierarchy in a specific order?
You can add sort columns to your data model and use it to define a custom sort order for each of your hierarchy levels individually. Then, within your visual, you can specify which hierarchy level you want to sort by.
How do hierarchies impact performance in Power BI reports?
Complex hierarchies with many levels may affect report loading times, and large volumes of data in hierarchies can drastically impact query performance. Automatic date hierarchies can potentially increase model size and performance, especially if you have many date fields in your data model. Power BI will automatically create these hierarchies under the hood even if you don’t directly incorporate them into your report.
Can I customize the drill-down behavior of hierarchies in visualizations?
Yes, you can customize drill-down behavior by turning these header icons on or off in the formatting options for each visual. From here, you can enable or disable drill-down, expansion, and control how users interact with the hierarchy.
Which Power BI visuals support hierarchies?
Many standard charts, such as bar charts, column charts, and line charts work well with hierarchical data since they support drill-down functionality. Tables and matrices also handle hierarchies really well, but some chart types (like pie or donut visuals) can get messy with too many levels.

