course
How to Create a Power BI Waterfall Chart: 5 Easy Steps
A waterfall chart visually breaks down data into segments to help identify trends and patterns. It is widely used in finance, project management, and performance evaluation, in particular. Or in the business world, the waterfall chart makes it easy for executives to pinpoint factors driving an organization's profit or costs and see such factors' impact.
In this article, I will show you how to create and customize a waterfall chart in Power BI. Power BI is great for this because it offers a no-code solution for creating visualizations like the waterfall chart and performing advanced customization. You will also learn best practices and common pitfalls to avoid.
What is a Waterfall Chart in Power BI?
Let's take a moment for a closer look at waterfall charts.
Understanding waterfall charts
A waterfall chart, also known as a bridge chart, visually represents how a factor is affected by a series of increases and decreases over a specific factor. It shows the changes in a variable from the initial starting point to the final stage. The waterfall chart also shows the cumulative effect of positive and negative values on a starting point.
The name, as you might have guessed, comes from the way the chart visually resembles a cascading waterfall. As you will see in the examples below, instead of having all the bars start from the x-axis, they appear to float and build upon one another, creating the effect.
Critical components of a waterfall chart
The following are the various components of the waterfall chart:
- Starting Point: This is the waterfall chart's initial value and first column.
- Upward Columns: These columns represent factors that contribute to the increase of the initial value.
- Downward Columns: The downward columns represent factors that contribute to decreasing the initial value.
- Endpoint: This is the final result of a waterfall chart, which has the accumulated effects of the upward and downward columns. It is also the last bar on the chart.
- Intermediate Steps: They are additional bars that show the breakdown of the upward and downward columns influencing the final value.
- Color Coding: This helps to differentiate between the upward and downward columns in a waterfall chart. Upward columns are represented mainly by green, while red represents the downward columns.
Imagine a company’s CFO needs to explain to the board of directors why the company’s net income decreased from the previous year. A waterfall chart would illustrate the following:
Component | Factor | Value |
---|---|---|
Starting Point | Last year’s net income | $10 million |
Upward Column | Increase in revenue | +$5 million |
Downward Column | Increase in cost of goods sold | -$3 million |
Downward Column | Increase in operating expenses | -$2 million |
Downward Column | One-time legal settlement | -$4 million |
Downward Column | Increase in tax expenses | -$1 million |
Endpoint | This year’s net income | $5 million |
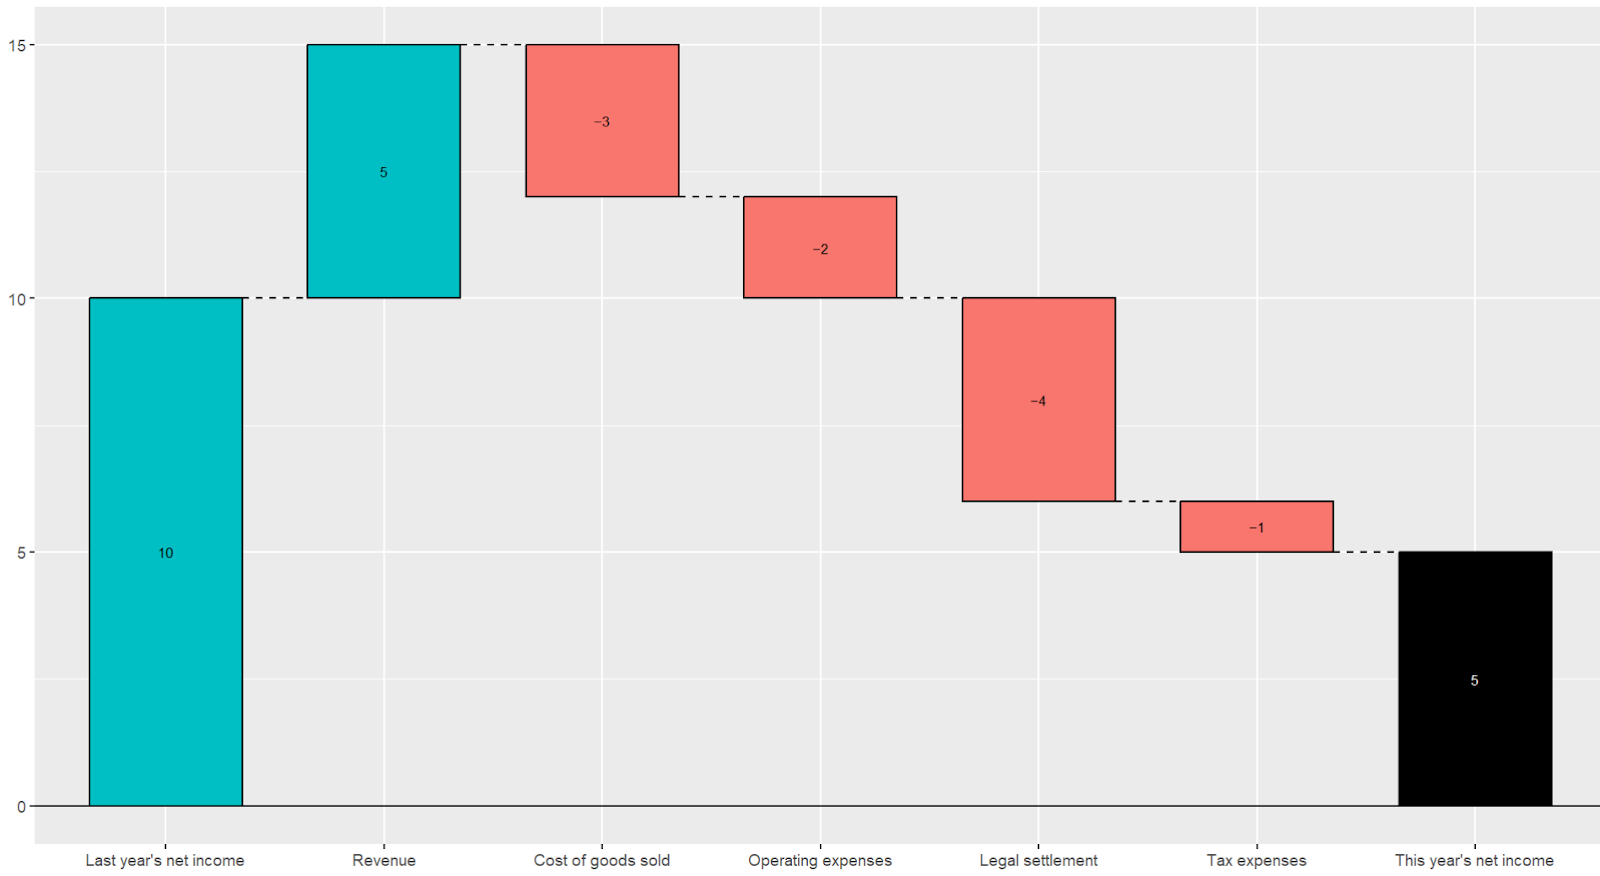
Waterfall chart explaining a company’s revenue decrease in millions. Image by Author
Creating a Waterfall Chart in Power BI
In this section, you will create a waterfall chart using the supermarket sales dataset to investigate products driving the most profit. Before you continue, ensure you have Power BI Desktop installed on your PC.
Step 1: Importing and preparing your data
-
Import the
supermarket_sales.csv
file into Power BI.-
Go to the File tab on the main menu.
-
Click on Get Data.
-
Select Text/CSV as your data source.
-
Import data into Power BI. Image by Author
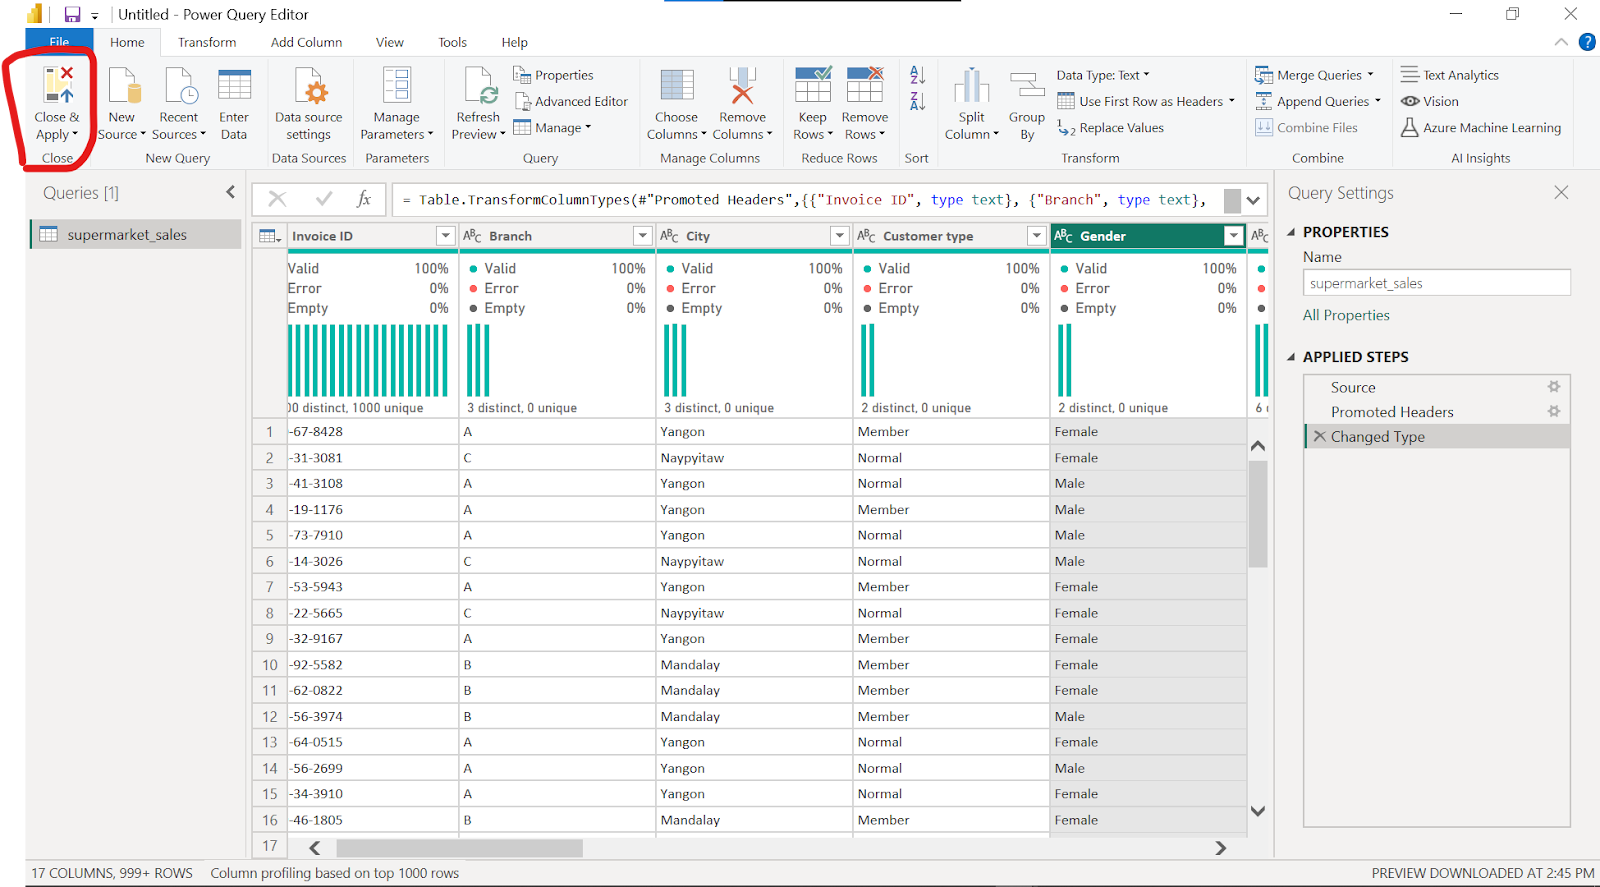
A window will pop up, showing a preview of the variables in the data and providing options to Load or Transform the data.
- Click Transform Data on the window to open Power Query.
Open the Power Query window. Image by Author
From the Power Query window, you can see that the data has 17 columns and 1,000 rows. Power Query cleans and transforms data before loading it into Power BI. Since the data we are to work with is already clean, there is no need for cleaning or transformation. Check out Data Transformation with Power Query M in Power BI to learn how to clean data in Power Query, in case you need to go through that step.
- Click on Close & Apply on the Home tab to apply any changes to the data and close the Power Query window.
Closing the Power Query window. Image by Author
Step 2: Creating a basic waterfall chart
To create a waterfall chart, you first need to create a Measure that you can apply to any visual. Measures in Power BI are calculations created using DAX Query. In this context, we will calculate a measure of Total Profit and use it to create the waterfall chart through the following steps.
- On the Data pane, right-click and click on New Measure. Create the Total Profit measure by pasting the following DAX syntax on the editor provided to you. The Total Profit is the sum of the gross income from all products, which is the total profit made from each sale.
Total Profit = sum(supermarket_sales[gross income])
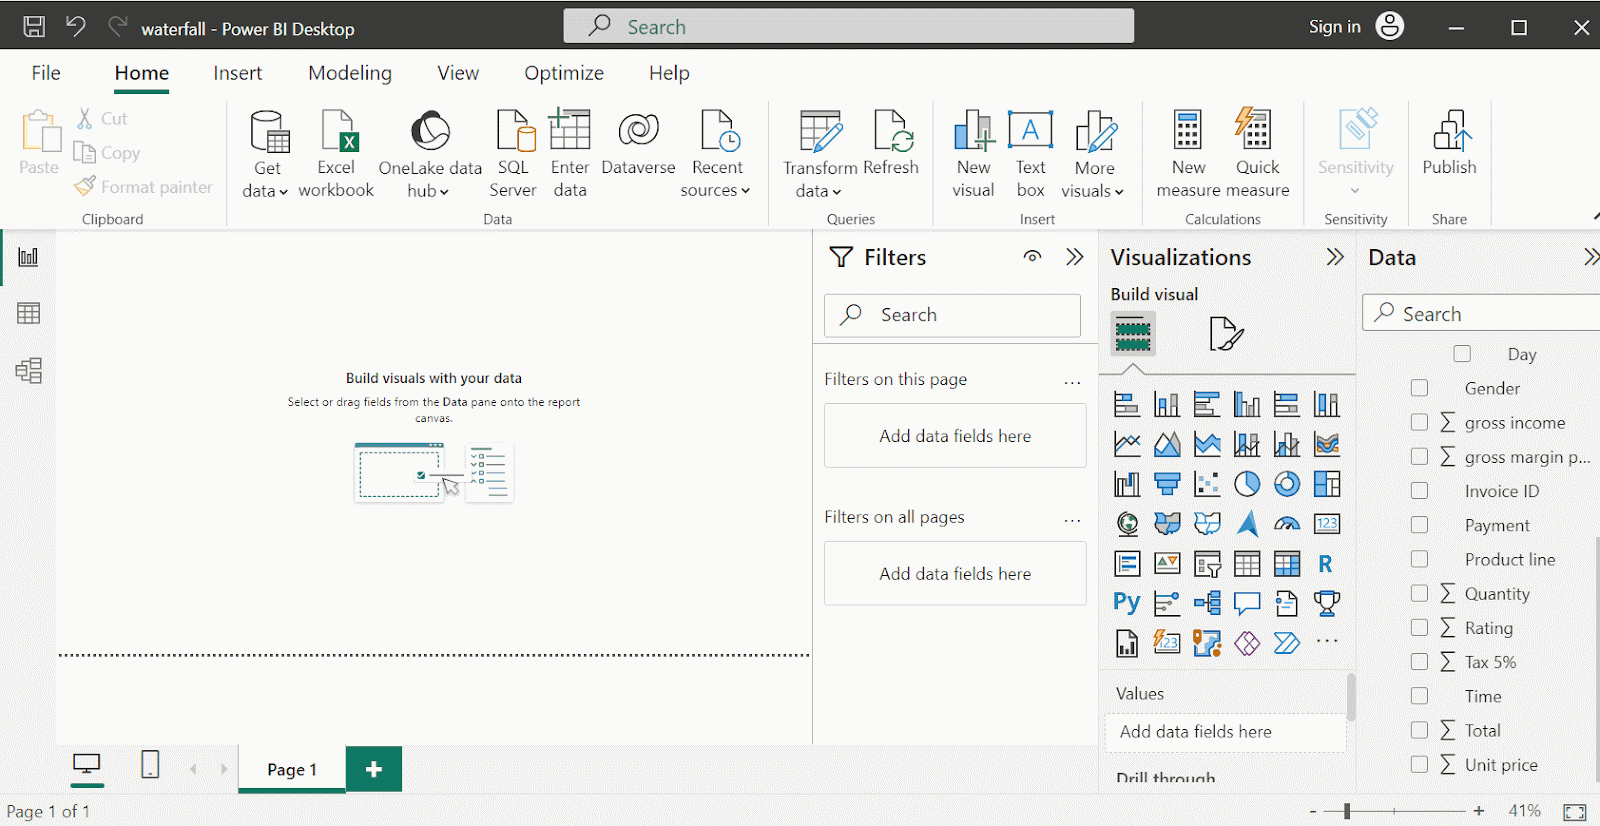
Create the Total Profit measure. Image by Author
- On the Visualizations pane, click on the waterfall chat icon. An empty chart will appear on your canvas.
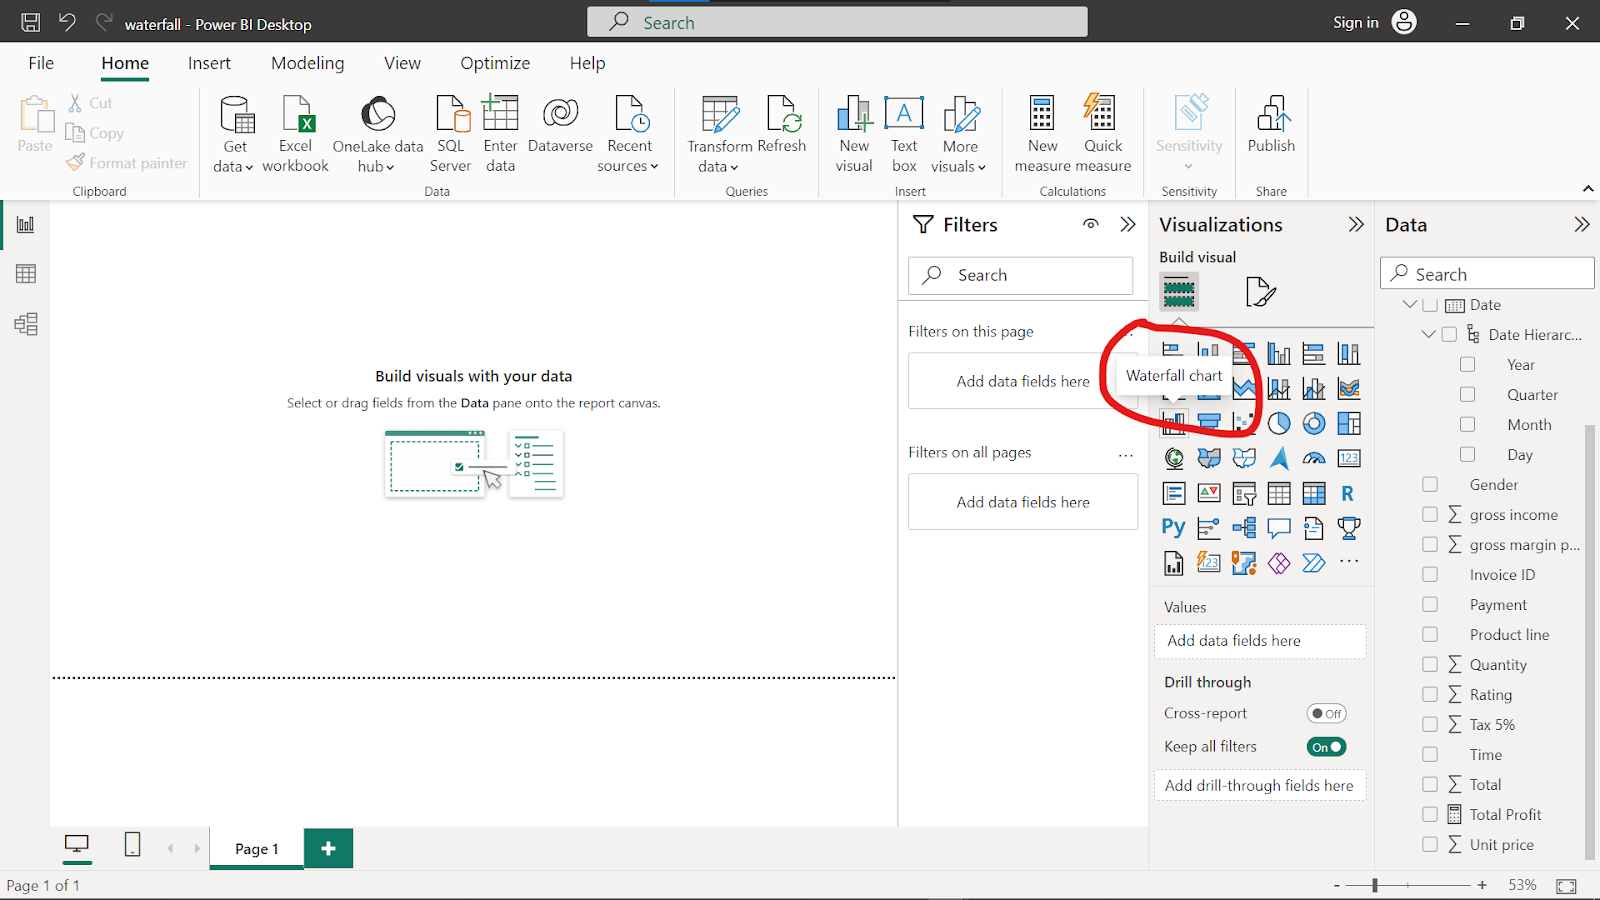
Waterfall chart icon on the visualization pane. Image by Author
- Select the empty chart and drag the Total Profit measure to the Y-axis field of the waterfall chart.
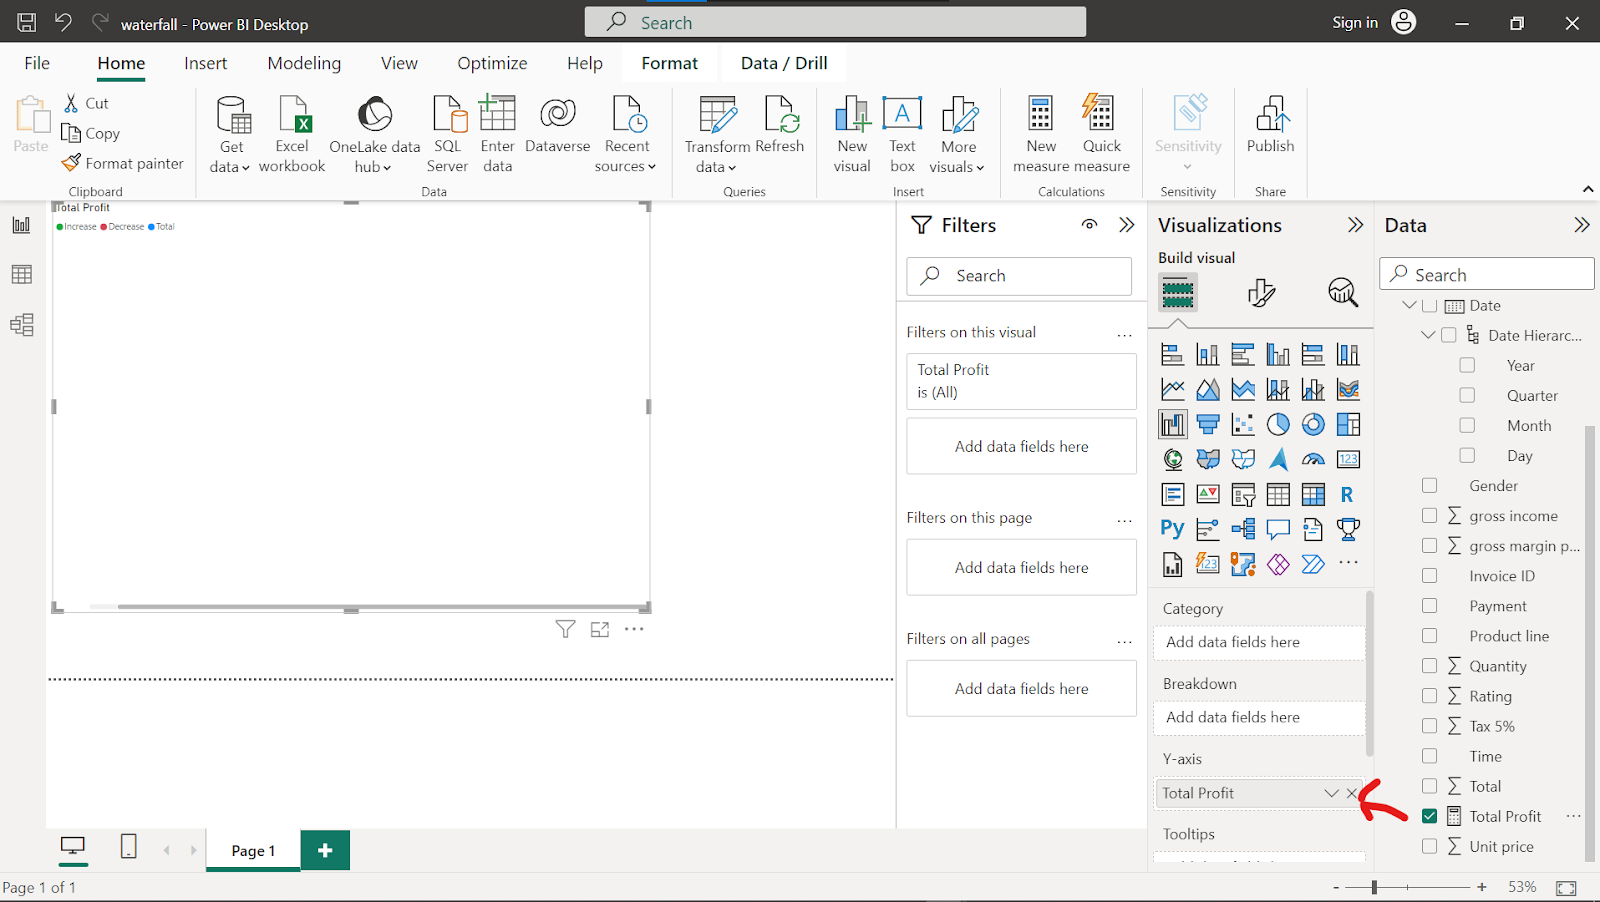
Add the Total Profit measure to the Y-axis. Image by Author
- Drag the Month variable into the Category field of the waterfall chart.
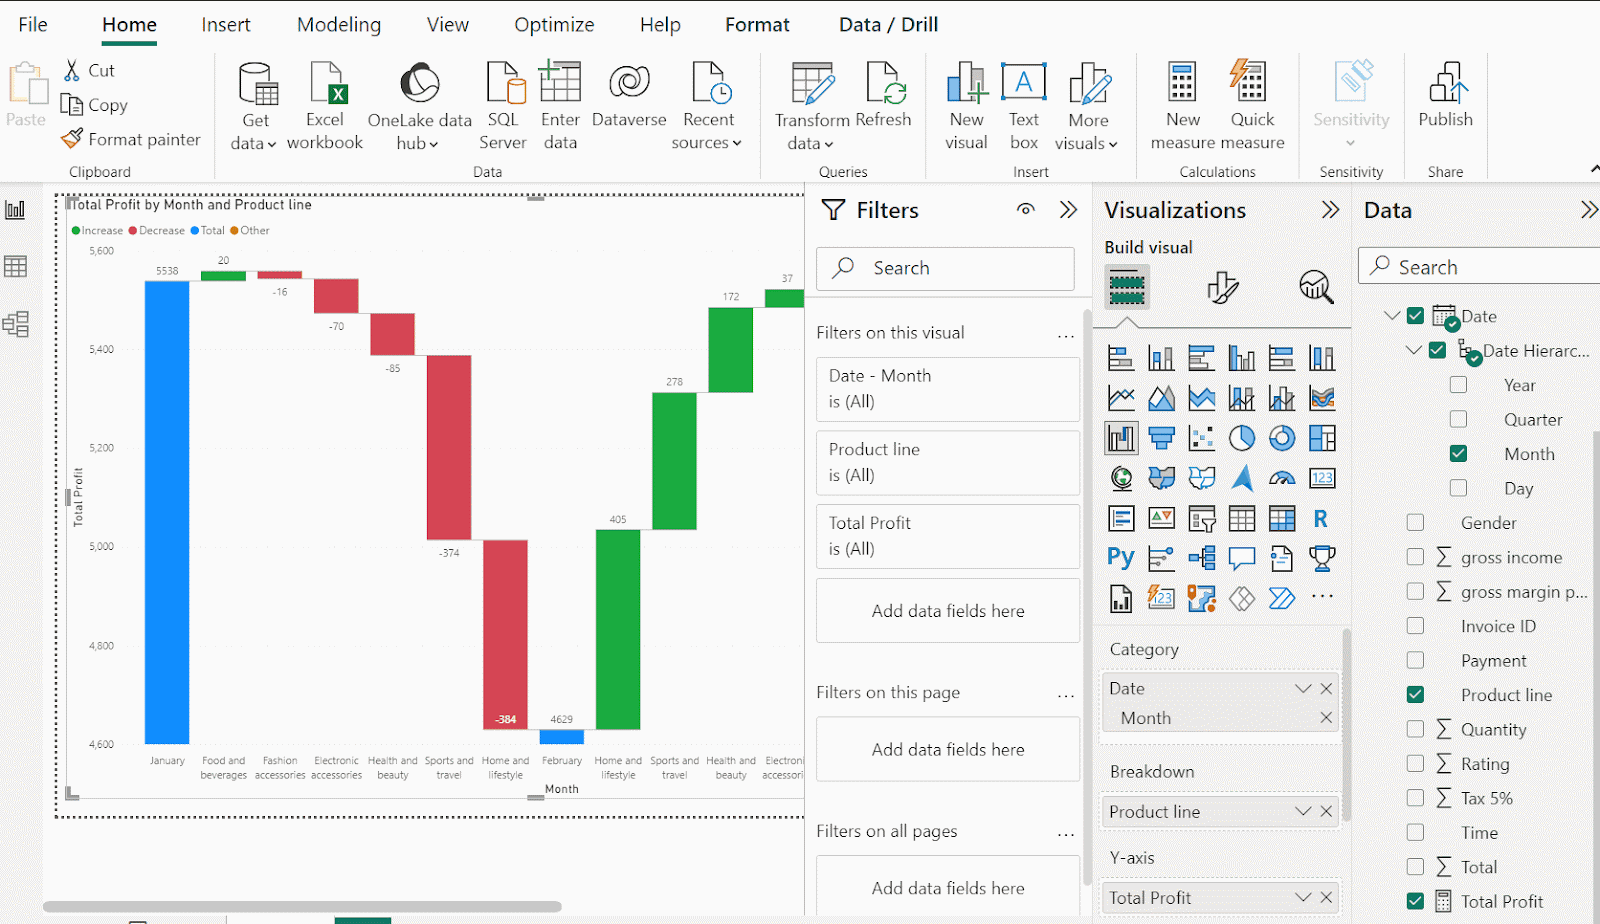
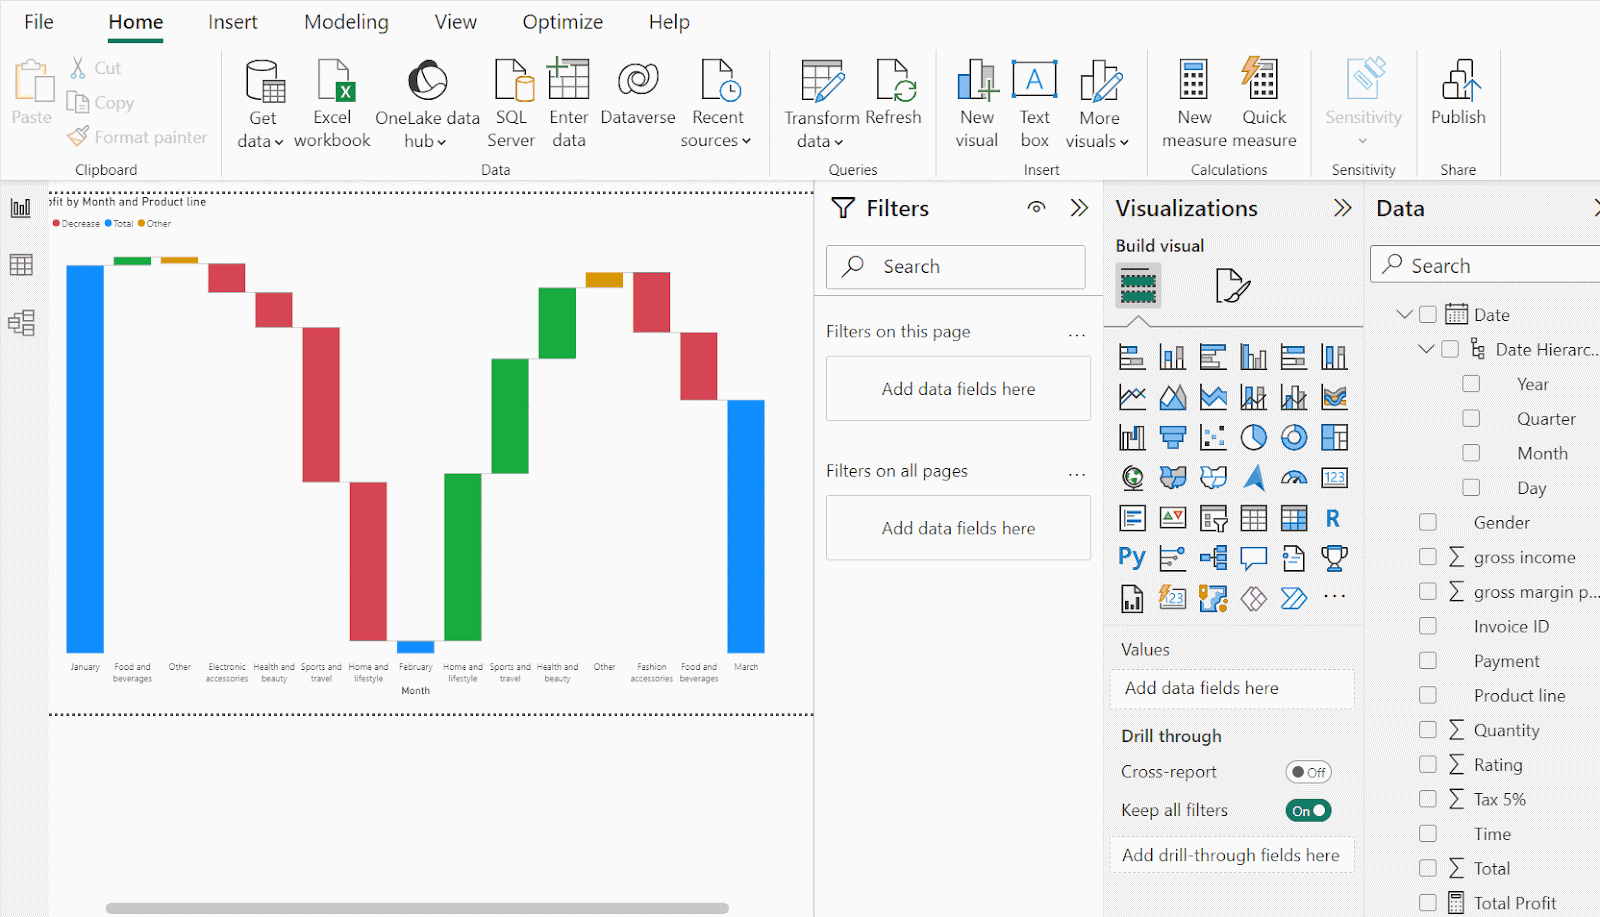
Add the Month category to the waterfall chart. Image by Author
The waterfall chart shows each month's contribution to the overall profit gained from January to March. You can follow the same procedures and visualize for other categories, such as Gender, Product line, and so on.
Step 3: Exploring and customizing the waterfall chart
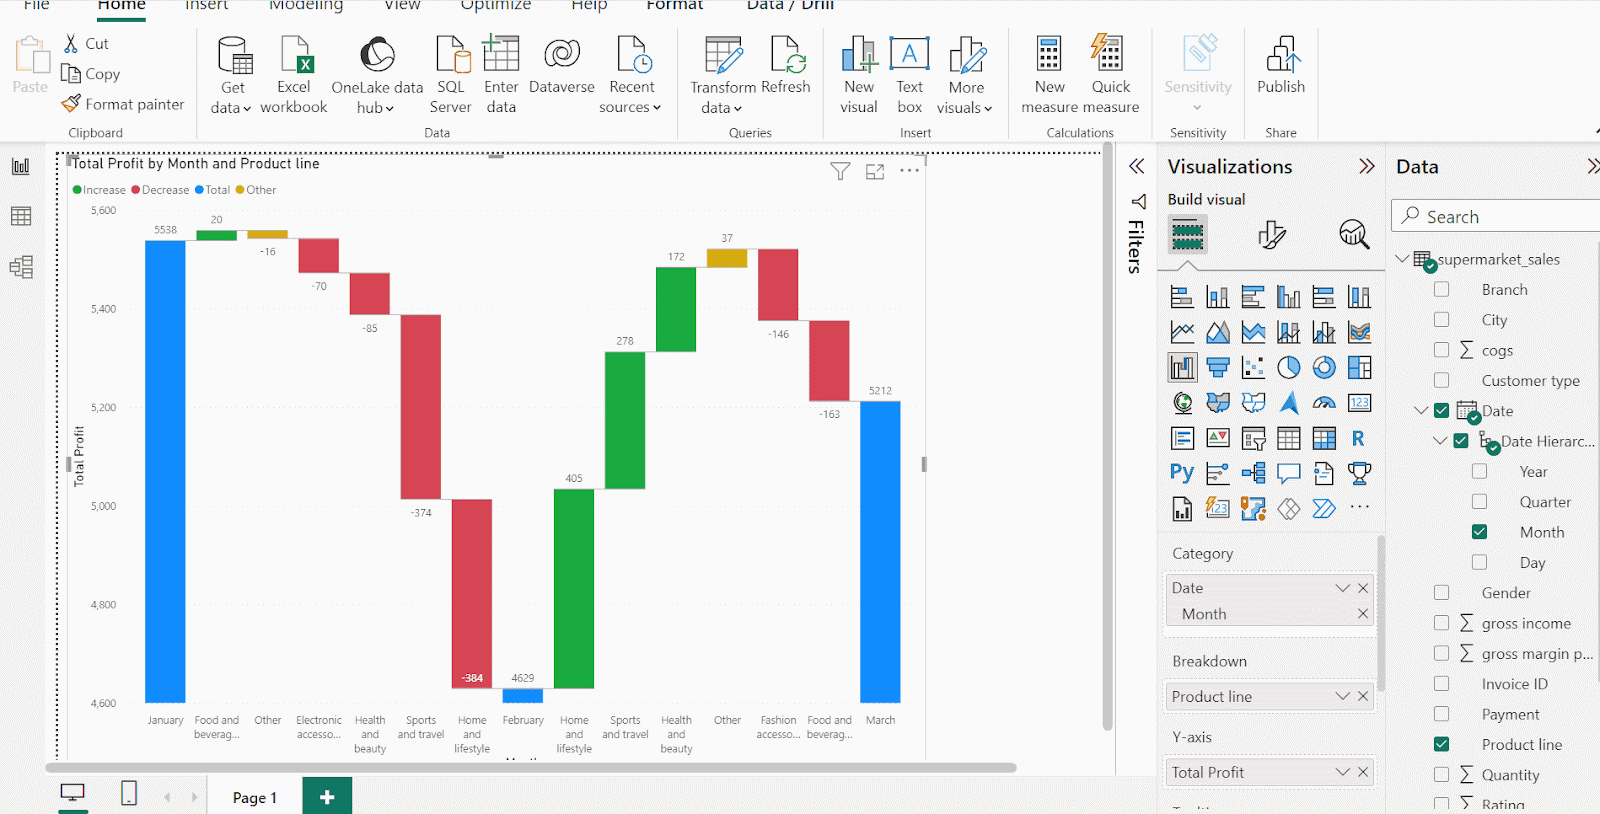
To explain the variances in each month, you can add breakdowns based on another category. Let’s use the Product line category to see the profit difference between two consecutive months. To add a breakdown, drag the Product line variable to the Breakdown field of the waterfall chart.
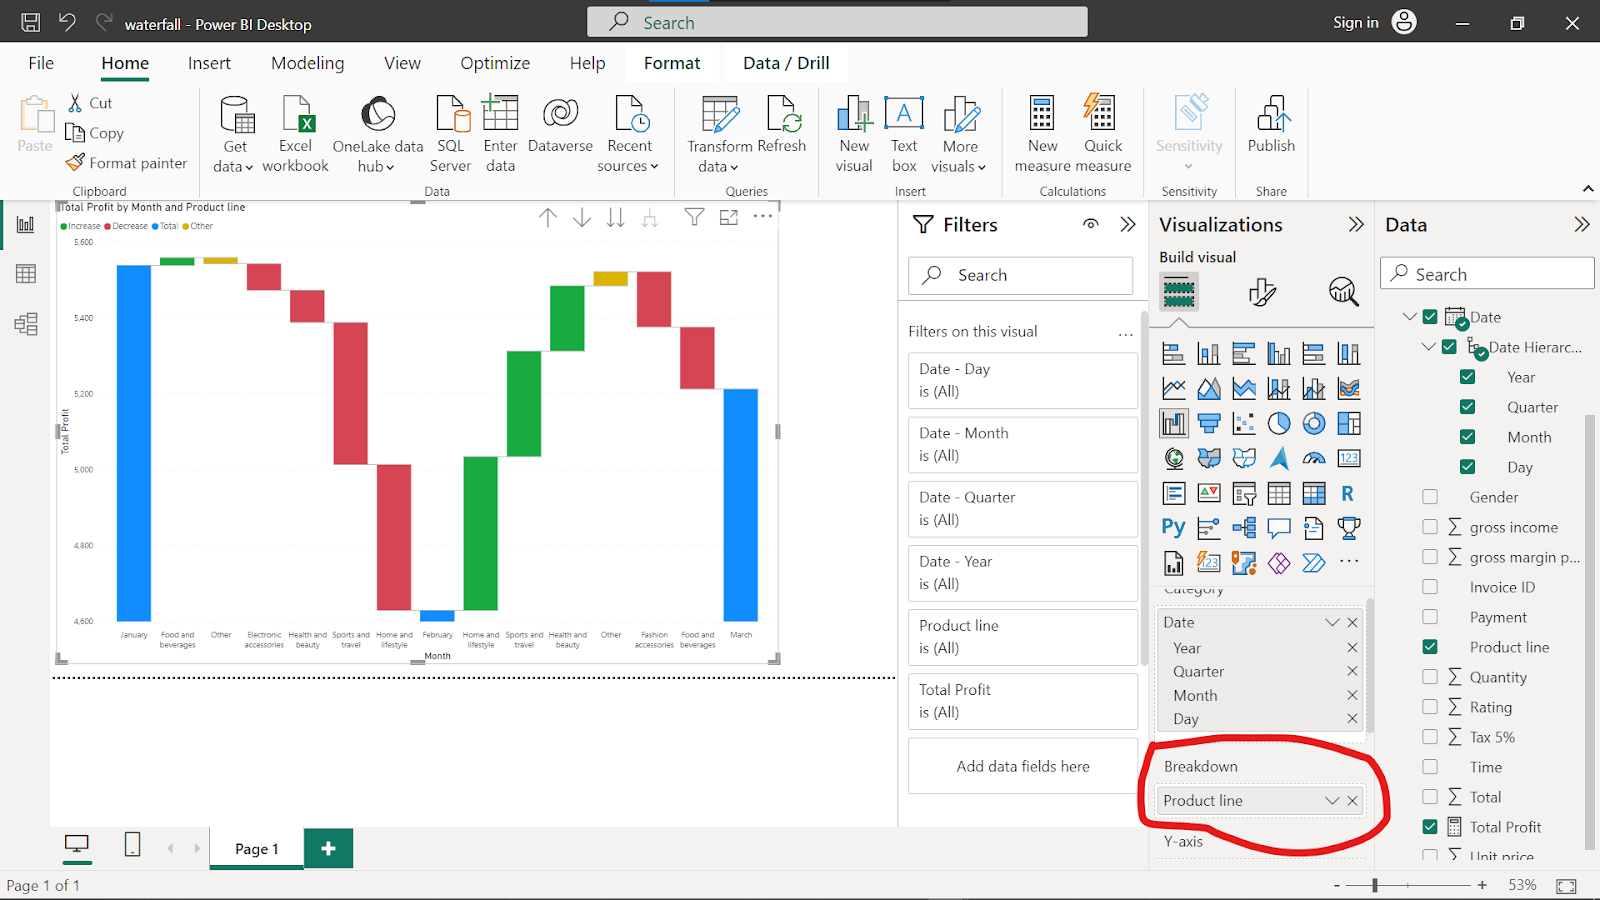
Add breakdown to the waterfall chart. Image by Author
By adding Product line as a breakdown to the waterfall chart, the columns now represent the difference in profit between the current month and the next month. If the profit in the next month is higher than the current month, it shows an increase signified by green, and it's red if it moves in other direction. The waterfall chart groups other categories in the Product line as Other.
One cool feature about Power BI: If you hover over each chart column, you will get information about the percentage increase or decrease between profits for two consecutive months. You will notice, for example, that the highest profit increase was in food and beverage products between January and February, with a change of 2.2%, while the lowest was in home and lifestyle products, with a decrease of 39.33%.
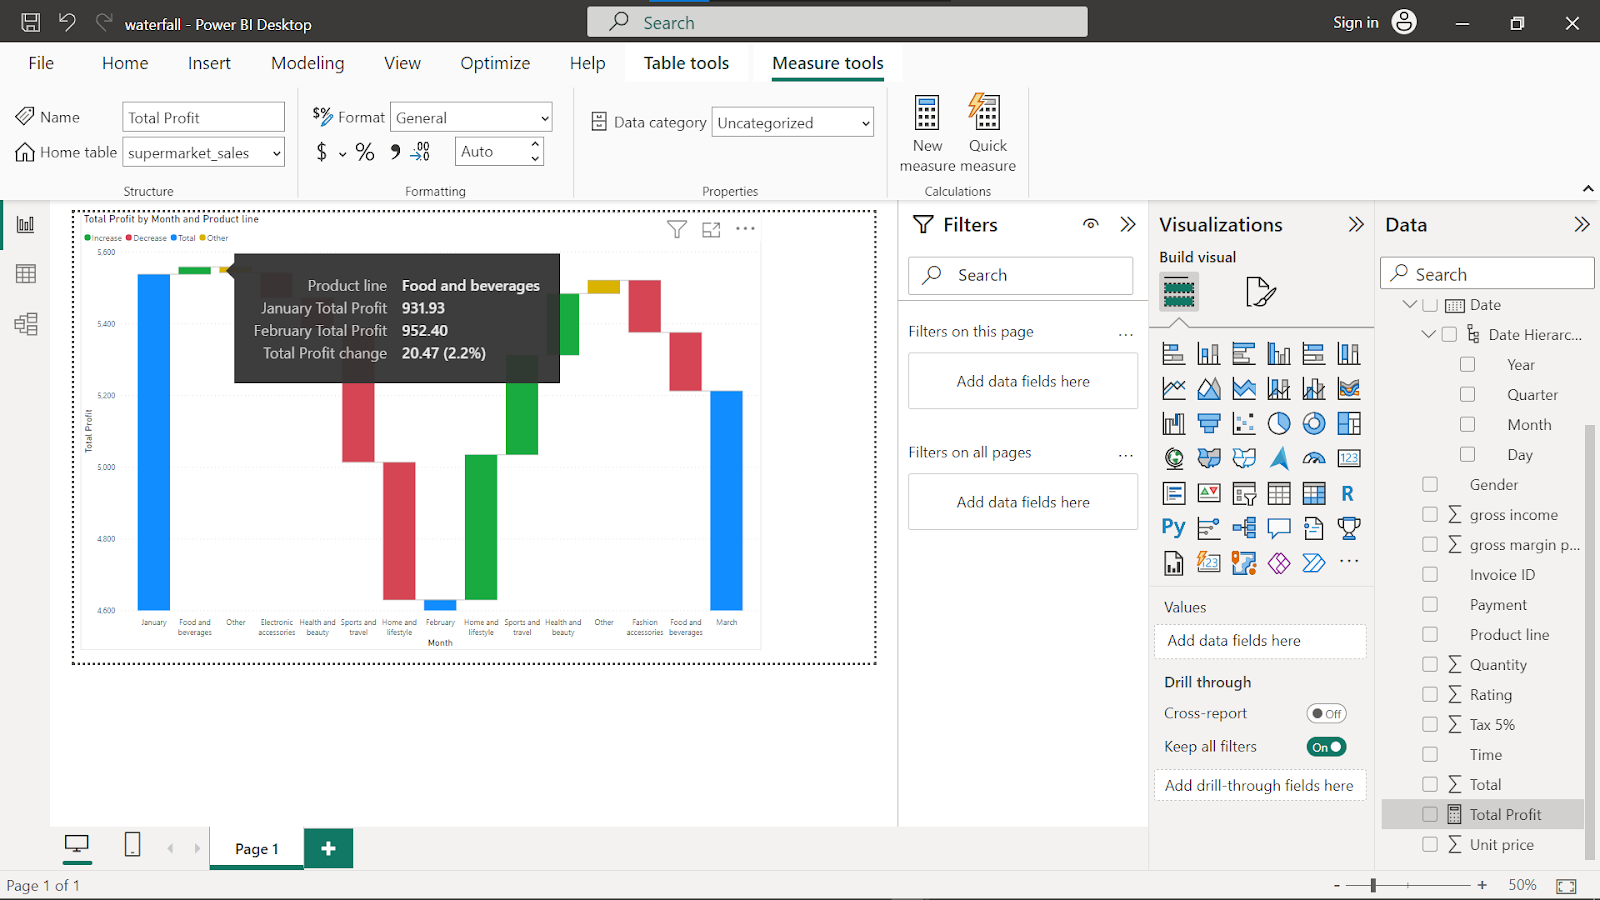
Hover the waterfall chart to get numerical information. Image by Author
You can customize the waterfall chart by setting the number of breakdowns in each column.
- Click on your visual.
- On the visualization pane, go to Format your visual.
- Click on Breakdowns and set the preferred number of breakdowns. The maximum number of breakdowns you can set is the number of categories in the breakdown variable.
Customize the breakdown numbers. Image by Author
Step 4: Sorting the waterfall chart
You will notice that the waterfall chart is sorted chronologically by month. You can change the sorting to get different perspectives of the data.
On the waterfall chart, click on More options, then Sort Descending. This will change the sorting of the Month category to reverse chronological order.
Apply sort descending. Image by Author
You can change the axis used in sorting from Month to Total Profit by clicking on More options on the visual, then Sort, and selecting the variable or measure to sort by.
Change the sort variable. Image by Author
When you apply sort ascending by Total Profit, the chart will display the columns of each month starting from the lowest to the highest and from the highest to the lowest when sort descending is applied.
Step 5: Adding advanced customizations
Power BI offers many options to customize the waterfall chart to better suit your narrative—these range from changing the chart colors to adding labels and filters.
Change column colors.
Colors make it easy to distinguish between increases and decreases in the waterfall chart and also make your visual more aesthetic. Change the colors of the column:
- Click on your visual.
- Go to Format your visual on the Visualizations pane.
- Click on the Columns dropdown to display various options to customize the columns in the waterfall chart.
- Select the Colors dropdown to customize the columns in the waterfall chart.
Add colors to the waterfall chart. Image by Author
Add labels
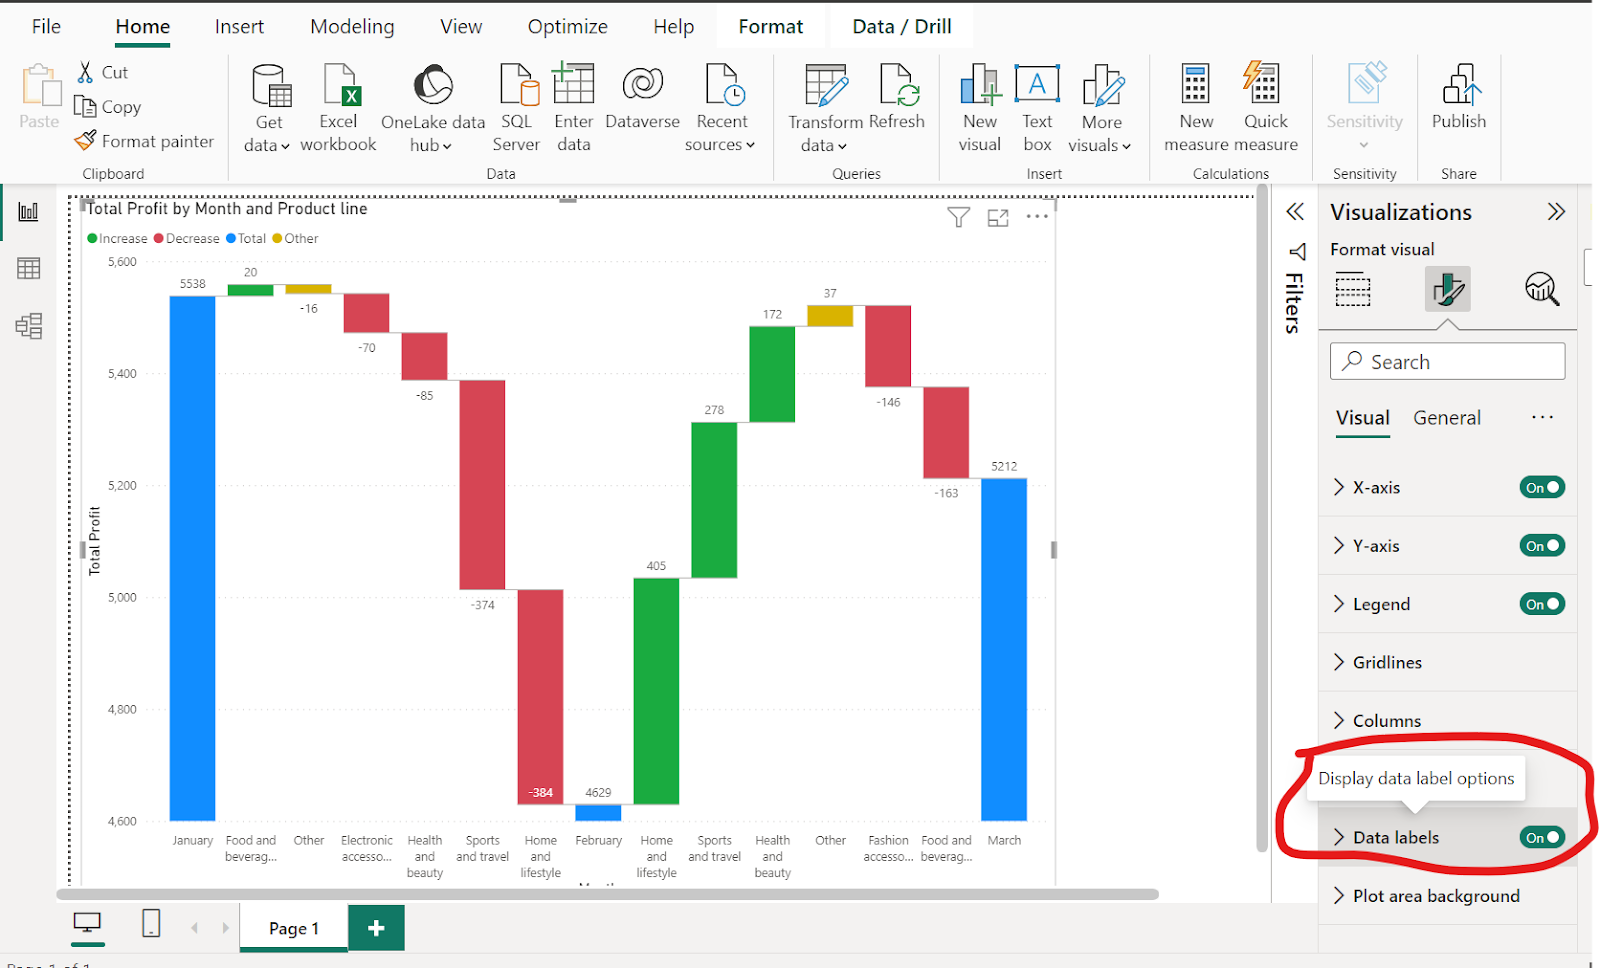
Data labels allow anyone viewing the visual to know the actual value of each column, which is essential if you have columns of similar heights in your chart.
- Select your visual, and go to the Visualizations pane.
- Click on the Format your visual tab.
- Turn on the Data labels toggle.
The waterfall chart will display the value of the profit difference between two consecutive months for each product.
Add data labels to the waterfall chart. Image by Author
Adding filters
What if you want to know what the whole waterfall looks like for a particular category? This is where filtering comes into play. You can filter your visual to show information about a single category. For example, you could filter the waterfall chart by applying the Customer type variable.
- Select your visual and go to the Filters pane.
- Drag the Customer type variable into the Add data fields here field on the Filters pane.
- Under the Customer type column in the Filters pane, you will see a list of all the categories. Select any category to see a waterfall chart for that specific category.
Apply filtering to a waterfall chart. Image by Author
Best Practices for Power BI Waterfall Charts
Consider these subtle enhancements that can transform a straightforward waterfall chart into a more refined, insightful visual:
Tips for clarity and readability
- Dynamic, Contextual Tooltips: Go beyond the default data labels. Create custom tooltips that not only show raw numbers but also provide context—like historical trends, relevant benchmarks, or even brief annotations. This layered information can reveal insights without crowding the main visual.
- Precision in Cumulative Calculations: Waterfall charts build on successive values, so rounding can introduce visual artifacts that mislead. Fine-tune your precision settings and be mindful of how small rounding differences might impact the overall narrative.
- Refined Color Saturation: Rather than simply assigning a distinct color to each category, play with saturation and brightness. Use a more saturated color to draw attention to key contributors, while subtler tones can indicate minor changes. This layered approach can make your chart more intuitive and reduce reliance on labels alone.
- Integrating Reference Lines or Benchmarks: Embedding a faint reference line for industry averages, targets, or historical medians can add a layer of context. This gives your audience a baseline for comparison, turning raw cumulative values into actionable insights.
- Adaptive Layout for Varied Displays:Consider how your waterfall chart will look across different devices and screen sizes. Subtle adjustments to bar width, font size, and spacing can make a difference.
Become a Power BI Data Analyst
Master the world's most popular business intelligence tool.
Common mistakes to avoid
Also, try to avoid some common mistakes.
- Using Waterfall Charts for Unmeaningful Categories: Imagine using a waterfall chart to show different characteristics of cars, such as speed, weight, price, and fuel efficiency. Adding or subtracting these unrelated metrics wouldn’t produce a meaningful result, and the cumulative total would not make sense.
- Overcrowding: When using breakdowns to explain variances between columns in your waterfall chart, make sure you don’t overcrowd the chart with too much info. Let’s say you have a variable with ten categories. You can add a breakdown of five, where the fifth category would encompass other categories not visible in the waterfall chart to prevent you from overcrowding your chart, making it a bit more simple.
- Not Sorting the Data Properly: By sorting your waterfall chart, you make it easy for your audience. Let’s say you are working with a month category. For this category, sort it in chronological order, not by value. But in cases where you are not working with a category with a defined chronological order, you can instead sort by the value in ascending or descending order.
Conclusion
The waterfall chart is famous because it can show the pattern of a variable from baseline to a final value while showing the contribution of other factors over time. Maybe, no other chart does this quite as well, which is why is has gained wide acceptance and use in finance and project management.
In this article, you have learned how to use Power BI to build and customize your very own waterfall chart. You have also learned the best practices to follow and pitfalls to avoid. Browse through DataLab datasets to keep practicing the steps covered in this article.
You can also check the following courses to learn more on Power BI.
Check out the following posts to dive deep into some of the concepts discussed in this article.
Experienced data science instructor and Biostatistician with expertise in Python, R, and machine learning.
Power BI Waterfall Chart FAQs
What is a waterfall chart?
A waterfall or bridge chart visually represents how a factor is affected by increases and decreases over a specific factor.
In which fields are waterfall charts mostly used?
A waterfall chart can visualize data in any field but is mostly used in finance, project management, and performance evaluation.
How do I create a basic waterfall chart?
You can create a waterfall chart using BI tools like Power BI.
What are the possible ways of customizing a waterfall chart in Power BI?
You can customize a waterfall chart by adding breakdowns to explain variances, changing column colors, adding data labels, applying filters, or sorting the chart by different variables.
What are some best practices for creating a waterfall chart?
Using a zero baseline, connecting bars with guidelines, using horizontal charts for long labels, or using distinctive colors for different elements.
Learn Power BI with DataCamp
course
Data Visualization in Power BI
course
Data Transformation in Power BI
tutorial
How to Create a Waterfall Chart in Tableau

Eugenia Anello
8 min
tutorial
Power BI Gantt Chart: A Complete How-To

Adejumo Ridwan Suleiman
9 min
tutorial
Power BI Tutorial for Beginners

DataCamp Team
16 min
tutorial
Power BI Dashboard Tutorial
tutorial
A Step-By-Step Guide to Visualizing KPIs in Power BI
code-along
Getting Started with Data Visualization in Power BI

Nick Switzer