Course
Understanding Data Science
2 hr
856.8K
As part of Data Literacy Month, this series will clarify key concepts from the world of data, answer the questions you may be too afraid to ask and have fun along the way. If you want to start at the beginning, read our first entry in the series: What is a Dataset?
Ever heard the phrase ‘correlation does not imply causation’? It’s a common pitfall that trips up data enthusiasts and professionals alike. In this article, we’ll explore the key differences between correlation and causation, debunk myths, and share real-world examples to help you avoid one of the biggest errors in data interpretation.
Correlation is a measure of the relationship between two things. That is when one thing goes up, does the other thing go up or down? The scatter plot below shows data from the 2017 American Community Survey. On the x-axis, you can see the average yearly income for each of the fifty US states, and on the y-axis, you can see the average monthly rent payments for those states. As incomes increase, so do rent payments.
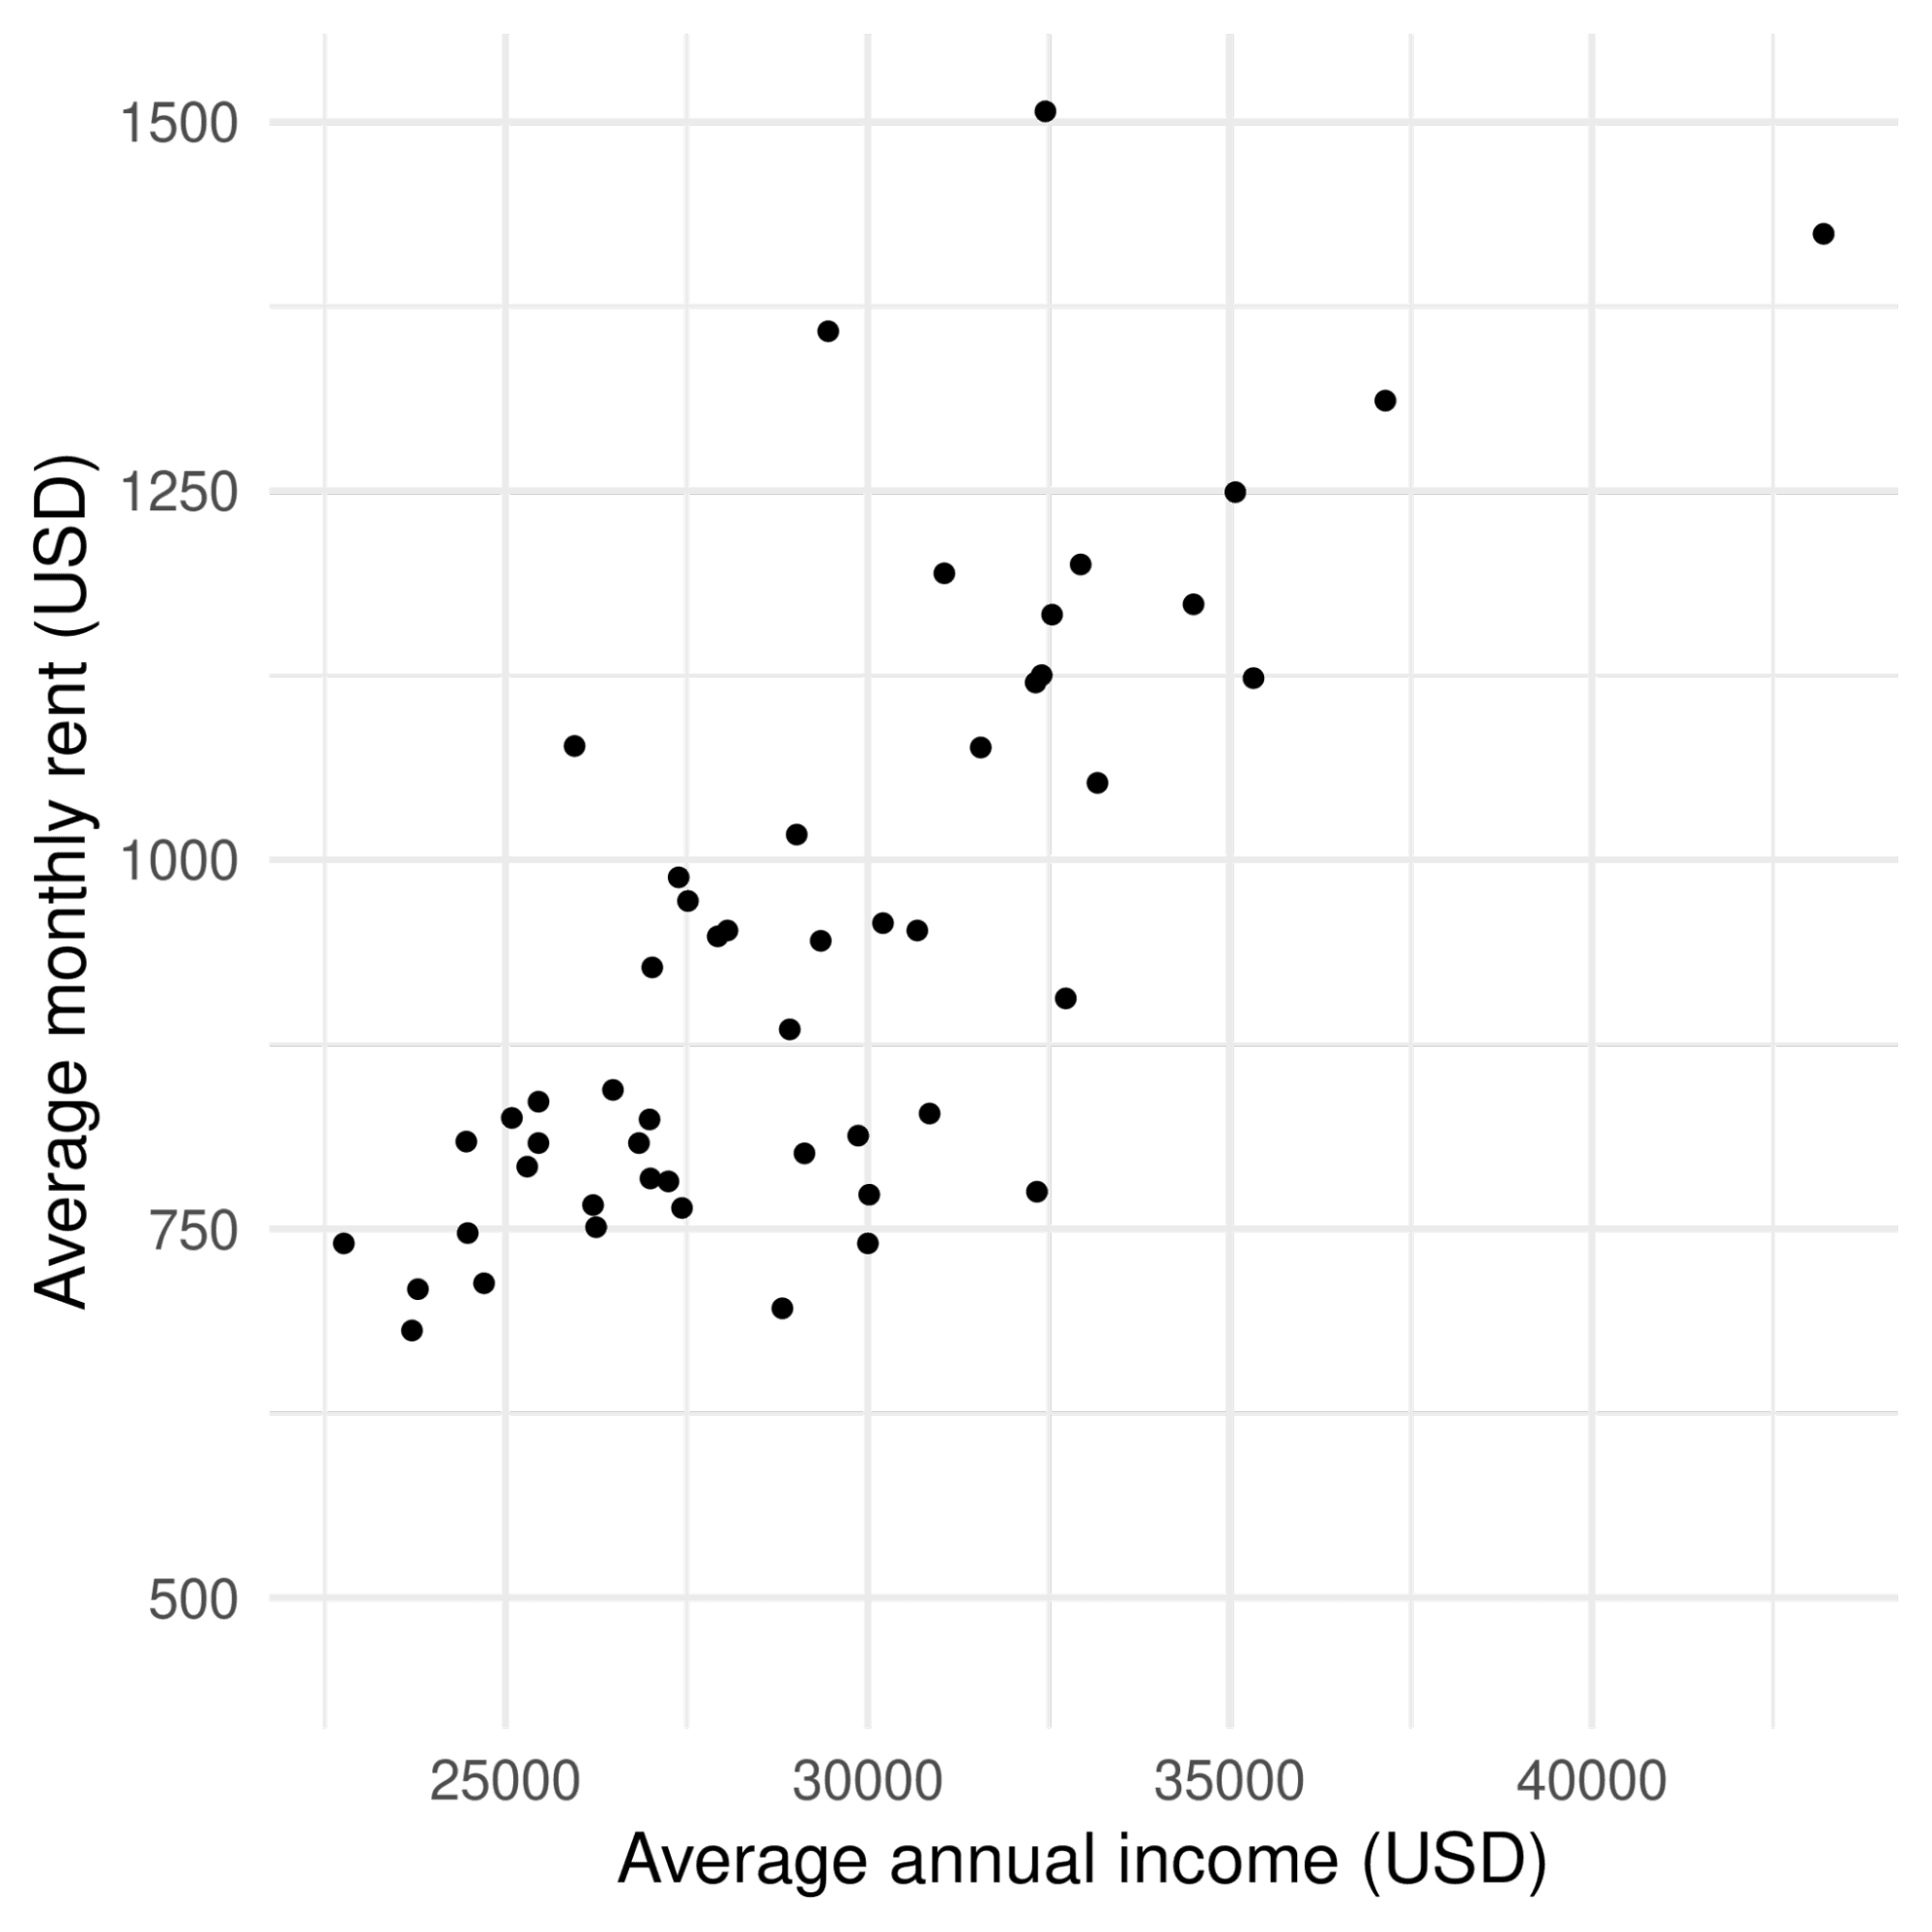
Annual Income compared to Average Monthly Rent (in USD)
If one thing goes up when the other goes up—as in this case—they are said to be positively correlated. They are said to be negatively correlated if one goes down when the other goes up.
In statistics and data science, correlation is more precise, referring to the strength of a linear relationship between two things. In the variation of the scatter plot below, a straight line has been fitted through the data. The line follows the points fairly closely, indicating a linear relationship between income and rent.
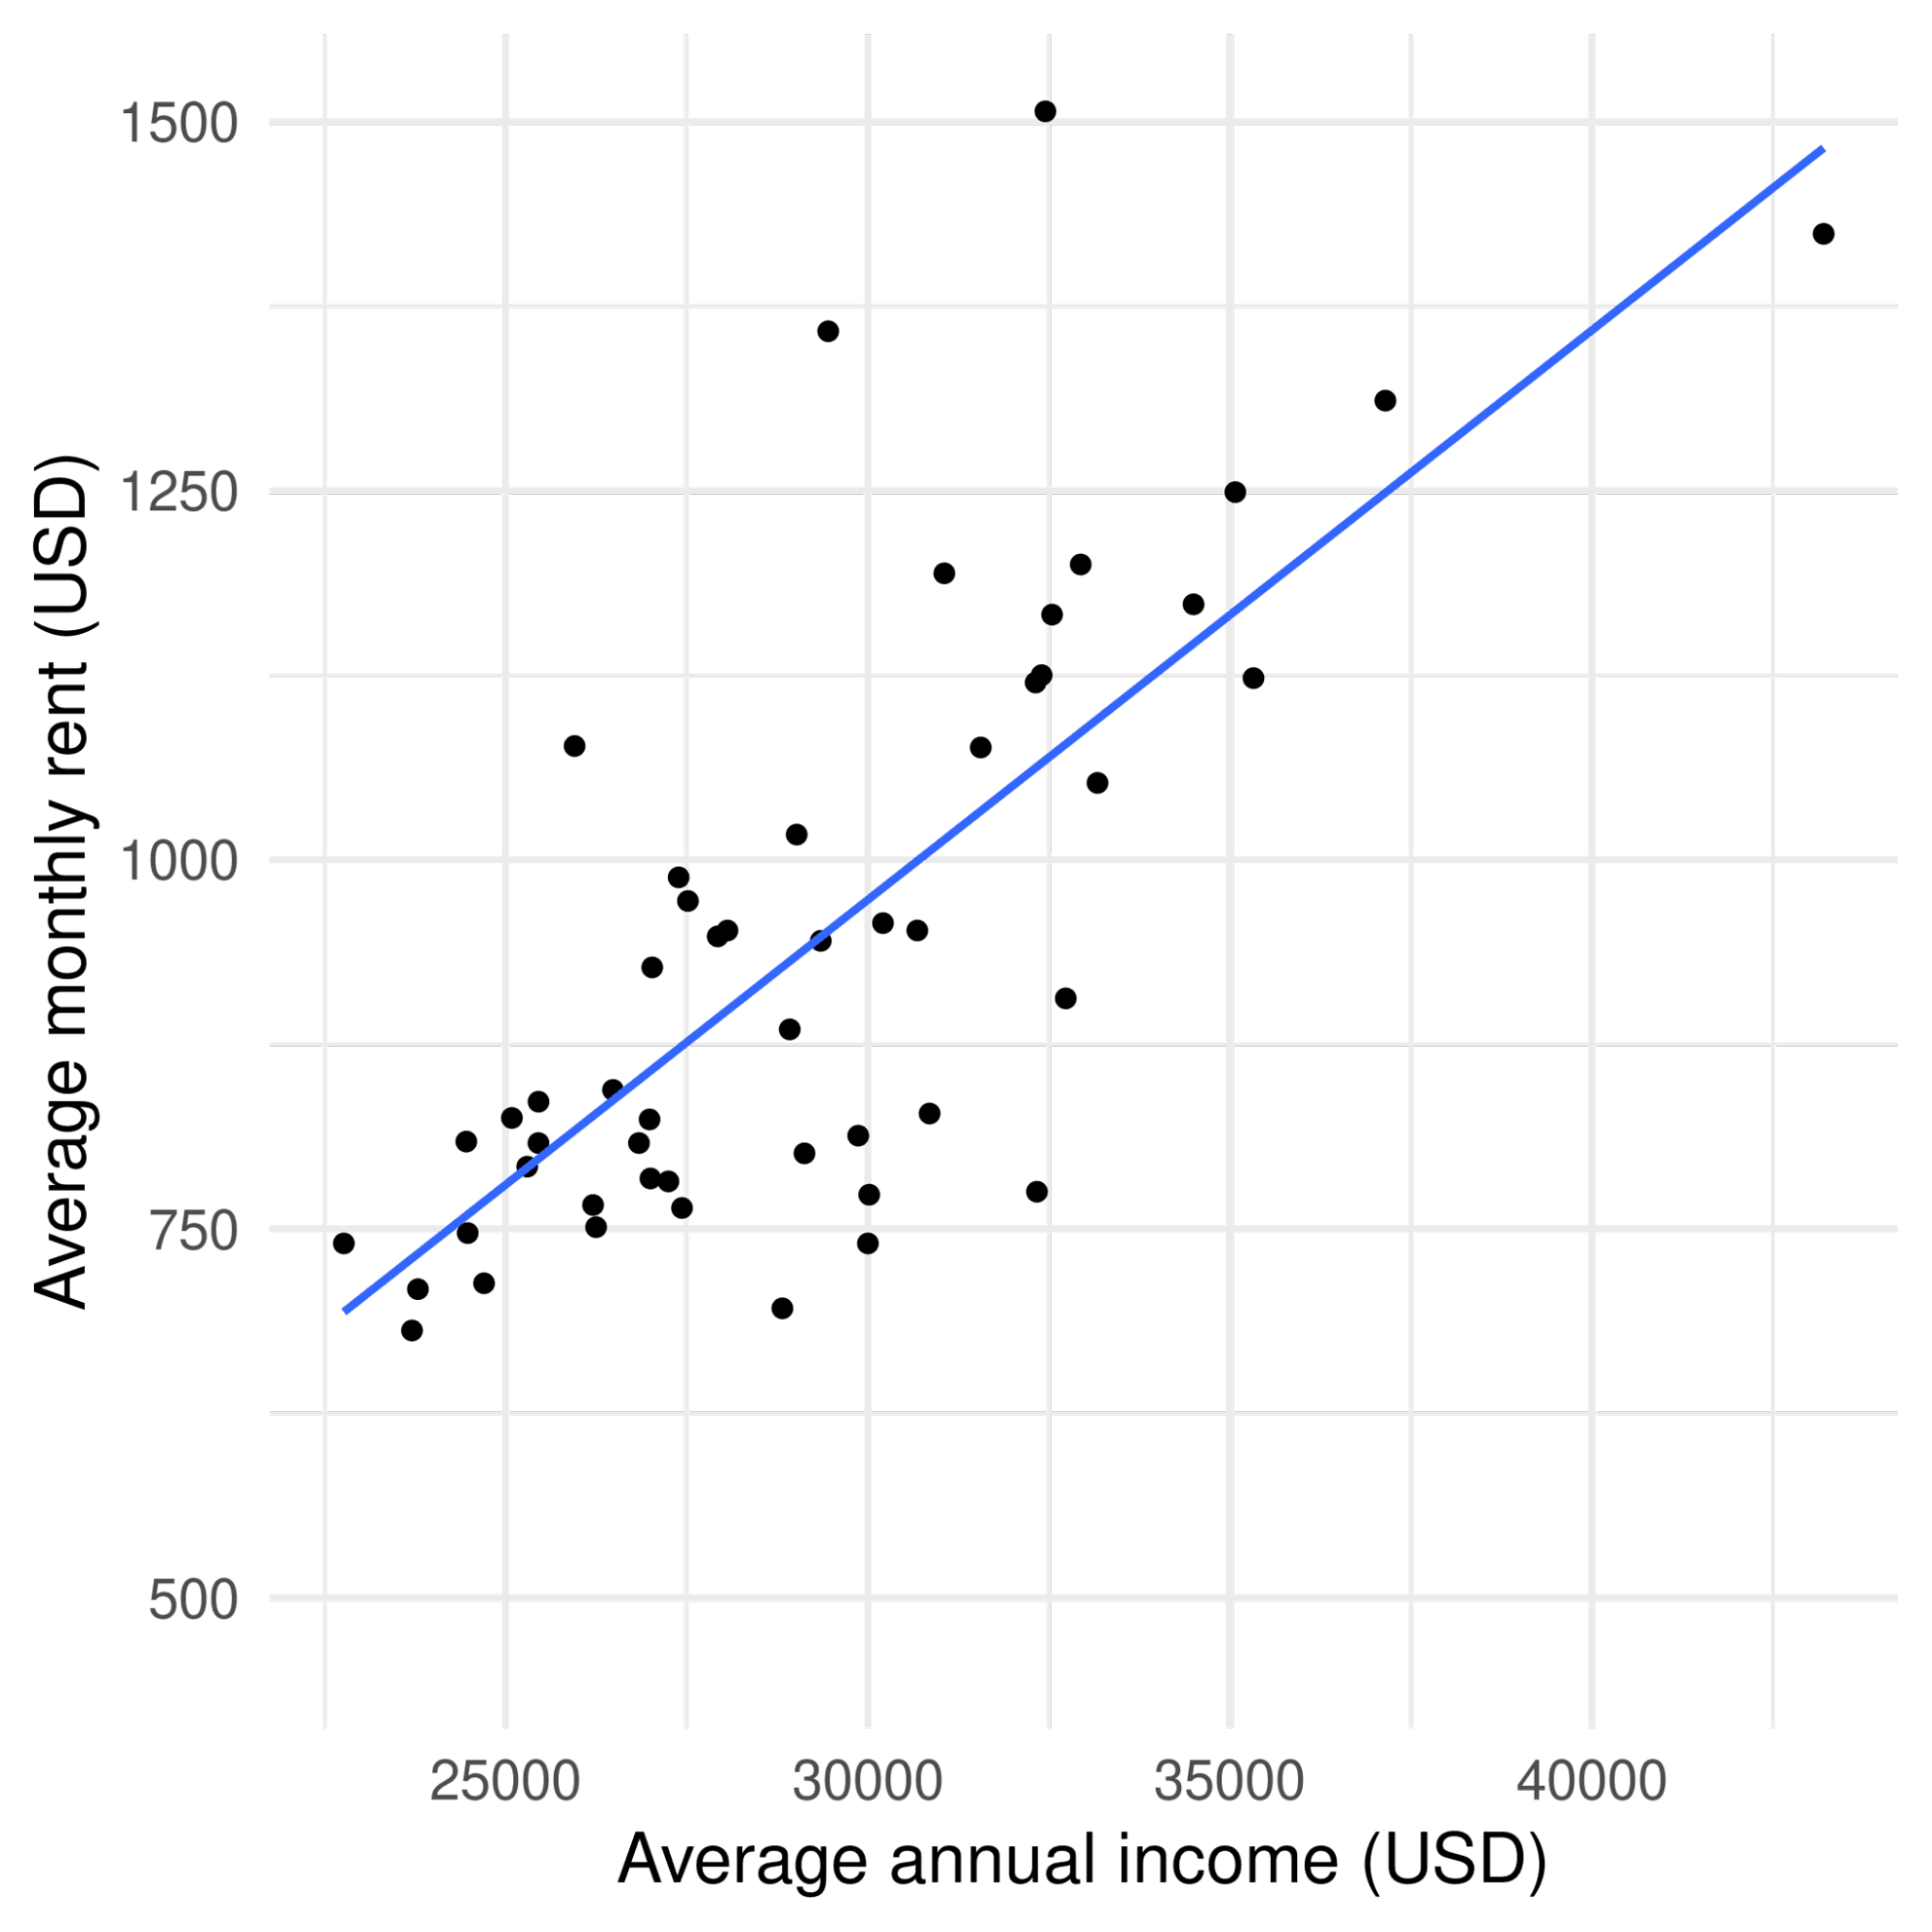
A fitted line between the two variables, indicating a positive relationship between both of them
By contrast, in this example below, using the classic diamonds dataset, if we plot the price of a diamond against its weight in carats and draw a line of best fit through it, you can see that the line curves upwards. That is, the price increases faster than linearly.
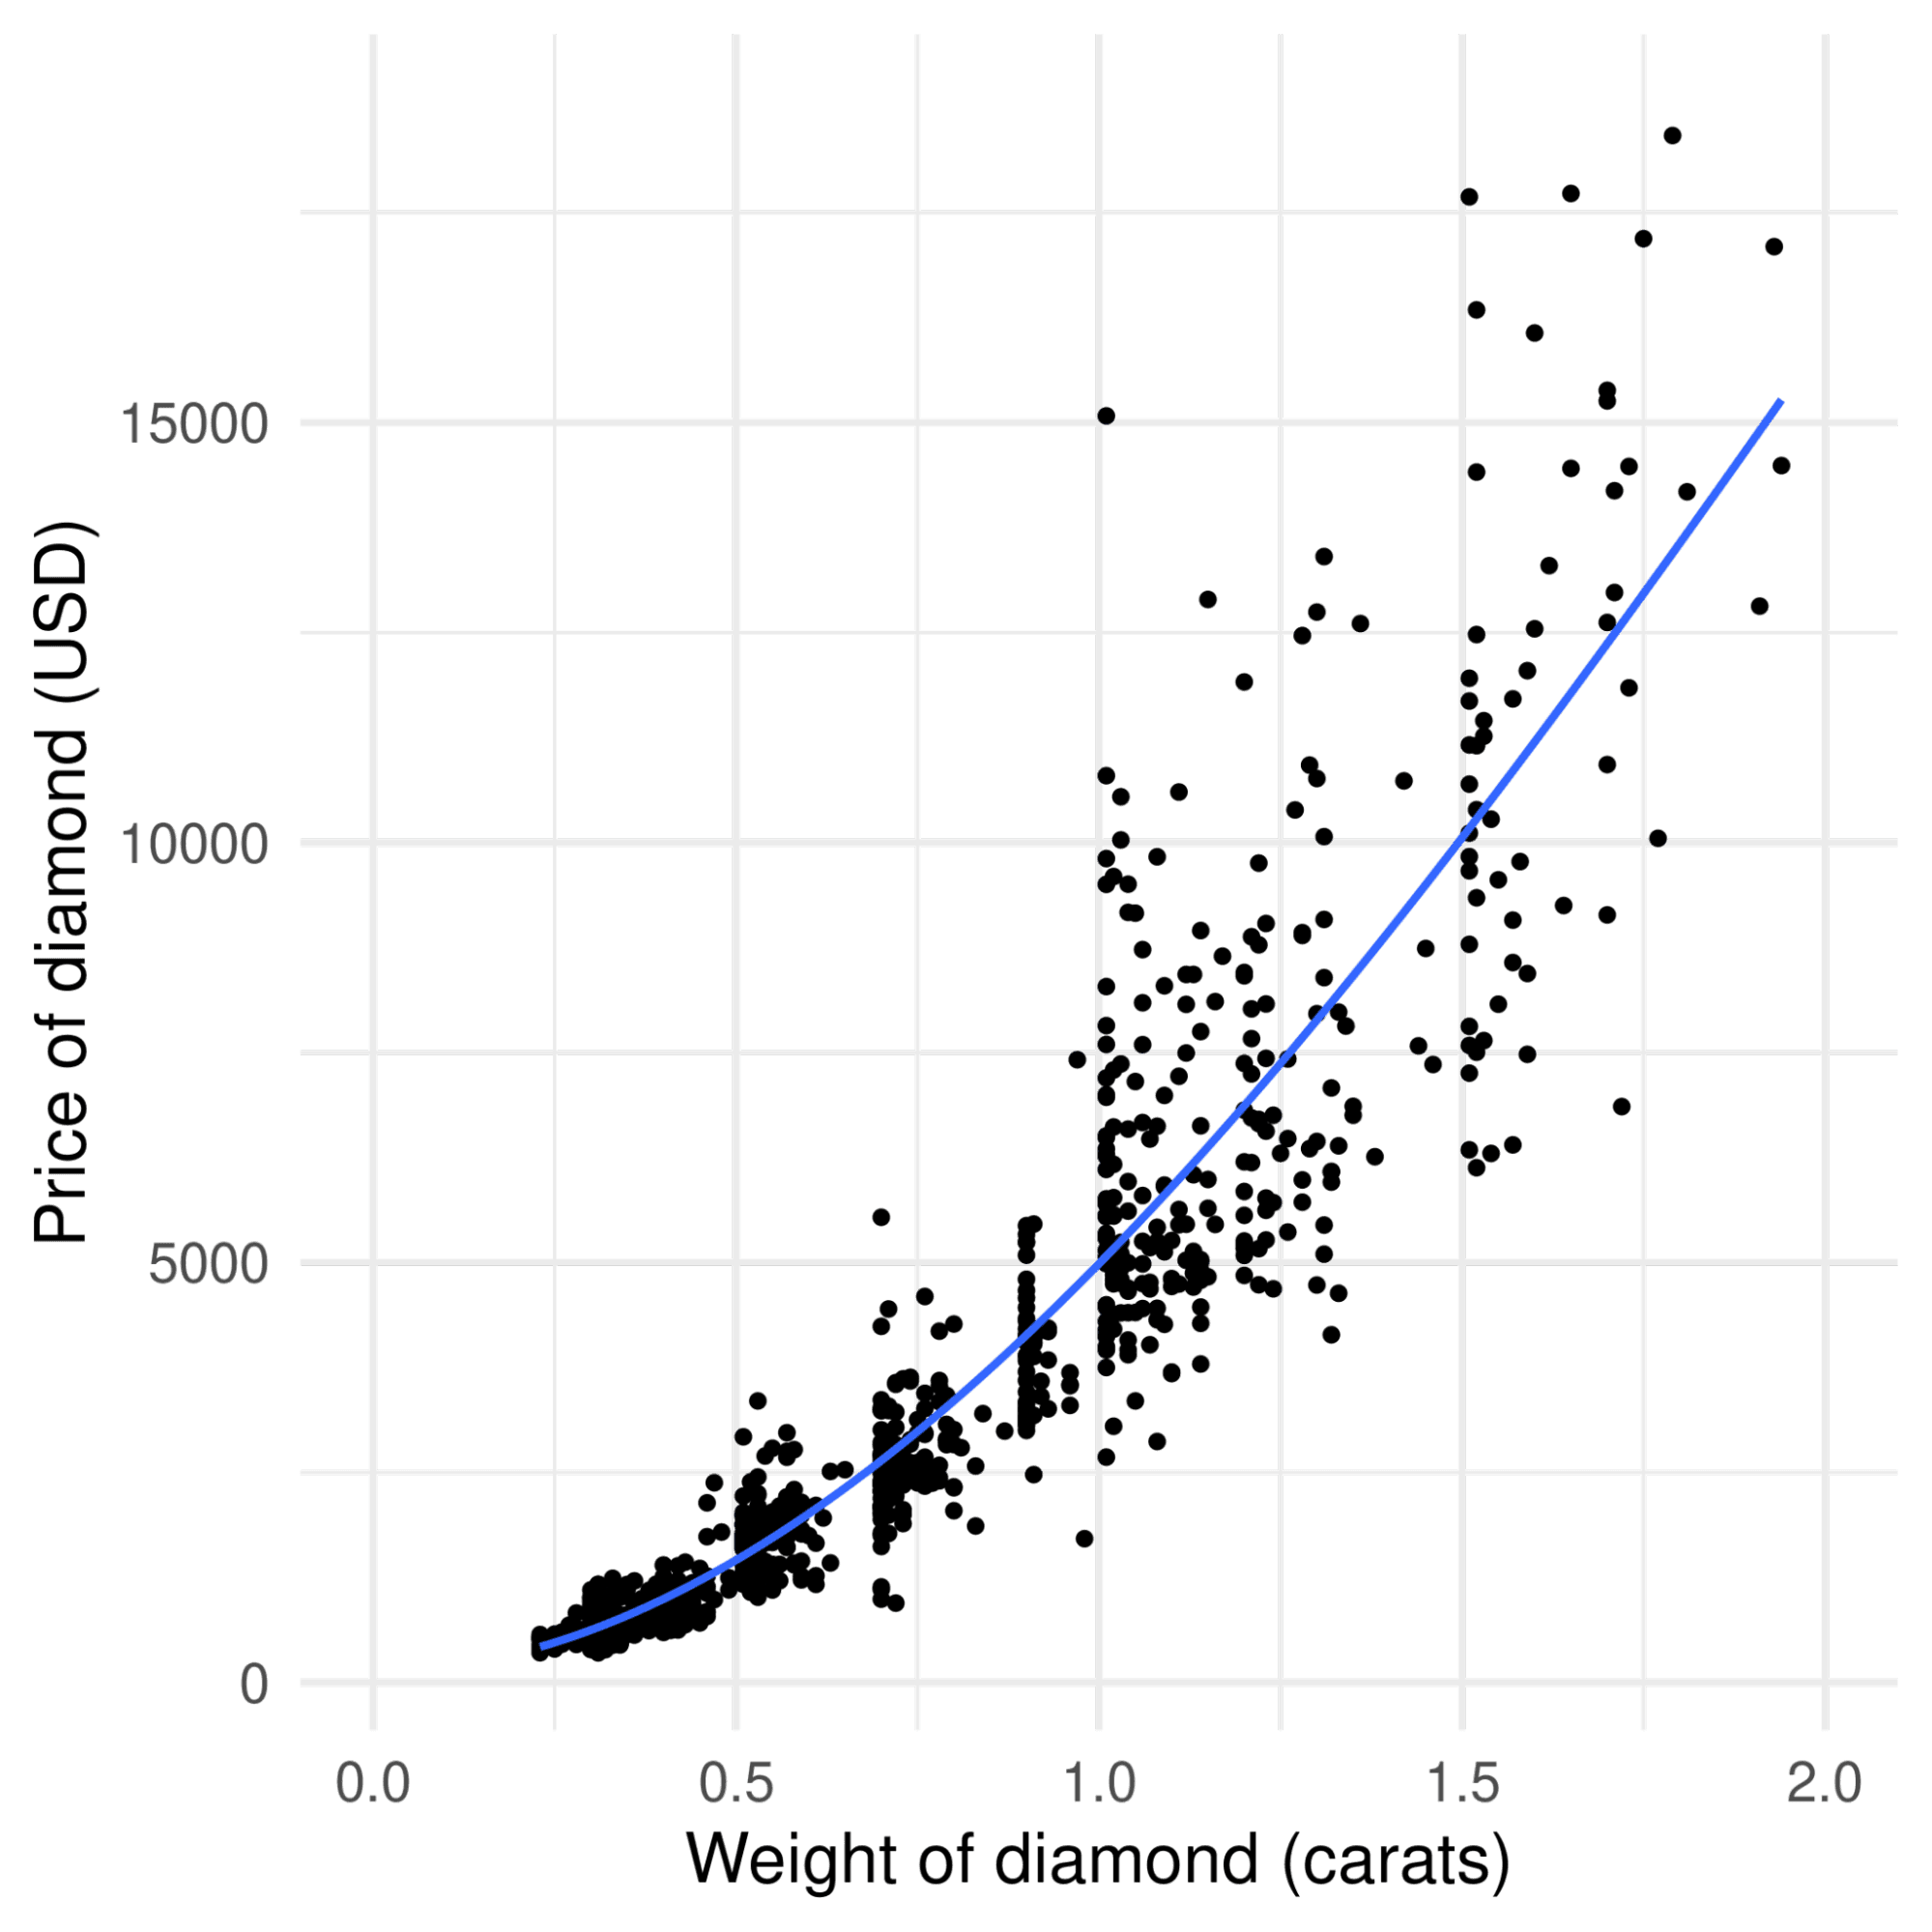
Correlation will capture the positive relationship between the two things—as weight increases, so does the price—but not the non-linear aspect of that relationship.
Causation is a stronger statement than correlation. It means that changes in one thing cause another thing to change. You see examples of causation a lot in medical advice, for example, "smoking causes cancer" or "taking ibuprofen reduces pain levels."
You can also see many examples of causation in day-to-day life. Eating healthy causes improved lifestyle outcomes, working out causes you to become in better shape, and studying on DataCamp causes you to know more about data.
The correlation-causation fallacy is when people assume a cause-and-effect relationship simply from correlation. In the example with income and rent, the data showed that rent payments are positively correlated with income. However, economics is complicated, and the data is insufficient to make the bolder claim that higher income causes higher rent payments.
The correlation-causation fallacy is prevalent in most societies since everyone working in marketing would like you to believe that buying their product causes your life to be better without taking the time to run a rigorous scientific experiment to test that. This idea was taken to its logical conclusion in The Tamperer's 1990s pop tune If you Buy This Record (Your Life Will Be Better). A correlation can occur in three main cases, but causation does not.
Given enough data, two completely unrelated things can show a correlation. The example below is taken from Tyler Vigen's excellent Spurious Correlations site. The line plot shows that the divorce rate in the US state of Maine is highly correlated with per capita consumption of margarine.
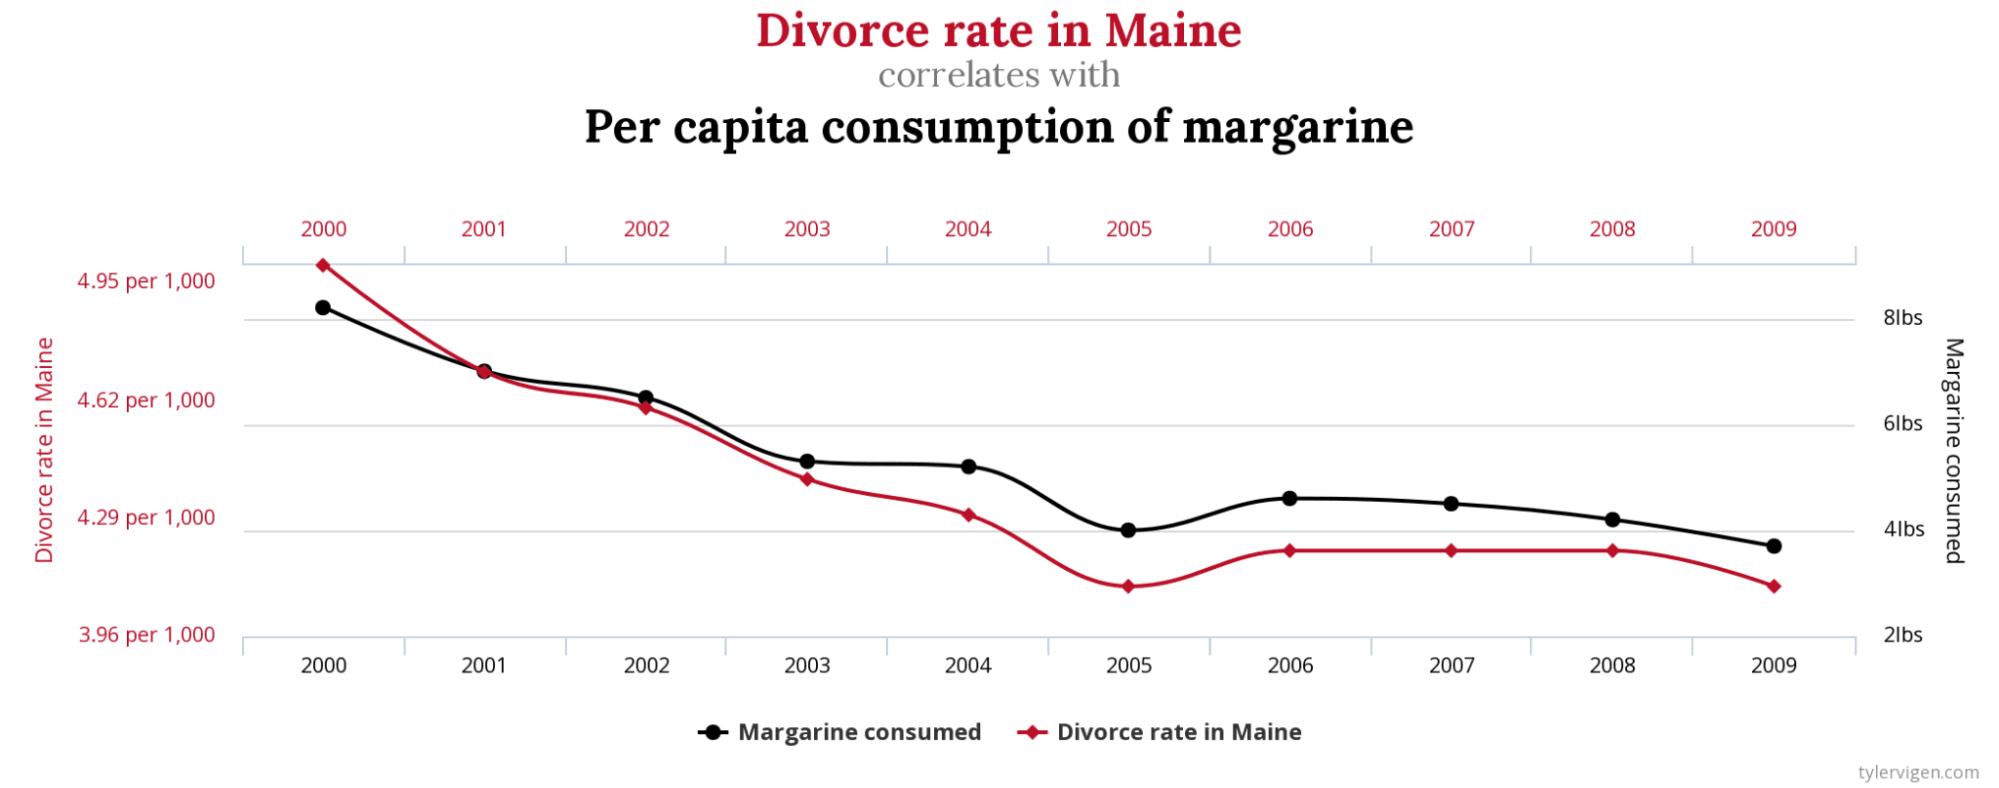
It would be absurd to think that eating more or less margarine could influence a divorce rate on a state-wide level, so we cannot claim causation. The correlation shown here is purely coincidental.
Even investors aren't immune to this logical fallacy. The Super Bowl Indicator suggests that the stock market will rise if a team from the National Football Conference wins the Super Bowl tournament. If a team from the American Football Conference wins, it will drop.
Correlations can appear when a third thing (a "confounding variable") affects both the supposed cause and the supposed effect.
A classic example is that sunburns are correlated with ice cream sales. It would be silly to say that eating ice cream causes an increase in sunburns. A more reasonable explanation is that in hot, sunny weather, people are more likely to eat ice cream, and people are also more likely to go sunbathing. So the weather is a confounding variable.
In 2001 a scientific paper noted that people who eat lots of vegetables and olive oil have less wrinkly skin. That's a valid observation, but Ben Goldacre noted in a TED talk that nutritionists pounced on this result and began claiming that eating olive oil causes you to get fewer wrinkles. This ignores the effect of several confounding factors. Olive oil is expensive compared to other cooking oils, so if you can afford olive oil, you are more likely to have an indoor job with less sun exposure and less likely to smoke. Not to mention one of the hundreds of other lifestyle differences that aren't considered in the study.
Reverse causation is when people get confused and which thing causes what. A silly example is that when wind turbines spin faster, you also detect faster wind speed, so you conclude that wind is caused by wind turbines spinning. Taking a moment to think about this, you should realize that the causation should be the other way around: wind causes wind turbines to spin.
Understanding the direction of causality is a common problem with medical data analysis. For example, there is a positive correlation between depression and cannabis usage. That is, people who are depressed are more likely to smoke cannabis. For example, this scientific paper found that in 2016, people with depression had 216% higher odds of smoking cannabis near-daily compared to people who weren't depressed.
There has been a lot of debate about which thing causes which. Does smoking cannabis cause depression, or does having depression make you more likely to smoke cannabis? This scientific paper suggests that causation may happen in both directions. There is also some evidence that the use of cannabis may lead to the onset of depression; however, strong evidence points to the inverse association, i.e., that depression may lead to the onset or increase in cannabis use frequency.
Determining causation can be trickier than one might think. To establish causation, you need four things.
When exploring relationships between things, there are two types of study.
Observational studies usually make it very difficult or impossible to determine causation. However, experiments (designed and conducted correctly) allow causation to be determined. You can read more about experiments in our next entry of Data Demystified on A/B testing.
In summary, the correlation-causation fallacy has been widely studied and is one of the biggest pitfalls you can fall into early in your data upskilling journey. Here are things to remember:
To take your skills to the next level, take Introduction to Statistics and start your data literacy journey. The next entry in the data demystified series covers the experimentation more deeply, focusing on a practice called A/B testing. In the meantime, check out the following resources:
Data Literacy Courses
Course
Course
Course
blog
Richie Cotton
5 min
blog
Matt Crabtree
10 min
blog
Austin Chia
8 min
blog
Matt Crabtree
15 min
Tutorial
Arunn Thevapalan
Tutorial
Javier Canales Luna