Estatísticas em R

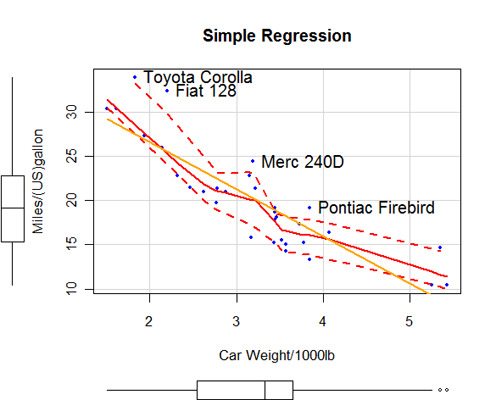
Esta seção descreve estatísticas básicas (e não tão básicas). Inclui código para obter estatísticas descritivas, contagens de frequência e tabulações cruzadas (incluindo testes de independência), correlações(pearson, spearman, kendall, policórica), testes t (com variâncias iguais e desiguais), testes não paramétricos de diferenças de grupo (Mann Whitney U, Wilcoxon Signed Rank, teste de Kruskall Wallis, teste de Friedman), regressão linear múltipla (incluindo diagnósticos, validação cruzada e seleção de variáveis), análise de variância (incluindo ANCOVA e MANOVA) e estatísticas baseadas em reamostragem.
Como as análises modernas de dados quase sempre envolvem avaliações gráficas de relações e suposições, são fornecidos links para métodos gráficos apropriados.
É sempre importante verificar as suposições do modelo antes de fazer inferências estatísticas. Embora seja um tanto artificial separar a modelagem de regressão e uma estrutura ANOVA nesse sentido, muitas pessoas aprendem esses tópicos separadamente, portanto, segui a mesma convenção aqui.
Os diagnósticos de regressão abrangem outliers, observações influentes, não normalidade, variância de erro não constante, multicolinearidade, não linearidade e não independência de erros. As premissas de teste clássicas para ANOVA/ANCOVA/MANCOVA incluem a avaliação da normalidade e da homogeneidade das variações no caso univariado, e a normalidade multivariada e a homogeneidade das matrizes de covariância no caso multivariado. A identificação de outliers multivariados também é considerada.
A análise de potência fornece métodos de análise de potência estatística e estimativa de tamanho de amostra para uma variedade de projetos.
Por fim, são descritas duas funções que ajudam no processamento eficiente(com e por).
Estatísticas avançadas

Esta seção descreve métodos estatísticos mais avançados. Isso inclui a descoberta e a exploração de relações multivariadas complexas entre variáveis. Você também encontrará links para métodos gráficos apropriados.
É difícil ordenar esses tópicos de forma direta. Escolhi os seguintes títulos (reconhecidamente arbitrários).
Modelos preditivos
Em modelos preditivos, temos modelos lineares generalizados (incluindo regressão logística, regressão de poisson e análise de sobrevivência), análise de função discriminante (linear e quadrática) e modelagem de séries temporais.
Modelos de variáveis latentes
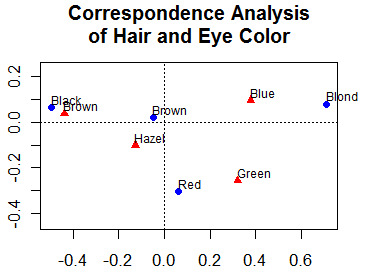
Isso inclui análise fatorial (componentes principais, análise fatorial exploratória e confirmatória), análise de correspondência e escalonamento multidimensional(métrico e não métrico).
Métodos de particionamento
A análise de cluster inclui abordagens de particionamento (k-means), aglomerativas hierárquicas e baseadas em modelos. Os métodos baseados em árvores (que poderiam facilmente ter sido incluídos em modelos preditivos!) incluem árvores de classificação e regressão, florestas aleatórias e outras metodologias de particionamento.
Outras ferramentas
Esta seção inclui ferramentas que são amplamente úteis, inclusive bootstrapping em R e programação de álgebra matricial (pense em MATRIX no SPSS ou PROC IML no SAS).
Indo além
Para praticar estatística em R de forma interativa, experimente este curso sobre introdução à estatística.
Experimente o curso Supervised Learning in R, que inclui um exercício com Random Forests.